
Abstract
Identifying subsets of genes that jointly mediate cancer etiology, progression, or therapy response remains a challenging problem due to the complexity and heterogeneity in cancer biology, a problem further exacerbated by the relatively small number of cancer samples profiled as compared with the sheer number of potential molecular factors involved. Pure data-driven methods that merely rely on multiomics data have been successful in discovering potentially functional genes but suffer from high false-positive rates and tend to report subsets of genes whose biological interrelationships are unclear. Recently, integrative data-driven models have been developed to integrate multiomics data with signaling pathway networks in order to identify pathways associated with clinical or biological phenotypes. However, these approaches suffer from an important drawback of being restricted to previously discovered pathway structures and miss novel genomic interactions as well as potential crosstalk among the pathways. In this article, we propose a novel coalition-based game-theoretic approach to overcome the challenge of identifying biologically relevant gene subnetworks associated with disease phenotypes. The algorithm starts from a set of seed genes and traverses a protein–protein interaction network to identify modulated subnetworks. The optimal set of modulated subnetworks is identified using Shapley value that accounts for both individual and collective utility of the subnetwork of genes. The algorithm is applied to two illustrative applications, including the identification of subnetworks associated with (i) disease progression risk in response to platinum-based therapy in ovarian cancer and (ii) immune infiltration in triple-negative breast cancer. The results demonstrate an improved predictive power of the proposed method when compared with state-of-the-art feature selection methods, with the added advantage of identifying novel potentially functional gene subnetworks that may provide insights into the mechanisms underlying cancer progression.
Keywords
Introduction
A critical problem in cancer research involves the identification of a subset of genes that play crucial roles in different stages of cancer progression from its early stages of carcinogen-esis up to the final stage of metastasis. A model that can reliably identify molecular determinants of clinical outcomes would not only enable the discovery of functional biomarkers predictive of therapy response or disease progression but also provide insights into novel therapeutic targets in this aggressive disease.
The design of data-driven models to identify aberrations in genes, including differential expression, somatic mutations, and copy-number alterations, that are associated with clinical outcomes has been the center of attention in the past few decades.1–3. This is accelerated in recent years due to a huge drop in the cost of next-generation RNA sequencing and genomics profiling and the availability of several public databases such as The Cancer Genome Atlas (TCGA).4–6
Pure data-driven models such as gene set enrichment analysis (GSEA) 2 that relate multimodal genomics measurement to clinical or biological phenotypes demonstrated a great success in the discovery of cancer biomarkers and subsets of genes enriched for a desired outcome. However, these methods suffer from a major drawback of high false discovery rate (FDR), where only a small subset of reported genes play significant roles in the cancer disease and the majority of reported genes are false alarms that arise from measurement noise, heterogeneity of cancer samples, and overfitting issue. Overfitting is unavoidable due to the extremely large number of predictors (such as gene expression data), which is in the orders of ten thousands with respect to the samples in the orders of hundreds for most cancers.
The second drawback of these methods is that the reported genes may or may not involve in a shared molecular interaction and hence provide minimal insight for molecular biology scientists to discover the actual underlying biological process that leads to the specific phenotype of interest. To avoid this drawback, recently, integrative models are proposed to integrate multiomics data with biologically driven pathway networks in order to identify biologically meaningful subnetworks of genes that are enriched for desired biological outcomes. However, these approaches suffer from another important drawback of restricting the identified genes to belong to puta-tively discovered pathway networks and miss the yet undiscovered genomic interactions as well as potential interpathway relations. In this work, we take an intermediate approach and use protein-protein interaction (PPI) networks as our basic interaction platform. PPI networks are similar to pathways in that both consist of interacting biomolecular entities affecting specific cellular functions. While pathway networks consist of a relatively small number of deeply characterized regulatory and signaling events representable as directed graphs, PPI networks capture genome-wide interactions derived from high-throughput molecular profiling and large-scale biological screens. PPI networks, which are represented as binary undirected graphs, capture direct, indirect, and as yet undiscovered regulatory interactions and can be understood to capture complex cellular logic as simplified connections between pairs of genes. 7 Thus, PPI networks provide more flexibility for the discovery of novel biological mechanisms underlying disease phenotypes. Moreover, edge ontology of signaling pathway networks are not well standardized, and this difference may cause a problem in inference algorithms. 8
As stated above, to reduce high false reporting rates and enhance generalizability of the developed input-output relation models, sparsity imposing methods are desired. Discriminative component analysis methods of dimensionality reduction such as canonical correlation analysis, linear discriminant analysis, and independent discriminant analysis are developed to project data into new subspaces, where a few components bear the most discriminative information about data, hence simplifying data storage, prediction, and interpretation. 9 Although very efficient in dimensionality reduction, these methods are not ideally suited for the identification of genes driving cancer progression, since the predictors are provided in the transformed subspace. 10
Explicit feature selection methods are divided into wrapper methods and filtering methods. 11 In filtering methods, the predictors are chosen based on their strong connection to the labels with less connection among the features using various geometric or information-theoretic measures, whereas in wrapper methods, the features are chosen based on their impact to the classifier. Wrapper methods require exhaustive search and are thereby computationally expensive, while filter methods with geometric distance measures are very fast but incapable of capturing nonlinear relations. On the other hand, information-theoretic filtering methods are very powerful but become computationally expensive. Furthermore, they require a large number of samples in order to obtain reliable empirical information-theoretic measures. 12 In cancer genomics, we are interested in methods that incorporate gene-interaction information such as PPI or biological pathway network databases in the feature selection process, in order to identify functionally related sets of genes that jointly discriminate between phenotypes.13,14
In this work, we develop a game-theoretic solution that develops pathways emerging from a seed gene set in PPI network by traversing the network to discover the most informative pathways associated with a desired outcome. This algorithm reports a set of compact subnetworks that are collectively associated with the modulation of a specific biological process or clinical outcome, thus facilitating the development of biomarkers using core representative nodes within the identified subnetworks, as opposed to measuring all the genes individually.
We highlight the utility of the proposed algorithm by applying it to two unique and challenging problems that differ both in terms of the nature of the molecular factors involved and the phenotype being modeled. In the first application, we focus on identifying gene subnetworks that are jointly associated with platinum resistance in ovarian cancer, whereas the second application focuses on discovering genomic determinants of immune infiltration in triple-negative breast cancer (TNBC). We show that our algorithm identifies biologically meaningful gene subsets in both applications, while achieving improved statistical association as compared with other feature selection algorithms.
Coalition game review
In this section, we introduce the concept of coalition game theory and its application in predictive modeling and feature selection considering the synergic predictive power of selected features. Coalition game refers to a class of games, where the players cooperate with one another by forming coalitions 15 as opposed to noncooperative games in which the players act individually and compete over a common resource. 16 Coalition games have been recently utilized in feature selection problems to account for the relevance among potentially effective combinations of the features as well as providing a quantitative measure of the impact of each feature on the overall prediction.17–21. Coalition-based game-theoretic methods can significantly improve the prediction accuracy compared with most existing feature selection techniques that either account only for the impact of individual features on the target labels or consider at most the pairwise correlation. In these conventional approaches, the features that have a low individual impact against the outcome but a considerable contribution when grouped with other features will most likely be filtered out that result in missing actual informative features.
In this work, we propose a novel network-based coalition game (NBCG) algorithm, where the game players are gene subnetworks extracted from the networks. In this algorithm, the game players are subnetworks that are not fixed, but rather developing identities over the game iterations by picking up new genes from the PPI network.
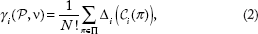
Let N be the number of players, P = {P1,…,PN} be the set of players and ν denote the characteristic function for a transferable utility coalition game (P, ν). The characteristic function, ν is a real-valued function defined on the set of all coalitions, ν: 2
P
→ ℝ. If  denotes a coalition set, P, the total payoff that can be gained by the members of coalition as defined by the characteristic function ν(). This function satisfies the two conditions as follows: (i) characteristic function of an empty coalition is zero, ν(ϕ) = 0 and (ii) if and are two disjoint coalitions, the characteristic function of their union has superadditivity property, as . The game solutions are determined with possible scenarios that the players can form coalitions and how the total payoff of a coalition is divided among the coalition members.
Marginal importance of a player , is defined as its contribution when it joins a coalition and is obtained by

This marginal importance of a player does not reflect a fair share of the player from the characteristic function, since it depends on the order of the players in forming the coalition. To define a fair solution of the coalition game (P, ν), we define the real-valued function, γ that assigns an N-tuple of real numbers, γ(ν) = (γ1(ν), γ2(ν),…,γ
N
(ν)) based on the adopted characteristic function, in which γi(ν) measures the value of player Pi. in the game with characteristic function ν. The Shapley value can then be defined as a fair unique solution of the game as it assigns a fair quantity for each player based on the average contribution of the player among all possible coalitions with all possible permutations.
22
Formally, the Shapley value of the player, Pi. ∊ P denoted by γ
i
(P, ν) is defined as the expected marginal importance of the player Pi. to the set of players who precede this player.
is the set of players preceding player Pi in the subset with permutation π.
In modeling the feature selection problem with a coalition game, the attributes (gene subnetworks extracted from the networks) are defined as the game players, and the marginal contribution of the player Pi to coalition is described as the improvement in the prediction capability of this coalition based on application-dependent evaluation method. The payoff of each coalition , measures the contribution of a coalition to the performance of the predictive model (eg, classification success rate in supervised learning). In this model, different possible coalitions of genes and pathways are examined to recognize the optimal classification features.
Since in attribute selection problem, the order of features inside a coalition does not change the coalition power, the calculations of Shapley value in (2), can be further simplified by excluding the permutation inside the already formed or to be formed coalitions in the average, resulting in the following equation:
represents the coalitions to which player Pi does not belong. Moreover, and correspond to the permutations of the preceding players and the subsequent players, respectively.

In attribute selection applications with a large number of players, computation of Shapley value for all possible feature coalitions may be computationally intensive. Therefore, we utilize the multi-perturbation Shapley value analysis (MSA), which is determined using an unbiased estimator based on Shapley value by using sampled permutations of players that form coalitions up to size N′. The idea behind this method is that coalitions of size N′ < N are capable of capturing the synergic power of players, and hence larger coalitions only present additive power. Therefore, we use

Methods
In this section, we elaborate on the proposed algorithm to find the modulated subnetwork of genes that collectively contribute to cancer phenotyping. We first note that the genes interact with one another either directly or through other cellular entities such as RNA, proteins, enzymes, and protein complexes. These complex interactions are modeled by directed graphs called pathway networks, where each pathway correspond to a biological process active in all or some specific tissue types. Two genes may be indirectly connected to each other through different biological pathways. Each gene is part of a genome that contains a unique sequence of four types of nucleobases including adenine (A), cytosine (C), guanine (G), or thymine (T) and hence encodes for a specific protein through a chain of complex protein synthesis processes including transcription, splicing, and translation. The interactions between the protein products are modeled as undirected graphs called PPI networks.
Proposed algorithm
In order to identify the subset of genes that play a role in various cancer-related subtyping (eg, success in therapy response for a specific drug), we remind the fact that the interacting genes through some biological processes are more likely to play a collective role in cancer subtyping, since all subtypes are results of an alteration in one or more biological processes. We also note that pure data-driven methods fail in identifying genes that contribute to a specific phenotype due to the well-known large p and small n paradigm, where the number of parameters (genes) is overwhelmingly higher than the number of samples. This causes high false rate, and the classical sparsity imposing methods do not perform well due to bias to the utilized dataset and measurement noise. Therefore, a key solution is to use the prior biological knowledge of the interaction among the genes. In this algorithm, we enforce the algorithm output to report the genes from multiple subsets of interacting genes as our sparsity imposing method.
In this work, we use PPI networks instead of pathway networks due to the following reasons. Some of the signaling pathways are tissue specific, and the regulatory networks may be different from one tissue to another. For instance, the estrogen-receptor signaling pathway may be particularly relevant in breast tissue, while not very active in other tissues. Second, these pathway networks differ from one source to another and are subject to constant revisions and modifications. Third, sticking to pathway networks, we may miss the interaction between different pathways through as yet undiscovered interactions. PPI networks are also much denser networks than pathway signaling networks with a higher number of connections among nodes. Therefore, using the PPI networks, it is less likely to miss any related genes in the final results even though their actual biological interacting mechanism is not yet fully discovered and hence is not present in well-curated signaling pathway networks. Furthermore, even if an actual relation among the two genes is missing in the PPI network, starting from multiple seed genes prevents losing this missed connection in the final results. The PPI network is provided as an undirected Boolean graph, where the nodes are genes (or their corresponding protein products) and the edges represent biochemical interactions between the connected nodes. 23 We use the human PPI network and represent it as a G × G binary matrix A, where G = 12126 is the number of genes.
The proposed algorithm is called Network-Based Coalition Game (NBCG) that presents a network traversal algorithm, where the directions of network browsing are determined by a coalition-based game solution. An earlier version of this algorithm is presented in Ref. 21, and the modified version of this algorithm along with two illustrative applications is provided next.
The NBCG algorithm, as depicted in Figure 1, starts from some initial nodes (seed genes) and then gradually develops links by picking up the nodes from the neighborhood of the subnetwork that present maximal contribution to the desired predictive function. At consecutive iterations, each link has the option of extending from the left or right end to form a connected link. The algorithm stops if a desired performance criterion is met or the number of nodes reaches a predefined limit. The algorithm reports a subset of connected subnetworks that are collectively enriched for an outcome of interest. In order to obtain higher enrichment properties, the algorithm runs in multiple times with different initializations, and the round with the best outcome is chosen as the final result. Moreover, we can use averaging methods to report the modulated subnetworks based on their frequency of appearance at multiple runs as will be discussed in the results section. This algorithm is general and can be applied to a wide range of applications. The following are the different blocks of the proposed algorithm for each run.

An example of developing five modulated subnetworks over a PPI network. The initialization seed genes are marked with green color. The paths may loop back to themselves or join each other to form chain, star, and loop configurations.
Initializations
To select the subset of genes that are enriched for a phenotype, we start with an initial set of L – 1 genes, from which the subnetworks emerge. The seed genes may be chosen randomly or using prior biological knowledge based on the application of interest. For instance, one may choose the genes that are most frequently mutated in the cancer being studied that derive the cancer and hence may have crucial impact on the desired cancer-related outcome. Another option would be to choose the initial genes by their individual prediction power in the adopted predictive modeling (eg, the genes with the highest association with the target labels). The drawback of both approaches is that they are data-driven methods and may have the issue of biasing to the employed dataset. Therefore, we propose to choose the initialization genes based on their degree distribution in the utilized PPI network. Using hot spot nodes in PPI network provides more flexibility in browsing the network toward a true functional subnetwork and reduces the chance of missing important subnetworks. This approach also provides higher convergence rate due to a shorter path from hub nodes to the actual modulated subnetworks.
Another reasonable choice is to choose the initial genes from a set of genes that present high association between the genomics data (eg, gene expression, somatic mutations and …) with the target phenotype based on a desired correlation matrix. This is also a reasonable choice, since the highly modulated subnetworks are expected to include significantly important individual genes. Therefore, starting from these nodes accelerates convergence to the actual modulated subnetworks. The drawback for this approach is the bias to the initial guess and reducing the chance of the discovery of subnetworks that are formed by genes that collectively, but not individually, impact the desired phenotype. It is notable that the best approach to form the pool of initialization gene set depends on the application of interest. It is also worth mentioning that regardless of the approach that we use to form the pool of initialization genes, we run the algorithm R times with different seed gene subsets that are randomly chosen from the pool of initialization genes. Therefore, the chance of missing the actual modulated subnetworks is very low. Once the initial genes are chosen, each of them is considered as a subnetwork with only one node to be developed to a higher subnetwork as follows.
Subnetwork expansion
Each internal iteration of algorithm consists of two steps, namely, network expansion and contraction. If Si. = {G i1 , Gi2,…, G i|Si| }, i ∊ {1, 2,…, L} is the set of |Si| genes forming subnetwork Si, then at network expansion step, we add a node to each already developed subnetwork Si. such that the resulting new network results in a better game-theoretic evaluation. Obviously, at the first iteration, each subnetwork consists of a single seed gene (ie, |Si| = 1, i ∊ {1, 2,…,L}) from which a subnetwork emerges.
First, we form a candidate gene set for each subnetwork. If Si. = {Gi1,Gi2,…,Gi|Si|} is the set of |Si| genes forming subnetwork S i , then the inclusion candidate gene set ω i for subnetwork Si is defined as the set of genes in the direct neighborhood of the subnetwork or equivalently the nodes with direct links to any of the subnetwork nodes in the PPI network, ie, ω i = {G ik : Gij ∊ Si, A(Gij,Gik) = 1} for all k ∊ {1,2,…,G} and S i
Then, we run a coalition game for the players including the current subnetworks Si, i. ∊{1,2,…,L}. and the set of the candidate genes. For each subnetwork Si,. we calculate Shapley value for each candidate gene Gik ∊ Si. by forming a coalition game with player set P = {S1,S2,…,SN,Gik}, where |P| = L +1. The Shapley value for the candidate gene quantifies the expected marginal importance of the candidate gene when forming coalitions with different combinations of the current subnetworks as elaborated in the “Methods” section. Evaluation of the characteristic function for each coalition depends on the desired objective based on the application as described in the “Conclusions” section for two proposed applications. The candidate gene with the maximum Shapley value,
Note on computation complexity
It is noteworthy that in contrast to conventional games, game players are not static entities and rather they are developing entities over the con-secutives iterations of the coalition game. This implementation significantly reduces the complexity of the game with respect to the conventional method of considering each individual gene as a game player.
We note that the computational complexity of the algorithm is exponentially proportional to the number of players. Since we repeat the game for each candidate gene, the complexity of the proposed game is O(|Ω1 ∪…∪Ω L | × 21+L). If we use MSA method with maximum coalition size L' < 1 + L, then complexity reduces to O(|Ω1 ∪…∪Ω L | × 2 L' ). Therefore, the complexity of the game exponentially grows with the number of subnetworks and hence does not increase by the game evolution. This complexity is much less than the conventional method of treating each gene as a game player that provides the complexity of O(2|Ω1 ∪ΩL|+|S1∪…∪…∪SL|), which grows exponentially with the number of genes forming the subnetworks and hence increases over the consecutive iterations.
Subnetwork contraction
In the early version of this algorithm that is presented in Ref. 21, each iteration of the algorithm includes only a network expansion step. One drawback of this approach is that each subnetwork evolves from a randomly selected seed gene and expands toward a modulated subnetwork. Therefore, the subnetworks always include the seed genes and in order to find the best modulated subnetwork, we need to start from a large number of sets of different initialization genes in order to determine the best set of modulated subnetworks enriched for a desired outcome. In this modified version, we include an additional step of network contraction by removing the nodes whose contribution to the desired outcome in terms of the Shapley value is below a predefined limit. Therefore, the subnetworks have the flexibility of moving away from the seed genes along the PPI network to the modulated subnetworks. This is due to the fact that the contribution of each gene to the desired outcome may change as the subnetworks evolve over time.
In order to identify the genes with low (or negative) Shapley values, we first define a set of exclusion candidate genes ψi for each subnetwork Si The algorithm chooses the subnetwork edges including the nodes that are connected only to one node in the developed subnetwork; hence, their removal does not break down the subnetwork into two disjoint subnetworks. For instance, if θj = {GK: GK ∊ Si, A(GK,Gij) = 1} is the set of neighbor nodes for gene Gij ∊ Si, then Gij ∊ ψ t if and only if we have |θj ∩ Si| = 1.
To evaluate each candidate gene Gik, we exclude it from the corresponding subnetwork and then run a coalition game for the set of players including the current subnetworks and the candidate genes of interest, ie, P = {S1, S2,…,Si \Gik,…,SNL Gik}, where |P| = L + 1. The Shapley value for the candidate gene Gik quantifies the expected marginal importance of the candidate gene in coalition with different combinations of the current subnetworks. The gene with the minimal Shapley value
Repeating this game for all removal candidate genes for all subnetworks provides the resulting subnetworks at the end of the current iteration.
Subnetwork evaluation and termination criteria check
At each algorithm iteration, the game-based expansion and contraction steps provide a set of at most L subnetworks. As mentioned earlier, subnetworks are allowed to join each other and form a new larger subnetwork. At the end of each iteration, the performance of the obtained subnetworks denoted by Acc(t) is evaluated based on the appropriate performance metric for the application of interest, ie,
If the termination flags for all of the subnetworks are set either due to lack of an informative node in their neighborhood (ie,
If the number of total collected genes exceeds a predefined value (ie,
If the number of iterations reach its maximum value NT(ie, t ≥ NT).
If all subnetworks remain unchanged during the current iteration and no gene is added or removed from a subnetwork (ie,
If the desired performance at the end of the iteration t denoted by Acc(t) based on the collected genes forming the developed subnetworks reaches a predefined desired value (ie, Acc(t) ≥ Accmax).
We note that the last two conditions are the most important conditions controlling the performance of the algorithm by timely terminations. Other termination criteria are defined to avoid nontermination of the algorithm when it does not converge to a meaningful set of subnetworks, and thus, these conditions should be chosen loose enough to avoid early terminations.
If the termination criterion is satisfied, the algorithm terminates and the subnetworks along with the obtained performance are reported. Otherwise, the next iteration is executed.
As mentioned earlier, since the algorithm starts with randomly chosen seed genes, the algorithm is executed multiple times (denoted by R) and the resulting subnetworks for the algorithm execution that yield the best performance are reported. The summary of each run of the algorithm is presented in Figure 2.
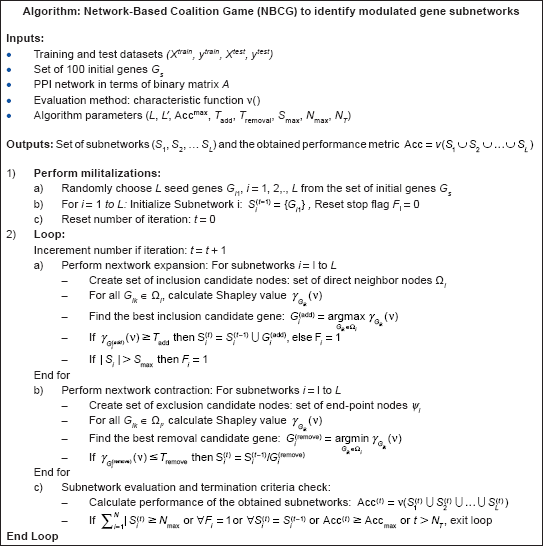
NBCG algorithm to identify modulated gene subnetworks using PPI networks.
Results
In this section, the proposed algorithm is utilized to solve two important cancer-related problems including (i) identification of gene subnetworks whose expressions mediate platinum-based therapy response in ovarian cancer and (ii) identification of gene subnetworks whose somatic disorders significantly impact immune system scores in breast cancer. The main difference between utilizing the proposed algorithm for the two applications is coalition evaluation method based on the characteristic of training dataset. There are also some other minor differences that will be elaborated by detailing utilization of the proposed NBCG algorithm for both applications in the following sections.
Therapy response prediction in ovarian cancer
In this application, we are interested in finding a subset of biologically relevant gene sets that significantly impact therapy response in ovarian cancer. Ovarian cancer is an extremely aggressive disease with poor overall outcomes due to late diagnosis and lack of targeted therapies.
4
Furthermore, a majority of ovarian cancer patients progress or suffer cancer recurrence within five years of frontline platinum-based therapy. Identification of gene subnetworks associated with resistance to platinum-based therapy resistance24,25 would enable the discovery of functional biomarkers and novel therapeutic targets in this aggressive disease. Accordingly, we here apply our algorithm to identify gene subnetworks within the human PPI network whose joint expression levels are associated with recurrence-free survival on platinum-based therapy in ovarian cancer. The molecular data are obtained from TCGA dataset
26
and include 201 cancer samples with their gene expression levels and clinical responses. The clinical response data include survival information (death or cancer progression) after platinum-based chemotherapy. We first divide the samples into two cohorts of poor and good survival rates. The poor survival cohort includes samples with events during the first six months of receiving platinum therapy, excluding patients who left the study (censored samples). Patients who survive at least six months without cancer progression are included in the good survival cohort. Therefore, therapy response classes are represented by a binary vector
The dataset
We use the top-100 genes with the highest degree in the PPI network (hot spot nodes) as initialization gene pool. We only use network expansion step in the implementations for this application. The rest of the game parameters are set as follows:
The number of subnetworks are set to L = 5, which results in N = L + 1 = 6 players, including the candidate gene, maximum group size N' = 3, maximum number of collected genes at each subnetwork Smax = 20, maximum number of total collected genes Nmax = 100, and maximum number of internal iterations NT = 100. The threshold on the Shapley value for including a new gene into the subnetwork is Tadd = 0 meaning that the gene with the maximal Shapley value is accepted if it improves the classification accuracy (in average) when it joins the previously formed coalitions. The desired classification rate to stop the algorithm is set to Accmax = 0.98. Large value of Accmax reduces false report rate by sticking to the algorithm runs that provide very impactful subset of gene subnetworks.
The algorithm runs for R = 100 rounds using randomly selected genes among the initialization gene pool. We first rank the genes based on their degree in the PPI network and select the top-100 genes as the initialization pool, and then we randomly draw a subset of four genes for each algorithm execution. At each round of execution, the algorithm reports a collection of subnetworks that are highly associated with the survival outcomes. The proposed solution can be integrated with any binary classification method. In this work, we arbitrarily use the support vector machine (SVM) classification with radial basis function (RBF) kernel. However, the obtained results are not sensitive to the choice of classifier, and the numerical results show negligible change when using other classifiers (such as Random Forest, Naive Bayes, Bayes Net, and K-Nearest Neighbors [KNNJ).
We compare the results with the same number of genes obtained using two benchmark solution categories. We apply state-of-the-art feature selection methods including correlation-based subset evaluation correlation based feature selection (CFS),chi-square test-based subset evaluation (chi-square),and mutual information-based subset evaluation method (gain ratio). Additionally, two representative wrapper methods including best first search method with Naive Bayes and ranker method with SVM classifier were also applied. These methods report the most informative genes that may or may not belong to the connected subnetworks. We also compare the proposed method with a network-based traversal method, where the subnetworks are initiated from the same initial gene seeds as in our proposed method. Instead of using the Shapely value, genes from the connected subnetwork in proximity of the seed genes are selected using a random walk until it collects the same number of genes as the proposed method. This whole procedure is repeated for R = 100 times, and the set of gene subnetworks, which provides the best prediction accuracy, is selected for comparison with the proposed methodology.
In order to compare the relevance of the obtained gene sets across methods, in addition to the classification accuracy based on phenotype survival rates, we also compare the discriminative power of the gene sets in terms of continuous-valued survival probabilities. Therefore, patients are clustered using K-means clustering based on the gene expression data for the selected genes reported by the different methods. Then, we estimate the survival probability for each cluster using the standard method of Kaplan-Meier estimation followed by survival difference estimation using the log-rank test method that provides the probability of obtaining such a difference purely by chance (P-value). The results of these comparisons are provided in Table 1 and Figure 3.
Comparison of genes selected using the proposed method and other state-of-the-art feature selection methods based on its prediction accuracy and survival outcome separation.


(A) Sample subnetworks reported by the proposed algorithm. Start genes are marked dark. The numbers show the sequence of subnetwork forming in consecutive algorithm iterations. (B) platinum-free survival,P-value = 4 × 10⁻⁵.
Table 1 compares the proposed solution with the aforementioned methods. For competitor methods, where the sorted list of genes are provided based on various correlation or information-based measures, we choose the same number of the top genes that are reported by our method, which is 18. We note that 18 is not a predefined value, but rather it is the number of genes that is reported by the algorithm, when it meets the stop criterion that is a set of rules based on various parameters as detailed in the “Subnetwork evaluation and termination criteria check” section. It is seen that the proposed method outperforms the other competitor methods. The main cause is that the proposed coalition-based solution considers the collective power of gene sets based on Shapley value concept. This is particularly interesting since the competitor methods are not restricted to choose the genes from the connected subnetworks. The proposed solution provides more insightful and clinically relevant gene subnetworks.
The set of subnetworks identified by our proposed algorithm for L = 5 is depicted in Figure 3A. Subnetworks 1, 2, and 4 correspond to (i) vascular endothelial regulation, (ii) TGF-beta signaling, and (iii) cell cycle progression and apoptosis pathways, respectively. These pathways belong to well-known hallmarks of cancer, thus suggesting that our proposed methodology is able to identify potentially functional pathways mediating therapy resistance. The subnetwork 5 joins subnetwork 4 at iteration 3 and subnetwork 3 stops extending at iteration 3, since no new informative neighbor genes were available. Indeed, while the TGF-beta signaling has previously been implicated as playing an oncogenic role in epithelial cancers, its role in mediating platinum resistance has not been widely explored. In addition, subnetwork 3, which includes the gene TXNDC9, is also a novel finding in this disease context. Notably, while the exact function of TXNDC9 is as yet unknown, it is likely involved in cell differentiation and has been shown to be associated with increased risk of progression in colon cancer. 27 Thus, our findings using the NBCG algorithm showing TXNDC9 being associated with platinum resistance in ovarian cancer makes it further likely that this gene could be a potential therapeutic target across disease contexts. Therefore, these results reveal the ability of NBCG to identify novel mechanisms and likely therapeutic targets across cancers.
Figure 3B presents the survival curves for patients clustered into two groups using K-means clustering based on the expression level of the genes obtained from the proposed game-theoretic method (Fig. 3A). The result demonstrates that the proposed solution can identify gene subnetworks with higher survival discriminatory power as compared with the estimates from the best feature selection method (in this case, CFS; Fig. 4A) and the optimal network-based random walk solution (Fig. 4B).

Survival probability obtained by Kaplan-Meier estimate for the cancer samples clustered using the genes that are selected by (A) best classification method (CFS),P-value = 0.018 and (B) optimal network-based random walk method,P-value = 0.08.
Impact of somatic aberrations on immune system scores in TNBC
Multiple studies have demonstrated that evaluating the extent of tumor-infiltrating lymphocytes within triple-negative breast tumors can provide significant prognostic information28–31. in this highly aggressive subtype of breast cancer. Indeed, we 32 and others33–35. have shown that gene expression-based immune signatures can provide both information on prognosis and response to therapy in specific subsets of breast cancers. However, it is as yet unclear why certain subsets of TNBCs exhibit high levels of immune surveillance, while others escape it. Evidence in colon cancer suggests that genomic aberrations such as microsatellite instability are likely to contribute to increased immune surveillance, 36 thus potentiating the use of novel immune therapies37,38 in this cancer subtype. Therefore, we hypothesize that genomic aberrations affecting key pathways involved in maintaining genomic fidelity are more likely associated with high lymphocytic infiltration in TNBC. Accordingly, we here apply our algorithm to identify mutated gene subnetworks that are associated with differential immune infiltration in TNBC.
We leveraged gene expression data from the TCGA and estimated the level of immune infiltration in the tumor samples using a previously published algorithm, ESTIMATE, 39 that is based on the expression levels of a 140-gene immune signature. Briefly, a single-sample gene set enrichment methodology was used to derive the index of immune activity (immune index) by comparing the expression levels of the 140 signature genes against the background expression of all genes on the array. 39 The immune index values for all the samples in this study were estimated using the R-package associated with the published algorithm. Somatic mutations were determined using whole-exome sequencing data, while somatic copy-number alterations were obtained using SNP arrays. Subsequently, we applied our algorithm to identify gene subnetworks whose mutations or copy-number alterations were significantly associated with high immune indexes.
Accordingly, we first obtained gene-level somatic copy-number alterations by mapping the sCNA loci on to genes, with log-ratios > 0.1 being considered as amplification events, while log-ratios < –0.1 being considered as deletion events. Both amplification and deletion events mapped to a copy-number alteration event represented by “1” in the corresponding binary matrix. Similarly, we incorporated gene-level mutation information, with a gene considered mutated if it harbors either missense, nonsense single-nucleotide changes, insertion/deletions, and frameshift indels. Silent mutations were excluded for the purposes of this analysis.
Therefore, both mutation and sCNA data are ns × nGbinary matrices denoted by X[ns xnG] where nS is the number of samples and nG is the number of genes satisfying two conditions as follows: (i) profiling information is available and (ii) they are included in the employed PPI network. We tried three different scenarios by incorporating mutation data only, copy-number alteration data only, and the combination of both. In the later scenario, “1” in the binary data matrix refers to copy-number alteration event, a mutation event, or both. The data matrix includes binary information for nG = 9976 genes and nS = 109 TNBC samples. The TNBCs were identified using immunohistochemistry data available from the TCGA for the tumor samples.40,41
The immune scores are incorporated as a nS × nG column vector of continuous-valued immune score denoted by 
In order to evaluate the separation between the two clusters in terms of immune scores y, we use Fisher index:

For each scenario, we execute the algorithm for R = 1000 rounds using randomly chosen seed genes from the pool of top 100 genes based on their degrees in the PPI network. We also tried other initialization methods including top-100 most frequently mutated genes in BRCA and top-100 highly correlated genes whose individual mutations divide the samples between the two cohorts with the highest Fisher index for their immune scores. The numerical results suggest that due to the flexibility and mobility of the formed subnetworks by the algorithm, which is provided by network expansion and contraction steps, the results are not sensitive to the choice of initialization method and perform almost equally. However, the proposed method provides the desired performance with lower number of genes due to the existence of shorter paths from randomly selected seed genes to the modulated subnetworks.
The rest of the game-theoretic algorithm parameters are set to: maximum number of subnetworks L = 4 resulting in N = 5 players including the candidate gene, maximum number of players in a coalition N' = 4, maximum number of total collected genes Nmax = 100, maximum number of collected genes in each subnetwork Smax = 50, and maximum number of internal iterations NT = 100. The browsing parameters such as minimum improvement that controls adding a node to a subnetwork Tadd, minimum performance degradation by removing a node from a subnetwork Tremoval, and desired performance Accmax that controls the network browsing, and stop criterion can be defined in terms of the distance between the resulting cohort centers
Convergence analysis
In order to evaluate the robustness of the proposed method, we study the consistency of results when initialized with different seed genes. In our case, the initialization gene pool includes 100 genes, where at each run we choose L = 4 seed genes to develop L subnetworks. The total number of different seed genes is
Each round of the proposed NBCG algorithm provides up to L(r) ≤ L modulated subnetwork with the resulting gene set  with a total of
  genes. Therefore, the total number of genes reported by the algorithm at R rounds is limited to:

Since the ground truth is not known for this application, we first rank the set of reported genes based on their frequency of appearance in multiple rounds of the algorithms and then consider the top-k most frequently reported genes
For each round of algorithm, nk(r) denotes the number of reported genes that are in top-k genes, ie,  . These genes are considered consistent. The rest of N – nk(r) genes are considered false reports, which are inconsistent with the average results obtained by multiple rounds of the algorithm. This is depicted in Figure 5. For instance, the round r = 3 corresponds to an algorithm round with poor consistency.
Each round of algorithm provides up to L subnetworks and a total set of genes shown by with cardinality . The resulting gene set includes genes that belong to the top-k gene set and considered consistent.
The consistency score of round r denoted by ck(r) is defined as the rate of the reported genes that belong to  :
:
The average of ck(r) over all R algorithm rounds (ie,  . The frequency of appearance of top k genes in multiple runs of the proposed algorithm is shown in Figure 6B, which depicts the frequency of appearance for any of the top 100 genes. For instance, the first top genes appear at about 50% of the rounds of algorithm (approximately 500 of 1000). Also, the top-20 genes appear in about 20% of the algorithm runs. Therefore, using only five rounds of the proposed algorithm with different initialization ensures capturing of the top-20 genes with a high probability. The consistency results in Figure 6A and B are valid for the three different scenarios using sCNA, Mut, and combined data types.

(A) Average consistency scores of the proposed algorithm using different data types. (B) Frequency of appearance of top-k genes in multiple runs of the algorithm.
Association between mutated subnetworks and immune scores
Figure 7 represents the obtained results for the mutation data. Each execution of algorithm provides top modulated subnetworks along with the resulting Fisher index for immune score between two cohorts, with and without modulated subnetworks. Then, we report the modulated subnetworks for the algorithm round that provides the highest Fisher index.
Developed gene subnetworks using the NBCG algorithm including genes, when mutated, are associated with increased immune cell infiltration within tumors. The network starts with four randomly selected hot spot genes including UBC, SMAD1, MEPCE, and TP53 and develop four subnetworks that ultimately join each other and form the following connected subnetworks. The size of the nodes represents the frequency of their appearance in the reported list for multiple algorithm execution (eg, MDM2 is the most frequently reported gene by different algorithm executions). The intensity of node colors refer to their individual associations with the immune scores in terms of Fisher index between the immune scores of two cohorts with and without mutations in this specific gene (eg, the gene LPHN1 demonstrates a highest association with immune scores).
Given the evidence for convergence of the proposed algorithm, we evaluated the biological significance of the identified subnetworks. We specifically focused on identifying gene subnetworks harboring somatic mutations that are associated with high immune infiltration (Fig. 7), given the clinical significance of high immune infiltration in TNBCs. As shown in Figure 7, we identified a densely connected subnetwork of genes that jointly exhibited a very strong association with high immune index (Fisher's index = 3.25), with TNBC samples harboring mutations in these genes exhibiting significantly higher immune index (differential immune index = 4948), as compared with the rest of the cohort. We performed pathway enrichment analysis on this gene set using the National Cancer Institute's Pathway Interaction Database, 42 a curated collection of known biomolecular interactions and key signaling pathways associated with cancer, to evaluate if genes belonging to a specific cancer-related pathways were enriched within the subnetwork, followed by assessment of FDR using the Benjamini–Hochberg FDR 43 methodology. Our analysis revealed significant enrichment of ATR signaling (P << 10−3; FDR << 10−2) and p53 pathways (P << 10−3; FDR << 10−2), pointing to the likelihood that TNBC tumors deficient in DNA damage repair mechanisms are more likely to trigger enhanced immune surveillance. Indeed, mutations in MDM2, CHEK2, and BRCA2, all of whom are key players in DNA damage repair were frequently identified as significantly associated with differential immune index (Fig. 7) by our algorithm. These findings strongly suggest that immune surveillance in TNBC tumors is associated with disruptions in DNA repair pathways, a finding consistent with previous reports of increased immune cell infiltrates in high-grade serous ovarian cancers harboring BRCA1 or BRCA2 mutations. 44
However, the immunogenic role of these pathways in TNBC has not been previously reported. Additionally, the NBCG algorithm also identified aberrations in AKT1 and PTEN, both of which belong to the oncogenic PI3K/AKT pathway to be associated with increased immune infiltration (Fig. 6). Taken together, these novel findings, if confirmed in additional studies, would enable the identification of tumor-specific neoantigens, while also identifying targets for vaccines and adoptive immune cell therapies. Furthermore, given that multiple trials are ongoing to evaluate the benefit of PD-L1/PD-1 blockade in TNBC, our findings could be leveraged to identify a mutational signature of benefit from immune checkpoint inhibitor therapies.
Furthermore, given that multiple trials are ongoing to evaluate the benefit of PD-L1/PD-1 blockade in TNBC, our findings, if validated, could be leveraged to identify a mutational signature of benefit from immune checkpoint inhibitor therapies.
Conclusions
A novel coalition-based game-theoretic algorithm is developed using PPI networks to identify gene subnetworks that are associated with clinical or biological phenotypes. This algorithm implements a novel subnetwork selection mechanism by utilizing two network expansion and contraction steps. The proposed NBCG algorithm initiates subnetworks from randomly selected or predefined seed nodes and expands the subnetworks by collecting nodes from their neighborhoods based on the concept of Shapley value, where the subnetworks and the candidate genes are the players of the developed coalition game. This approach considers the collective power of the subnetworks using Shapley value based on an application-independent characteristic function. To avoid the bias to seed nodes, an additional step of network contraction is developed by which the subnetworks remove uninformative nodes and thereby are capable of moving away from the seed nodes toward more informative network sections, in case the originally selected seed nodes are not significantly useful. This algorithm is general in the sense that it is capable of identifying subnetworks of connected nodes that maximizes a desired objective based on the collective power of the set of selected network nodes.
The proposed NBCG algorithm is utilized to find subnetworks of genes whose profiling information is associated with a desired clinical outcome or a biological mechanism. As an illustrative example, we employed this algorithm to determine gene subnetworks whose expression levels are associated with progression-free survival in patients with ovarian cancer treated with platinum-based chemotherapy. Additionally, we employed the NBCG algorithm to identify gene networks harboring genomic aberrations that are associated with and immune cell infiltration in TNBCs. The proposed method improves upon the state-of-the-art feature selection methods in identifying the most informative gene sets with the added advantage of using PPI networks to identify functionally related gene sets that jointly discriminate between phenotypes. Additionally, this approach takes into account the collective power of subnetworks using the concept of Shapley value, as opposed to techniques that grow each subnetwork individually.
The aforementioned illustrative applications confirm the utility of the NBCG algorithm in identifying subnetworks of functionally related genes and proteins that are associated with cancer phenotypes, thus enabling the discovery of novel biomarkers and therapeutic targets in cancer.
Author Contributions
Conceived and designed the experiments: AR, FA, VV. Analyzed the data: AR, SS, VV. Wrote the first draft of the manuscript: AR. Contributed to the writing of the manuscript: AR, FA, VV. Agree with manuscript results and conclusions: AR, FA, SS, VV. Jointly developed the structure and arguments for the paper: AR, VV. Made critical revisions and approved final version: AR, VV. All authors reviewed and approved of the final manuscript.