
Abstract
The ability to find highly related clinical concepts is essential for many applications such as for hypothesis generation, query expansion for medical literature search, search results filtering, ICD-10 code filtering and many other applications. While manually constructed medical terminologies such as SNOMED CT can surface certain related concepts, these terminologies are inadequate as they depend on expertise of several subject matter experts making the terminology curation process open to geographic and language bias. In addition, these terminologies also provide no quantifiable evidence on how related the concepts are. In this work, we explore an unsupervised graphical approach to mine related concepts by leveraging the volume within large amounts of clinical notes. Our evaluation shows that we are able to use a data driven approach to discovering highly related concepts for various search terms including medications, symptoms and diseases.
Introduction
Related clinical concepts are two or more terms or phrases that are highly associated and related. For example, the term “nausea” is highly related to “vomiting” and the term “pregnancy” is highly related to “ectopic”. Such related concepts are extremely important to health-care-related applications. One important use case of
Most health-care applications today rely primarily on existing “static” terminologies curated by human experts such as SNOMED CT, LOINC, and RxNorm. While these controlled terminologies are extremely useful, they are highly dependent on human expertise, which leads to several issues. First, since these terminologies were hand curated by several subject matter experts from a specific geographic area, the actual terminologies used in practice can vary significantly from institution to institution let alone country to country. Thus, it does not account for locality of information. Another issue is that even though related concepts can be anything from symptoms to medications to procedures, each of these controlled terminologies will only show relationships explicitly defined by the expert based on his or her knowledge (eg, clinical findings with certain procedures only) and most likely would not be able to show concepts that can only be clinically observed. For example, a lookup on
In this study, we thus explore a highly scalable graph-based approach to establish relationships between a
One key advantage of our approach is that it is very general in that users would have complete control on the data used for constructing the Concept-Graph to find related concepts. For example, a user can construct a Concept-Graph using only cancer treatment related notes. A user may also choose to use all notes within the organization to construct a comprehensive Concept-Graph. Since the Concept-Graph also provides evidence information, one can directly obtain various statistical information from the graph to be used within an application. The resources used as part of this work can be found at https://github.com/rxnlp/clinical-concepts.
Methods
The goal of this work is to find a list of
In the following subsection, we first describe how the Concept-Graph is constructed using large amounts of clinical notes and the preprocessing involved in constructing the graph. Then, in “Discovering related concepts” section, we describe how the graph is used to find
Concept-Graph construction
The first step prior to building the Concept-Graph is to preprocess the clinical notes as they are fed into the Concept-Graph. We perform minimal preprocessing on the notes that include sentencing, lowercasing, and stop word removal. Each sentence in a clinical note is considered independent of one another. Sentences can be easily obtained from the clinical notes using existing sentence segmentation tools.2,3 In our case, we developed a simple sentence segmenter using punctuation as heuristics. We also remove stop words from each sentence. Stop words are common words in the language that appear both in day to day language as well as very commonly in clinical notes. We appended the English stop words used within the Terrier Package 4 with some manually curated clinical stop words. The list of stop words used is published in https://github.com/rxnlp/clinical-concepts. While some of the common clinical note terms would naturally have a low rank using our system, these terms are distracting and yield unnecessary memory overhead and thus we dropped some of these words (eg, patient, clinic, and hospital). The preprocessing steps used in our work are graphically demonstrated in Figure 1.
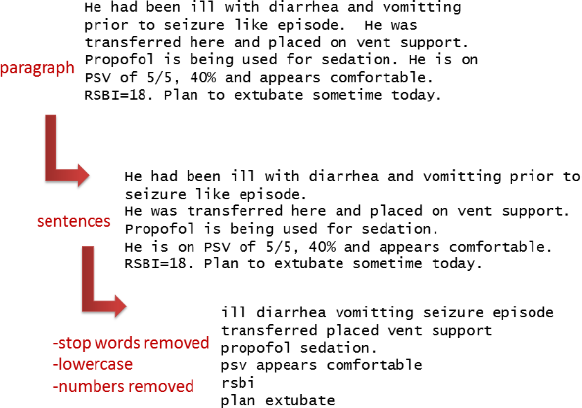
Preprocessing steps applied to clinical notes.
Once preprocessing is complete, the Concept-Graph is constructed. The Concept-Graph is essentially an undirected positional word graph data structure that represents large amounts of natural language text in a compressed and easy to analyze format. It naturally models co-occurrence relationships between words, as each unique word is a node in the graph and the edges represent the relationship between words as it appears within sentences. This provides cues on which two concepts are related just by leveraging the links based on the original text. Each preprocessed sentence from the clinical notes is fed into the Concept-Graph data structure where each unique word becomes a node in the graph and each node holds the sentence identifier (SID) as well as position of the word in the sentence (PID). For example, if a word “asthma” appears 10,000 times in the text, there will only be a single node to represent asthma. The node representing asthma keeps track of which sentences used that particular word along with the corresponding positional information. An edge A-B is used to indicate that word “A” appeared at least once next to word “B” and the direction of the edge does not matter. Figure 2 shows an example of a Concept-Graph constructed with three preprocessed sentences from some clinical text. Notice that just based on this simple example, a strong link can already be seen for example between “vomiting” and “diarrhea”.
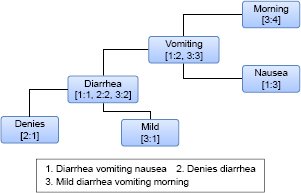
Example of concept-Graph constructed using three sentences that have been preprocessed. each node represents a unique word in the text. Each node stores the sentence identifier (SID) and the position of the word in the sentence (PID).
In constructing the Concept-Graph for this work, we utilized 10,000 clinical notes that were randomly picked from the MIMIC II Clinical Database. 1 The MIMIC II Clinical Database contains comprehensive clinical data from intensive care unit (ICU) patients. These data were collected between 2001 and 2008 from different ICUs (medical, surgical, coronary care, and neonatal) in a single hospital. Thus, the query concept can be fairly general as the MIMIC II Database covers a range of treatments and conditions. We used all 10,000 notes to construct the Concept-Graph using the steps mentioned above.
Discovering related concepts
Once the Concept-Graph has been constructed, the next step is to find the related concepts for a given query. For this, the query terms would first have to be identified in the Concept-Graph. If the query terms (eg, “chest” and “pain”) are themselves linked (there is an edge linking the terms), then all concepts that are linked to the query terms will first be identified. Based on Figure 2, for the query vomiting, linked concepts would include “morning”, “nausea”, and “diarrhea”. We will refer to these as
Specifically, if a query term, SQ, and a candidate concept, CC

An overlap example, where vomiting is the query and nausea is the candidate concept. The format used is SID:PID where SID is the sentence identifier and PID is the position of the word in the sentence.
The intuition for the σwindow restriction is that words that appear much further away are less likely to be related to the query term than words that are much closer in general to the search term. Formally, the overlap between a search query, SQ, and a candidate concept, CC
Computing relatedness scores for ranking related concepts
While a query term may be linked with thousands of related concepts, there are some concepts that are more related than others. For example, for the query vomiting, intuitively we know that the term nausea is more strongly related to vomiting than the word morning. The term morning most likely appears in the context of morning sickness where a patient experiences vomiting. Another example is for the query asthma where the medication “QVAR” is more related to asthma than the word medication itself. Thus, to distinguish concepts that are highly related from ones that are marginally related, we introduce a ranking system that ranks relationships based on a 


The first part of Equation 3,
Once Relatedness(SQ, RC
Evaluation
The goal of our evaluation is to understand if the top related concepts discovered by our system are in fact related and relevant to the search query. For example, is “vomiting” related to “nausea”? To perform our evaluation, we first requested a physician to provide 10 search queries that he/she may want to search for to find related concepts. The topics we received were: lithium (medication), beta-blocker (medication), penicillin (antibiotic medication), advair (inhaler for asthma treatment), chest pain, pregnancy, myocardial infarction, bloody stool, fracture, and syncope.
Ground truth
We then used our system to generate the top 50 related concepts for these 10 topics using the two relatedness measures described in “Methods” section. We then presented the results to five independent physicians to rate our results. We asked these five physicians to rate the results based on the two rankings (PMI and PROB) as follows:
Given the ratings from the five physicians, we used majority vote as the final rating. This means that if a related concept has been rated as
Evaluation metric
To evaluate the overall performance of our system, we introduce two measures, one being precision and the other we refer to as a utility score. Precision evaluates how many of the top 50 concepts are relevant (ie, not noise). Utility score on the other hand assigns a score for each type of concept produced. Specifically, a score of 2 is assigned if the system found a relevant concept (R), a score of 1.5 if the system produced a relevant but general concept (RG), and a score of –2 if the system produces noise. With this, the more noise the system produces, the more it gets penalized and the more relevant concepts the system produces the better the overall score. Given top 
Results
Precision of results
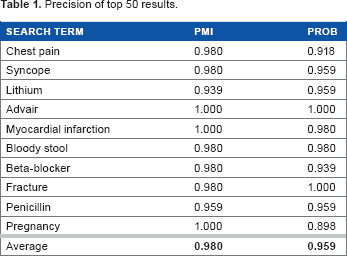
We first look into precision of our results to understand how many nonrelevant concepts are produced by the system. Table 1 shows a summary of precision based on our ground truth. Notice that with both rankings, the amount of noise produced is extremely low with above 95% of the results being either R or RG. In fact, the PMI-based ranking has an average precision of 98%. This indicates that all in all, the system finds concepts that are related to the search query. Also notice that in general, the overall precision of the PMI-based ranking is slightly higher than that of the PROB-based ranking. This shows that overall, PROB-based ranking introduces more noise than PMI.
Precision of top 50 results.
Utility of results
The utility of results indicate how usable the top related concepts are in practice. The less relevant the top concepts, the lower the utility score at different rank cutoffs. Based on Table 2, we can see that overall the PMI-based ranking provides a higher utility compared with the PROB-based ranking. This is because the PMI-based ranking immediately returns concepts that are considered
Utility scores at different rank cutoffs.

Sample results
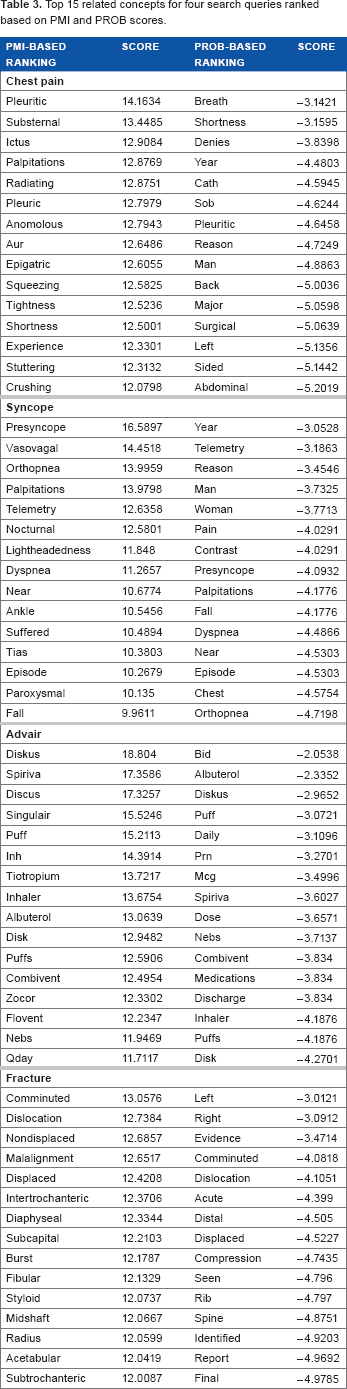
Table 3 shows a snapshot of the top related concepts for four different search queries based on PROB-based ranking and PMI-based ranking. Notice that with the PMI-based rankings, the top related concepts are very specific to the search query. With the PROB-based ranking, the top concepts are more general and the top PMI concepts start appearing in the later ranks of PROB-based ranking. This is interesting because it produces two use cases for applications. For example, some applications may value related concepts that are more general in which case the PROB-based ranking would be more suitable. Some other applications may value concepts that are very clinically related, and in that case, the PMI-based ranking would be ideal.
Top 15 related concepts for four search queries ranked based on PMI and PROB scores.
Example Usage in Practice
The concept-graph can be used in a variety of settings once it has been constructed. For example, in medical literature search, the query terms used by the user can be expanded with related concepts to improve the search results. In more specific terms, if the user is interested in literature related to asthma, related concepts such as “advair”, “shortness”, and “breath” could help bring up literature that is more relevant. Another example is in the case of ICD-10 code set filtering. If a particular ICD-10 code (ie, the description of the code after stop word removal) matches none of the top
Conclusion
In this work, we proposed a method to mine related clinical concepts by leveraging the volume within large amounts of clinical notes along with a graph data structure. Our evaluation shows that our system is able to return highly relevant concepts with above 95% precision and our best method achieves an average utility score of 0.90. This shows that the related concepts generated by our system can be immediately used for a variety of tasks, including query expansion, hypothesis generation, incident investigation, sentence completion, and ICD-10 code set filtering.
Our system is not only lightweight wherein it relies on limited linguistics resources but also very general in that the same method can be applied to different types of big clinical data. The only requirement for our method to work is to have
While this work was evaluated using the MIMIC II Database that is a fairly general dataset, we would like to explore its use in a more narrow situation to understand its applicability in a clinical setting. We would like to work with a physician in actually using our system to investigate certain surprising relationships that could help in their future clinical investigation.
Author Contributions
Conceived and designed the experiments: KG, SL and VS. Analyzed the data: KG, SL and VS. Wrote the first draft of the manuscript: KG, SL and VS. Contributed to the writing of the manuscript: KG, SL and VS. Agree with manuscript results and conclusions: KG, SL and VS. Jointly developed the structure and arguments for the paper: KG, SL and VS. Made critical revisions and approved final version: KG, SL and VS. All authors reviewed and approved of the final manuscript.