
Abstract
The convolution of the transmembrane current of an excitable cell and a weighting function generates a single fiber action potential (SFAP) model by using the volume conductor theory. Here, we propose an empirical muscle IAP model with multiple Erlang probability density functions (PDFs) based on a modified Newton method. In addition, we generate SFAPs based on our IAP model and referent sources, and use the peak-to-peak ratios (PPRs) of SFAPs for model verification. Through this verification, we find that the relation between an IAP profile and the PPR of its SFAP is consistent with some previous studies, and our IAP model shows close profiles to the referent sources. Moreover, we simulate and discuss some possible ionic activities by using the Erlang PDFs in our IAP model, which might present the underlying activities of ions or their channels during an IAP.
Keywords
Introduction
According to the volume conductor theory, a single fiber action potential (SFAP) is modeled by the convolution of the transmembrane current of an excitable cell and a weighting function, which represents the distance between the excitable cell and an electrode for measurement.1–3,5,6 Since an intracellular action potential (IAP) can be easily measured, the mathematical relationship between the transmembrane current and a muscle fiber IAP has been established based on the core conductor theory.5,7,8 Therefore, a muscle fiber IAP is used as a fundamental bioelectric source to model a single fiber action potential (SFAP). As many studies have emphasized, the selection of a precise IAP model is the most critical process in modeling a SFAP because the IAP profile directly affects its SFAP.1,6,12 For a realistic muscle IAP, various IAP models have been developed based on simple pattern adjustment, 2 its modification 5 or the combination of multiple functions.13–15 Simplicity and ease of implementation were the biggest advantages of their wide use, but these models contained mismatching problems in time duration and amplitude when compared with measured IAPs.2,5 Moreover, most widely used IAP models paid little attention to the underlying mechanisms of IAP generation by simply dividing phases of IAP.13–15 Due to these limitations in previous IAP models, a new IAP model that can show correct time duration, amplitude and physiological activities in IAP generation is necessary.
Like other excitable cells, a skeletal muscle fiber generates an IAP by ionic movements through ion channels, mainly voltage-dependent ion channels, on the cell membrane. Generally, three ions, sodium (Na+), potassium (K+) and chloride (Cl–) ions, govern the generation of a muscle IAP. During a resting state, there are excessive (typically, 10 times more) Na+ and Cl– concentrations at the exterior of muscle fibers and there is an excessive concentration of K+ in the muscle fiber. However, Cl– is often passively distributed by the concentrations of other ion species 19 and its channels are considered to always be open. Therefore, the sodium-potassium adenosine-triphosphate (ATP)-dependent pump (also called the sodium-potassium pump) maintains the net potential (generally, −90 to −65 mV) of different ion species during the resting state. At the early stage of an IAP, its potential rapidly increases because of fast-activated conductance (permeability) for Na+ (depolarization). The increased conductance for Na+ leads to more positive potential in the muscle fiber and it triggers an increase of K+ conductance to maintain its initial net potentials (repolarization). Neither depolarization nor repolarization is generated by only one ion species. Instead, the combination of multiple ion species generates each phase. For example, the initial increase in depolarization is lead by the rapid increase of Na+ conductance, and the increase of K+ conductance slows down the increasing rates of IAP depolarization. On the other hand, the Na+ conductance rapidly decreases while the K+ conductance still increases by tens of microseconds during the repolarization. Therefore, the conductance (permeability) of Na+ and K+ simultaneously affects the IAP phases with different changing rates and ionic flowing directions. However, it is difficult to measure the ionic activities on muscle fiber and even muscle fiber IAP.6,12
Nevertheless, the core relationship between an IAP and its underlying ionic transference can be looked at indirectly through a neuronal IAP and its ionic activities. The difference between the neuronal and muscular IAPs is that a neuronal IAP has an additional phase, called hyper-polarization, while a muscle IAP has three phases, being depolarization, repolarization and resting phases. Because of the different number of phases in its profile, the neuronal IAP requires more complicated ionic transference through cell membranes. However, the basic mechanisms in generating IAP in nerve and muscle fiber are considered to be similar. 19 The ionic activities in a neuronal IAP had been experimentally examined by Hodgkin and Huxley (H-H) in 1950s. In their studies, H-H showed that more than two ions concurrently governed each phase in neuronal IAP and showed the relationship between neuronal IAP phases and their ionic conductance in a mathematical model. 20 Through their experimental data and models, H-H had unveiled the core mechanisms of IAP generation in neurons and represented the concurrent profiles of IAP and different ion species. In addition, their parallel electric circuit model 20 proposed that the summation of independent ionic profiles generated a neuronal IAP. The similar generations of the nerve and muscle fiber IAPs enabled construction of a muscle IAP through the creation of a serially summated function as shown in the neuronal IAP. Here, we propose an empirical muscle IAP model with multiple Erlang probability density functions (PDFs) based on a modified Newton method. Through our IAP model, we attempt to show; (1) realistic IAP profiles and (2) a possible relationship between the Erlang PDF and the ionic activities in an IAP profile.
Muscle IAP Sources
We found 4 different sets of measured IAP data from several previous studies,1,21 shown in Figure 1. The experimentally-obtained data were from the extensor digitorum longus (EDL) and soleus muscle in the hind limb of anaesthetized rats. 1 To reduce possible computational complications in optimization, the IAP data were smoothed by the moving average method with span 5 in Matlab (version 7.8). After the smoothing procedure, there were approximately 1.01%–1.95% losses in the highest amplitudes. These errors might be observed in two measured datasets, 21 and these small losses in data were accepted in our study.

User-defined Parametric Model
We used the Gamma or the Erlang PDFs to generate an IAP model because of its mathematical convenience and easiness in modeling various curves. 22 In particular, the two parameters, α and β, in these PDFs allowed easy control of the shape of an IAP model. In addition, three Gamma or Erlang PDFs were used in our IAP model to represent the independent activities of different ionic species, Na+, K+ and leakage. As explained in the Introduction, these ionic species dominantly govern the generation of IAP, and three Gamma or Erlang PDFs were implemented on purpose.
Our previous study showed that a measured neuron or muscle IAP was optimized when a proper number of the Gamma PDFs were employed. 23 However, the final optimizing solution was irreproducible because the solution is affected by some optimizing factors, such as the fractional parameter, Marquardt parameter and iteration step size. 23 The different values in a final solution could cause ambiguity in the generated model. To resolve this ambiguity in the final IAP model, the Gamma PDF was replaced by the Erlang PDF, which is a specialized Gamma PDF with the integer shape parameter, a, instead of a real value. By using the Erlang PDF in the user-defined parametric model, the final solution was expected to be more definite than the model with Gamma PDFs. Therefore, the final muscle IAP model was composed of three Erlang PDFs instead of Gamma PDFs as follows:

where
To see how these three parameters, α, β, and γ, affect the shape, the rate and the amplitude of a PDF, respectively, we examined PDFs with different combinations of these parameters. The changing ranges for α, β and γ were limited based on the results of our previous study 23 and the ranges were 1~10, 0.1~10 and 1~100 for α, β and γ, respectively. Apparently, γ only affects the amplitude of a PDF with no changes in the shape and the rate of a PDF. However, as α decreases with constant values of β and γ, a PDF becomes a relatively more right-skewed in shape. On the other hand, β affects the changing rate of a PDF; as β decreases, a PDF increases and decreases faster. Through this empirical test, we concluded that α, β and γ directly control the shape, the rate and the amplitude of a PDF, respectively.
Optimization and Generalization
By using the user-defined parametric function in equation (1), three different numerical optimizations, including a modified Newton, Steepest Descent and Conjugate Gradient methods, were applied to find a nonlinear least square solution for [α1,α2,α3,β1,β2,β3,γ1,γ2,γ3]. Generally, the uniqueness of obtained solutions is one of the most challenging processes in an “inverse problem“ during optimizations. 24 We used different optimization methods on source #1 and the best performed method, the modified Newton method, was selected (Fig. 2). This optimization method was then applied on other sources (#2, #3 and #4) to find their unknown parameters for [α1,α2,α3,β1,β2,β3,γ1,γ2,γ3]. Initially, a measured IAP was set as a reference signal and the initial values for the parameters, [a1,α2,α3,β1,β2,β3,γ1,γ2,γ3], in equation (1) were given as [1, 5, 8, 0.35, 3, 6, 8, 580, 14000], respectively. By using this reference and the user-defined parametric function, the first residue was computed.


Modeled IAP (in black dots) and its reference (in gray dashed line).

where


where,

where,

where, κ is the step size or step length, and

where arg min means the argument of the minimum for the user-defined parametric function,


where

where
In every updating of the parameter matrix, the newly computed parameter matrix was compared with the previous parameter matrix by computing a new residue. This new residue was again used for calculating a new SSR. Through this iterative procedure, the initial parameter matrix was updated and generated a new temporal IAP model. If a new SSR was smaller than the previous one, the Marquardt parameter, μ, was divided by a specific factor, which was generally pi (π), and it generated a new value for μ for next iteration. In the opposite case, μ was multiplied by pi (π) for next iteration. This core process was shown in equation (12).

where SSRold and μold were a previous SSR and Marquardt parameter, and SSRnew and μnew were a new SSR and Marquardt parameter, respectively. Due to the limits in finding a complete zero (0) error solution, the iterative process was terminated when there was no additional decrease in newly computed SSR values.
Results
Parametric model optimization and generalization
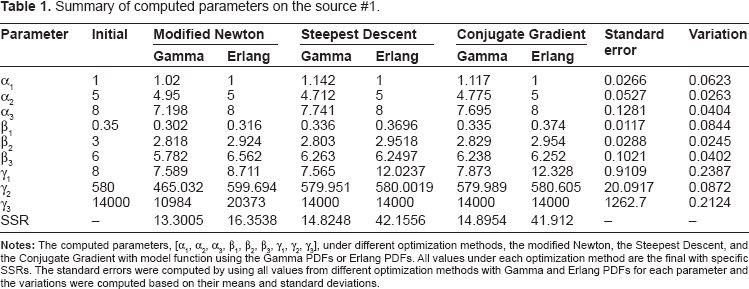
Different optimization methods were applied on IAP reference #1 with the user-defined parametric model shown in equation (1). The performance of each method was measured by SSR values and the modified Newton method showed the best performance, as shown in Table 1. A smaller value in SSR meant a closer model to the source. Figure 2 shows the result of the modified Newton method on the parametric model with the Erlang PDFs. The computed parameters were [1, 5, 8,0.3,2.9,6.6,8.7,599.7, 20373] for [α1,α2,α3,β1,β2,β3,γ1,γ2,γ3], respectively. The modified Newton method was again applied on the other IAP references in Figure 1, and the unknown parameters were determined in specific numbers for α and ranges for β. As shown in Table 2, the values of α were consistent with [1, 5, 8] for [α1,α2,α3] and those of β ranged from 0.23–0.49 for β1, 2.90–3.25 for β2, and 6.47–13.07 for β3. Once the values of α and β were determined, the values of γ were finally selected to adjust the overall IAP model amplitude. To generate a general muscle IAP, the values in α, β, and γ were replaced by the mean values of their result ranges. Figure 3 and Table 3 represent our generated muscle IAP model and its final parameters.
Summary of computed parameters on the source #1.
Computed parameters on the source #2, #3, and #4.

Final parameters for a muscle IAP model.


Modeled IAP (in black line) and IAP references (in gray lines).
Model verification: peak-to-peak ratio (PPR)
An IAP is a fundamental unit in generating SFAP and each phase of the IAP profile affects the changes of the peak-to-peak ratio (PPR), which is the ratio of the maximum and minimum in SFAP, its positive first and negative second amplitude, respectively.12,25,26 According to some previous studies, the PPR of a SFAP is an independent parameter from electrode positions within 0.3 mm.12,25,27,28 It implies that an IAP is the main factor to affect its SFAP as long as the radial distance of an electrode from a muscle fiber is limited to 0.3 mm. Therefore, we verified our IAP model by comparing the PPR of its SFAP with those of the given reference IAP sources.
First, we generated the SFAPs of our IAP model and the obtained IAP references, assuming a cylindrical shape of the muscle fiber and a centrally located neuromuscular endplate. 29 As indicated in the previous studies,12,25,27,28 the radial distance of the electrode from a muscle fiber was changed from 0.047 to 0.3 mm, which was the recommended range of the radial distance to maintain the PPR of a SFAP as an independent parameter from the factor of the distance between an electrode and a muscle fiber.12,25 Except for the radial distance, most parameters for the SFAP model were the same as those from our previous SFAP modeling study. 29 Using the obtained SFAPs, their PPRs were plotted based on the given radial distance. All computed PPRs showed a similar changing pattern; a curved shape up to the distance of 0.2 mm and a linear relation between 0.2 and 0.3 mm (Fig. 4). Therefore, 3 linear regressions were applied on the plotted PPRs; one overall and 2 local linear regressions. Due to the curved shape in PPR, we examined 2 local linear regressions in addition to the overall linear regression. The dividing point for 2 local linear regressions was 0.2 mm of the radial distance, at which the curved portion of PPR ended. Figure 4 and Table 4 represent the sensitivities (slopes of linear regressions) of the PPRs of the modeled SFAPs from our IAP model and the 4 different sources. The PPR based on our IAP model had a sensitivity of 0.05 in the overall linear regression and its 2 local sensitivities were 0.036 (radial distance (r) < 0.2 mm) and 0.073 (r > 0.2 mm). Three IAP references showed sensitivities overall (0.044–0.063) and in the 2 local linear regressions (r < 0.2 mm: 0.031–0.044; r > 0.2 mm: 0.066–0.091). However, the reference #4 showed a relatively large difference in the sensitivity overall (0.141) and in the 2 local sensitivities (r < 0.2 mm: 0.1; r > 0.2 mm: 0.204). This result occurred because the IAP source #4 had a longer duration between depolarization and repolarization, unlike our IAP model and other IAP sources.

IAPs and peak-to-peak ratio (PPR) with their sensitivities.
The sensitivity of peak-to-peak ratio (PPR) based on the radial distance.

Discussion
A SFAP represents the general profile of electromus-cular activities. Therefore, it is critical to appreciate its underlying mechanism. Generally, the waveform of a SFAP is dominantly affected by that of its IAP and the distance from an active muscle fiber to the recording position.1–3,5,6,12 In the aspect of modeling and simulations, the distance for measurement can vary and depend on initial modeling assumptions. Therefore, the generation of the SFAP is mainly affected by the profile of the IAP. 6 Notably, some previous studies indicated that the dependence of SFAP on IAP becomes stronger when the radial distance of the measuring electrode is properly positioned; for instance, when it is limited to 0.3 mm.12,25,27,28 Our previous study hypothesized that a muscle IAP can be expressed in the summation of three independent Gamma PDFs by using a modified Newton optimization with a Levenberg-Marquardt algorithm. 23 However, the Gamma PDFs increased the ambiguity of the user-defined parametric model inconsistently within the model parameters, [α1,α2,α3,β1,β2,β3,γ1,γ2,γ3]. To reduce this modeling uncertainty, we replaced Gamma PDFs with Erlang PDFs by providing a further restricted form of the shape parameter, α, as an integer. This restriction in the shape parameter of an Erlang PDF increased the repeatable modeling constancy.
Our IAP model was verified by how closely it was to the given IAP referent sources by comparing the PPR of its SFAP with those of referent IAPs in the limited radial distance of the electrode. The computed sensitivities in Table 4 showed the closeness between the modeled IAP and the given IAP sources. Based on the computed sensitivities, the IAP model was closer to sources 1, 2 and 3 than to source 4. The IAP model had a similar profile to sources 1, 2 and 3 while source 4 had an apparent longer time interval between the phases of depolarization and repolarization, which directly affected the PPR sensitivity. 12
Because our IAP model was optimized based on experimental results, our IAP model was free from issues, such as mismatching time durations and amplitudes reported in previous models.3,12 Moreover, one noticeable advantage of our IAP model was that three independent Erlang PDFs generated an IAP profile by combining the effects of these PDFs in each phase of the IAP. The combination of these PDFs in generating an IAP phase might easily explain the underlying ionic activities in a real IAP generation. As explained, each phase of the IAP is not generated by only one ionic species but the concurrent various ionic movements through the cell membrane generate each phase in an IAP. Unfortunately, there have been few studies that reveal the concurrent ionic activities in a muscle IAP, and it hardly proved that each PDF was directly related, considering the changes of ionic conductance or ionic voltage by Na+, K+ and leakage (or C1–). However, these PDFs are possibly related to the ionic profiles during IAP generation when they are compared with those of a neuronal IAP (Fig. 5).

Models of Sodium (Na+) and potassium (K+) conductance during a neuronal (top) and a muscle (bottom).
Conclusion
The objective of this paper was to develop a muscle fiber IAP model, which has a reliable and realistic profile. Because of its fundamental function in generating a SFAP, we verified our IAP model by generating its SFAP and those of measured muscle IAPs. Specifically, the PPR of the SFAP based on our IAP model indicated that our IAP model had a close profile to other measured IAP referents. Our verification also showed that the relation between the IAP profile and the PPR of its SFAP was consistent with the results of some previous studies. Furthermore, we observed the possibility that the Erlang PDFs in our IAP model might have a relation with the underlying activities of ions or their channels when their profiles are compared with the neuronal ionic activities. Because of the limitations in measuring the activities of ions and their channels on a muscle fiber, this observation was unable to be clearly validated. Finally, we successfully generated a true and dependable IAP model in multiple functional combinations for each phase of an IAP. Our future studies will focus on the validation of ionic profiles in a muscle IAP model based on measured activities of ions and their channels.
Author Contributions
Conceived and designed the experiments: GK, MF, FM. Analyzed the data: GK, MF, FM. Wrote the first draft of the manuscript: GK. Contributed to the writing of the manuscript: GK, MF, FM. Agree with manuscript results and conclusions: GK, MF, FM. Jointly developed the structure and arguments for the paper: GK, MF, FM. Made critical revisions and approved final version: GK, MF, FM. All authors reviewed and approved of the final manuscript.
Funding
Author(s) disclose no funding sources.
Competing Interests
Author(s) disclose no potential conflicts of interest.
Disclosures and Ethics
As a requirement of publication the authors have provided signed confirmation of their compliance with ethical and legal obligations including but not limited to compliance with ICMJE authorship and competing interests guidelines, that the article is neither under consideration for publication nor published elsewhere, of their compliance with legal and ethical guidelines concerning human and animal research participants (if applicable), and that permission has been obtained for reproduction of any copyrighted material. This article was subject to blind, independent, expert peer review. The reviewers reported no competing interests.