
Abstract
Malaria is one of the deadly diseases, which affects a large number of the world's population. The
Keywords
Introduction
Models have been defined as a simplified description of a physical system, which is meant to represent the important aspects of the system in a simple form. 1 The act of creating these models with the purpose of describing it, understanding it, or deriving some hidden properties is known as modeling. Several classifications of models exist, which include qualitative or structural models and quantitative models; deterministic and stochastic models; and discrete and continuous models, and others. Although a qualitative or structural model, eg, a network graph, specifies the interactions among model elements, a quantitative model assigns values to the elements and to their interactions. 2
Computational modeling of biological networks, such as metabolic pathways, protein–protein interaction networks, neural network, food webs, gene regulatory networks, and signaling networks, has received much attention in the past decade. Likewise, mathematical modeling has been used increasingly to get insights into the functioning of complex biology networks. It is of utmost importance to understand and to interpret the complex interactions between biological systems and also certain behavioral patterns in organisms, cells, or a given metabolism; these interactions are too intrinsic to comprehend intuitively. For example, the human brain is estimated to be built of about a hundred billion neural components with hundreds of trillions interconnections, 3 the mere description of this requires computational techniques. There is almost no real understanding of the design principles that govern intact biological systems.
A metabolic network is simply a graphical representation of metabolism. Formally, it is defined as a collection of objects and the interactions that exists among them. The objects correspond to chemical compounds, biochemical reactions, enzymes, and genes. 4 A metabolic network consists of the chemical reactions of metabolism as well as the regulatory interactions that guide these reactions. It is important to develop an understanding of how the cell meets its metabolic objectives through the analysis of metabolic networks, so that the goal of creating, destroying, or even enhancing the production capabilities of an organism can be easily achieved. 5
A metabolic pathway is an interconnected series of enzymatic reactions that occur within a cell. It consists of consecutive chemical reactions, which transform input compound(s) (substrates) via several intermediate compounds into an output compound (product).
6
Consequently, the task of any metabolic pathway is to modify a principal chemical compound to form another chemical compound that can be used up, passed on to start another pathway, or stored up by the cell. The vast occurrence of the glycolysis pathway indicates that it is one of the most ancient known metabolic pathways.
7
It converts glucose 
According to the World Health Organization's (WHO) annual malaria report, an estimated 207 million cases (uncertainty interval, 135-287 million) and 627,000 malaria deaths (uncertainty interval, 473,000-789,000) have occurred in 2012 in Africa.
8
It is well established that
Related Works
Petri nets (PNs) have been suggested to be well suited for modeling metabolic networks by overcoming some limitations such as applying ordinary differential equations (ODEs) to a very large and complex system, which can be an uphill task. 11 Since then, a lot of further conceptual work, technical tool implementations, and applications into biological problems have been reported and have demonstrated the usefulness of this concept that is known today as systems biology. Apart from PNs being intuitively understandable to scientists trained in life sciences, they also have a strong mathematical foundation and provide the required flexibility with regard to the models’ granularity. They have been successfully used in modeling various biological pathways. 12 Hence, PN technology appears to be a very promising approach to modeling various forms of biological systems. 13 Sackmann et al. 14 provided a systemic modeling method of signal transduction pathways in terms of PN components. Chaouiya 2 provided an overview of the different types of biological networks. This includes colored PN, stochastic PN, hybrid PNs, and hybrid function PNs. Hardy and Robillard 15 also discussed the modeling and simulation of molecular biology networks. They identified two categories of the goals of PN biological modeling: qualitative and quantitative analyses. Qualitative analysis is the analysis of different biological properties, while quantitative analysis is the simulation of system dynamics. For quantitative analysis, a PN representation with sufficient modeling power should be kinetic parameters, in which reaction rates and stoichiometric quantities of reactants are necessary. Heiner et al. 16 demonstrated a generalized approach toward modeling and analysis of biological pathways using PNs.
Therefore, to model and analyze biochemical pathways on a qualitative level, we need to establish the concept of elementary modes,
17
which are based on the incidence (stochiometric) matrix of the underlying directed graph. Our modeling approach is based on the use of the modeling tool called PNs to construct an in silico metabolic network that shows the interactions between the metabolites and the reactions in the glycolysis pathway of
Materials and Methods
We obtained data for the glycolysis pathway of
A data extraction program was written in Java to extract data from these files. The following details were extracted for each reaction in the glycolysis pathway: reaction unique-ID, common name of the reaction, reactants, reactant stoichiometry coefficients, products, product stoichiometry coefficients, reversibility, E.C. number, enzyme, and the common name of the enzyme. With the results of the data extraction, we got a stoichiometric matrix for the pathway and then built the PN model. The construction of the PN is based on the stoichiometric matrix for the metabolic reactions. For a stoichiometric number matrix, the column represents each reaction and the row represents each reactant. The reactants on the left (left child) have the stoichiometric numbers with negative signs, while the reactants on the right (right child) have a stoichiometric number with a positive sign.
18
The stoichiometric number matrix,
Definitions and Notation
Petri nets
PNs were first proposed by Carl Adam Petri in 1962. They can be used for describing and modeling dynamic systems that can be characterized as concurrent, synchronous, distributed, parallel, nondeterministic, and/or stochastic systems. A PN is a directed weighted bipartite graph that consists of two types of nodes: places and transitions represented by circles and boxes, respectively. There can only be arcs from places to transitions as well as from transitions to places. The arc weights are positive integers and the absence of a weight implies weight units. A marking is a vector that represents an assignment of a nonnegative number of tokens (denoted by dots) in all places in a given PN. In a PN model of a dynamic system, conditions are represented by places and events by transitions.
As a mathematical tool, PNs provide a uniform environment for the formal analysis, design, and modeling of discrete event systems. The simplest form of a PN is a bipartite digraph, which is a graph with two nodes, namely, input and output. The main idea with PNs is to represent the states of subsystems separately. Then, the distributed activities of a system can be represented very effectively. 20 A formal description of PNs can be seen in Refs. 21 and 22. PN is a promising tool for describing and studying information-processing systems, which are characterized as being concurrent, asynchronous, distributed, parallel, nondeterministic, and/or stochastic. PNs are constructed from four basic elements, as follows.
Places
It is represented by a circle/oval. It shows a system's state. It is either input or output, and every PN must have an input and an output place. Places might be marked by an integer number of tokens. The overall state of a system of
Transitions
It is represented by a rectangular bar. It is used to change a system's state, it receives tokens from the input place(s) and distributes it to the available output place(s).
Arcs
It is represented by a directed arrow, and it is either an inward arc (arrow directed from a place to a transition) or an outward arc (arrow directed from a transition to a place). The arcs may be labeled with an integer representing the weight, if unlabeled it is assumed that the weight = 1.
Tokens
It is represented by a dot or a shaded circle; it is usually inside of a place. A token is what usually transferred (this is what we move from one place to another).
Formal Definition
PN is defined as a 5-tuple α = (
A 
Similarly, a 
The 

A set of rules defined below control the behavior of a PN model for simulating a dynamic system.
Suppose
If an event takes place, the corresponding enabled transition will fire, otherwise it will not.
Let |

From the biological point of view, the tokens residing in places indicate whether the corresponding chemical species is present, ie, its concentration is above a certain concentration level (threshold) in the cell. This presence enables the chemical reactions modeled by the place's posttransitions to take place.
A current distribution of the tokens over all places, given as
The incidence matrix 
A
Similarly, for all minimal semipositive 
A 
The nodes corresponding to the nonzero entries of an invariant 
Metabolic Networks
Reasons for using mathematical models to represent metabolic networks include the following: organization of disparate information into a coherent; self-consistent whole, to think (and calculate) logically about what components and interactions are important in a complex system; simulation, prediction, and optimization of procedures, experiments, and therapies, to disprove hypotheses, to define improved hypotheses, and to understand the essential features of a system. 23 Other models apart from PNs that have been proposed to model biological systems include the following: ODEs, process calculi, Boolean networks, Bayesian networks, bipartite graphs, stochastic equations, and Markov chains.24–27 The applications of these techniques have given rise to a new branch of study called system biology or in silico biology. 28
To give a PN representation of a metabolic pathway, places represent the by-products of metabolism, ie, metabolites, proteins, and enzymes; transitions represent chemical reactions; input places represent reactants or substrates; and output places represent reaction products. The stoichiometric matrix of a pathway is equivalent to the incidence matrix of the PN, and the arc weights can be gotten by the given stoichiometric coefficients. The number of tokens in each place indicate the amount of substance associated with that place; the flux modes and the conservation relations for metabolites correspond to specific properties of PNs. In particular, minimal (semipositive)
Relationship between PN elements and pathway elements. 29

An illustration of the PN representation of the well-known chemical reaction 2H2 + O2 → 2H2O is shown in Figure 2. The first PN represents the state before the reaction occurs (ie, before the transitions fire), while the second represents the state after the reaction has occurred.

A simple PN.

A PN representation of a chemical reaction. 22 © 1989 IEEE. Reprinted with permission from Murata, T. Petrinets: properties, analysis and applications. Proceedings of the IEEE; 1989;77(4):541-80.
Results and Discussion
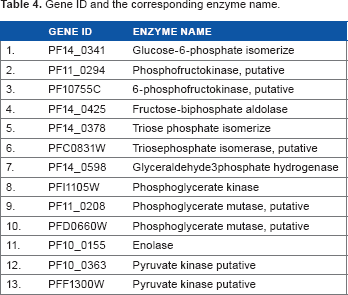
From our data extraction from the PlasmoCyc files, a total of 11 reactions were extracted. A total of six of these reactions were reversible and five were irreversible. These reactions were catalyzed by a total of 13 enzymes. The results of the data extraction processes are summarized in Table 2. The abbreviations of compounds and their corresponding meanings are given in Table 3, while Table 4 summarizes the gene identification (Gene ID) and the corresponding enzyme name.
Overall reaction layout of the glycolysis pathway.

Abbreviations of compounds and their full meanings.

Gene ID and the corresponding enzyme name.
From the data extraction, we constructed a stoichiometric matrix (Fig. 3) using the stoichiometric coefficients. We multiplied by -1 for substrates and +1 for products. The zero entries mean that the metabolite did not participate in the given reaction. This was then used to construct the PN model (Figs. 4 and 5). The model is available in PNML format in Supplementary File 2.

Stoichiometric matrix for glycolysis pathway.

PN construction of the glycolysis pathway (before firing).

PN construction of the glycolysis pathway (after firing).
Figures 4 and 5 show the construction of the glycolysis pathways before and after firing. In Figure 5, the following transitions were fired: 4.1.2.13(r), 5.3.1.1, 1.2.1.12(r), 2.7.2.3(r), 5.4.2.1(r), 4.2.1.11(r), 2.7.1.40, and 2.7.9.2.
Model Validation
The aim of model validation is to check the constructed PN for inconsistencies in the given system, hence deriving statements on the structural and dynamic properties that reflect the activities of the system in reality. 30
The PN model of the glycolysis pathway after firing shows one token each in the final output places (ATP-3, pyruvate), verifying that the model constructed conforms to the results from the data analysis since the stoichiometric coefficients of both ATP-3 and pyruvate are 1. The constructed PN model consists of 32 places and 17 transitions. The reversible reactions are modeled as forward and backward reactions.
Structural Analysis
This is to discover certain structures that allow conclusions on dynamic properties. It involves the calculation of elementary properties. Structural analysis checks if the net is ordinary, homogenous, conservative, pure, static, conflict free, and connected or strongly connected in graph-theoretical sense. The unbounded net is not ordinary because the arc weights (stoichiometric numbers) in the reaction equation are not equal to one. The net is not homogenous because not all the places in the pathway have the arcs starting there having the same weight. This property usually holds for signal-transduction pathways, 14 and the pathway being modeled in this work is a metabolic pathway.
The construction of the network is not conservative because not all the transitions have the sum of the input arc weights equal to the sum of the output arc weights. Therefore, all reactions do not work in a token-preserving way. It is not static-conflict free because there are transitions sharing the same input places.
A metabolic PN would not be free of static conflicts because compounds may be used by several reactions. Since the model is not a bounded model, we cannot compute the reachability graph.
Figures 6 and 7 are the PN constructions of the inhibited glycolysis pathways before and after firing. From Figure 7, the following transitions were fired: 5.3.1.9(r), 2.7.1.11, 3.1.3.11, and 5.3.1.9.

PN construction of the inhibited glycolysis pathway (before firing).

PN construction of the inhibited glycolysis pathway (after firing).
The purpose of inhibiting certain reactions is to show that they are essential reactions and are absolutely required for the pathway to function. To simulate reaction inhibition, an additional place was introduced to the corresponding transition, representing the enzyme responsible for the reaction. The place was then connected to the transition with an inhibitor arc, resulting in the transition not firing; hence the final product of the pathway cannot be produced. The essential reactions in the pathway are listed in Table 5.
List of important reactions.

Invariant Analysis
The net contains, but is not covered by, the following
Invariant A – ATP, AMP, and ADP (these are the metabolites containing adenosine residues).
Invariant B – set of all the compounds that provide a phosphate group either directly or indirectly. If the phosphate group is transferred from one compound to another, the sum of the phosphorylated metabolite remains unchanged. If no phosphate is taken up or secreted by a cell, the sum of phosphate groups in all metabolites, including inorganic phosphate, would also remain unchanged.
The following compounds are the compounds that contain a phosphate group.
Fructose 6-phosphate;
Fructose-1,6-diphosphate;
Glucose 6-phosphate;
Phosphoenolpyruvate;
Dihydroxylacetone phosphate;
Glyceraldehyde 3-phosphate;
Phosphopyruvate;
Adenosine triphosphate (ATP);
Adenosine diphosphate (ADP); and
Pi.
Discussion
This model of glycolytic pathway in
Another enzyme of importance is
Although there is a dearth of information on
The uniqueness in the structure and function of
Conclusion
Various forms of PN representation have been successfully used in the analysis of many biological networks especially for gene regulation, signal transduction, and metabolic systems. This study was done to show the use of PNs as a tool to model, quantitatively and qualitatively, the glycolysis metabolic pathway. The results characterize the net structure and give insights into the complex net behavior of the pathway.
Author Contributions
Conceived the concepts and the case study of this work: JO, II. Designed and analyzed the work: JO, II, IO. Made some valuable contributions in the application of PN techniques: II, IO. Defined the topic and gave substantial contributions to the design of the research project: JO, II. Performed the analysis of the biological interpretation: SR. All the authors conceived the article preparation and read and approved the final article.
Supplementary Materials
Footnotes
Acknowledgments
The authors acknowledge the contribution of the reviewers in improving the quality of the manuscript.