
Abstract
This study represents the first swine transcriptome hive plots created from gene set enrichment analysis (GSEA) data and provides a novel insight into the global transcriptome changes occurring in tracheobronchial lymph nodes (TBLN) and spanning the swine genome. RNA isolated from draining TBLN from 5-week-old pigs, either clinically infected with a feral isolate of Pseudorabies virus or uninfected, was interrogated using Illumina Digital Gene Expression Tag Profiling. More than 100 million tag sequences were observed, representing 4,064,189 unique 21-base sequences collected from TBLN at time points 1, 3, 6, and 14 days post-inoculation (dpi). Multidimensional statistical tests were applied to determine the significant changes in tag abundance, and then the tags were annotated. Hive plots were created to visualize the differential expression within the swine transcriptome defined by the Broad Institute's GSEA reference datasets between infected and uninfected animals, allowing us to directly compare different conditions.
Introduction
Respiratory diseases are extremely costly to the swine industry, and research is essential for gaining a better understanding of the pathogenesis, diagnosis, and prevention of a respiratory disease. Pseudorabies virus (PRV) strain FS268 virus-induced pneumonia in young pigs provides a model for examining the response of the immune system to a respiratory pathogen. 1
PRV is a neurotropic alphaherpesvirus 2 that produces fatal encephalitis in newborn pigs, respiratory disorders in fattening pigs, and reproductive failure in sows. There are three classes of swine in the US as defined in the USDA Veterinary Services PRV Program Standards: feral swine that are wild and free roaming, transitional swine that are considered to be owned by someone and may enter the food chain, and commercial swine that are raised in an environment in which there is no contact with feral swine. Since the eradication of PRV from the US commercial swine herd, there have been rare case reports of transitional swine becoming infected with feral swine PRV isolates. The continued expansion of the feral swine population in North America presents an emerging threat to the PRV-free status of the US commercial swine herd.
Relatively little is known about the interactions of PRV and the cells infected by PRV in vivo. It is known that viruses hijack the biosynthetic, metabolic, and signaling machinery of the cell for their own ends. Viral proteins interact with specific cellular components to alter the function of these pathways and even alter gene expression in the host cell to bring about successful replication and production of progeny virus. As a defense, the cell has a number of innate mechanisms for detecting the diversion of these functions and will initiate events to inhibit viral replication or to kill itself in an attempt to stop the infection. These events, and how effective they are, have a profound effect on the events that follow, which include the ability to respond to and end the infection at the cellular or organismal level and the pathological changes that may occur, leading to death in severe cases. 3 The isolation of PRV from porcine alveolar macrophages indicates replication of PRV during the course of infection that directly impairs the host's defense mechanisms in the respiratory tract through lytic destruction of cells. The indirect effects on the host and the host response to infection can be measured through transcriptomics, which provides insight into the molecular host/pathogen response. In the case of PRV infection of nursery-age swine, we expect an acute respiratory disease that may be resolved by a robust host response, or if the virus is sufficiently pathogenic, it may result in a central nervous system infection and death. To characterize the host–virus interaction, we chose to examine the tracheobronchial lymph nodes (TBLNs) that drain the inflamed lungs, because the lymph node is the site where the innate (early, nonspecific) immune response communicates with the adaptive (later, specific) immune system, which could provide a temporal site to study the host response to a viral pneumonia.
Serial analysis of gene expression (SAGE) is a powerful technique that allows for a detailed and profound quantitative and qualitative knowledge of gene expression profiles, without previous knowledge of the sequence of analyzed genes. The output of eukaryotic genomes is much more complex than expected. Genes produce different variants of RNAs from multiple promoters. One of the ultimate targets of biological analysis is to establish a relationship between the messenger RNAs that are transcribed and the genomic regions (promoters) that control their expression. This entails deciphering the networks that regulate gene expression and the transcription factors that act as master regulators of transcriptional control.
Digital gene expression tag profiling (DGETP) is the most advanced derivate of the SAGE technology for the analysis of expressed genes in eukaryotic organisms (gene expression profiling). 4 As in SAGE, a specific tag from each transcribed gene is recovered. By sequencing and counting as many tags as possible, the transcription profile, stating what gene is identified and how often, becomes apparent. DGETP uses the restriction enzyme, DpnII, to cut 21 bp long sequence tags from each transcript's cDNA, expanding the tag size by at least 7 bp as compared to the predecessor techniques such as SAGE and LongSAGE. The longer tag size allows for a more precise allocation of the tag to the corresponding trancript, because additional bases increase the confidence in the mapping of the tag to a transcript or genomic position. We used the Solexa/Illumina Genome Analyzer II, in which adapter sequences, ligated to both ends of the DNA molecule, are bound to a glass surface coated with complementary oligonucleotides. This is followed by solid-phase DNA amplification and sequencing by synthesis. 5 The system yields millions of short reads and is therefore very suitable for tag-based transcriptome sequencing. Each and every transcript can be quantified by counting the tags in a DGETP library such that quantitative genetics is readily possible with DGETP.
Our objective was to study the changes in the transcriptome within the porcine TBLN during the acute phase of PRV infection. Using DGTEP, we identified host genes that showed significant changes in mRNA levels during experimental PRV infection in vivo. Here, we present a large-scale analysis of the porcine physiological pathways regulated during viral infection.
Methods
Virus, Animals, and Experimental Design
The animal study, conducted according to the National Animal Disease Center Institutional Animal Care and Use Guidelines, has been previously described by Miller et al. 1 Briefly, 40 conventionally raised 4- to 5-week-old pigs, free of clinical disease, were purchased from a Porcine Circovirus 2-, Swine Influenza Virus-, Porcine Respiratory and Reproductive Virus-, and PRV-negative herd. Pigs were equally allotted to two equal treatment groups, and each group was housed in an isolation room for about one week prior to the beginning of the experiment. On 0 day post-inoculation days post-inoculation (dpi), pigs received an intranasal challenge with 2 mL of either sham inoculum (n = 20), prepared from swine testicle cell culture, or virus inoculum (n = 20) of the Florida strain isolate (FS 268) of feral swine PRV 6 at 1 × 10 6 cell culture infectious dose 50% (CCID50) per pig. Five pigs from each group were euthanized and necropsied on 1, 3, 6, and 14 dpi.
Tissue Collection and Total RNA Isolation
One gram of TBLN from each pig was collected immediately upon necropsy, minced, and stored in RNAlater at −80 °C until homogenization for extraction of total RNA with MagMAX™-96 for Microarrays Total RNA Isolation Kit (Applied Biosystems) according to the manufacturer's protocol. The integrity of the RNA was confirmed using a 2100 Bioanalyzer and RNA 6000 Nano-chip (Agilent Technologies). The samples had an average RNA Integrity Number (RIN) value of 7.8 and 28S:18S rRNA ratio of 1.9.
Digital Gene Expression Tag Profiling
Tag library preparation was performed at Iowa State University DNA facility using a DGETP DpnII Sample Prep kit and protocol (Illumina). In brief, total RNA aliquots (1 mg) were diluted in 50 mL of nuclease-free H2O and heated at 65 °C for five minutes to disrupt the secondary structure prior to incubation with magnetic oligo-dT beads to capture the polyadenlyated RNA fraction. First- and second-strand cDNA were synthesized, and bead-bound cDNA was subsequently digested with DpnII to retain a cDNA fragment from the most 3’ GATC to the poly(A)-tail. Unbound cDNA fragments were washed away prior to ligation with GEX DpnII adapter to the 5’ end of the bead-bound digested cDNA fragments. This adapter contains a restriction site for MmeI that cuts 17 bp downstream from the DpnII site. After subsequent digestion with MmeI, 21 bp tags starting with the DpnII recognition sequence were recovered from the beads and dephosphorylated prior to phenol–chloroform extraction. Then, a second adapter (GEX adapter 2) was ligated onto the 3’ end of the cDNA tag at the MmeI cleavage site. The adapter-ligated cDNA tags were enriched by a 15-cycle PCR amplification using Phusion polymerase (Finnzymes) and primers complementary to the adapter sequences. The resulting fragments were purified by excision from a 6% polyacrylamide TBE gel.
The DNA was eluted from the gel debris with 1 X NEBuffer 2 by gentle rotation for two hours at room temperature. Gel debris was removed using Spin-X Cellulose Acetate Filter (2 mL, 0.45 μm), and the DNA was precipitated by adding 10 μL of 3 M sodium acetate (pH 5.2) and 325 μL of ethanol (-20 °C), followed by centrifugation at 14,000 rpm for 20 minutes. After washing the pellet with 70% ethanol, the DNA was resuspended in 10 μL of 10 mM Tris-HCl at pH 8.5 and quantified with a Nanodrop 1000spectrophotometer. Sequencing using Solexa/Illumina Whole Genome Sequencer Cluster generation was performed according to the manufacturer's instructions. Image analysis and base calling were performed using the Illumina Pipeline to create a fastq file for each library. The data for each library have been submitted to the public repository Gene Expression Omnibus (GSE74473).
Transcriptome Determination
Figure 1 depicts how the tag data were processed, related to preexisting genomic data, and analyzed.

Data processing pipeline. Step 1 – populate the Identitag database with tag data and library metadata. Step 2 – Compute differential TBLN transcript abundance between PRV-infected and control swine pools with MatLab. Step 3 – Discover significant associations between groups of DE swine genes with pathways and other datasets.
Step 1 – Populate the Identitag database with tag data and library metadata. Illumina fastq files for the infected and control libraries were processed by a custom perl script that created the three-column Filtered Tag Count File consisting of the first 20 bases of the tag sequence, raw tag count, and the normalized tag count in units of tag per million (TPM). A transcripts per million value for a specified transcriptional unit (TU) was calculated by counting the appearance of DEGTP tags for a given TU divided by the total number of TU counts obtained from a particular tissue and normalized per million. Using a customized perl script, the Filtered Tag Count File for each library was parsed into the Identitag database as well as sequencing library metadata, as previously described. 7 The Identitag database has been optimized for tag-centric queries that provide a convenient mechanism to associate swine tags with RefSeq (NM_and XM_) transcripts. Only those tags that mapped uniquely to the swine genome assembly SGSC Sscrofa10.2/susScr3 were used in subsequent steps in our pipeline.
Step 2 – Compute differential TBLN transcript abundance between PRV-infected and control swine pools with MatLab. For each library, the tag sequences and associated normalized abundance at two TPM or greater were imported into MatLab cells using the MatLab Toolbox's query builder utility and aggregated into infected and control four-column matrices; the columns corresponded to 1, 3, 6, and 14 dpi, while the rows were associated with a unique tag sequence. The methods of Audic and Calaverie 8 were used to calculate a P-value for each infected: control pair at 1, 3, 6, and 14 dpi. These P-values were corrected for multiple testing, and to generate an associated q-value, the positive false discovery rate corrected analog of the P-value was calculated according to the methods of Storey and Storey and Tibshirani9,10 with mafdr (Bionformatics Toolbox function). For each dpi using unique tag sequence and their q-values as input, volcano plots (Bionformatics Toolbox mavolcanplot) were used to select those tags with at least a twofold abundance difference between infected vs control with a significance q-value of 0.01 or less. The tags selected in this manner were defined to be differentially expressed (DE). The DE tags at time X were clustered with respect to their abundance at every time point throughout the course of the experiment using a correlation distance measure (Statistics Toolbox – k-means, using the distance: correlation parameter: value pair) to cluster the data; this distance measure is useful because both highly and lowly abundant tags that tend to change synchronously through time will cluster together. Optimum cluster number was determined by maximizing the distances between the clusters using silhouette plots (Statistics Toolbox – silhouette using the correlation interpoint distance function). The DE tag sequences, q-values, fold changes relative to control, and cluster number at every time for this virus challenge experiment were saved in a Matlab DataMatrix object (Bioinformatics Toolkit); additionally, flat file representation of each of the DataMatrix objects was created and parsed into the Identitag database, one table for each DataMatrix object. Ad hoc queries were constructed to link tag sequence, transcript, gene, and finally to gene metadata. For instance, a view was constructed to link DE tag sequence to both the swine RefSeq transcript and the swine gene symbol.
Step 3 – Discover significant associations between groups of DE swine genes with pathways and other datasets. The input of gene set enrichment analysis (GSEA) was a two-column tab delimited file, false discovery rate corrected Ranked Gene list, with the gene symbol of the DE tag in the first column and fold change tag abundance of infected relative to control in the second column. The genes in this list were ranked from most overexpressed to most underexpressed. The data gene rank files were loaded into GSEA via its “Load Data” menu item and subsequently processed using the GSEA Pre-Ranked Gene List tool using the following parameters: nperm:1000, norm:meandiv, collapse:false, set_min:5, set_max:1500, make_sets:true, mode:Max_probe, scoring_scheme:weighted. In our analyses, chip: gseaftp.broadinstitute.org://pub/gsea/annotations/GENE_SYMBOL.chip, we used the following reference gene lists: c2.all.v3.0.symbols.gmt, c3.all.v3.0.symbols.gmt, c4.all.v3.0.symbols.gmt, c5.all. v3.0.symbols.gmt downloaded from gseaftp.broadinstitute.org://pub/gsea/gene_sets. The DE genes for each dpi were processed through GSEA against these four reference gene lists. For each DE gene list and reference gene list combination, a directory of results linked together via an index.html webpage was created. The resulting files gsea_report_for_na_pos*.xls and gsea_report_for_na_neg*.xls (*, a wildcard placeholder) are Excel spreadsheets that report reference gene sets and enrichment and significance statistics for those reference gene sets that are enriched in the genes present in the input DE gene list. These GSEA-generated Excel spreadsheet results were parsed into our database to be accessed by our visualization pipeline in Step 4. Additionally, leading edge analyses (http://www.broadinstitute.org/gsea/doc/GSEAUserGuideFrame.html) were performed after the GSEA analysis to identify core genes from a given group of gene sets that were significantly (false discovery rate [FDR] ≤ 0.25) enriched in the genes present in the input DE gene list.
Step 4 – Hive plot visualization of the GSEA data. Hive plots 11 were generated with the linnet (http://www.hiveplot.net/distro/hiveplot-0.02.tgz) application (version 0.02) using as input a custom configuration file (Supplemental data 1) and a data file (Supplemental data 2) generated from a custom perl script, create_hiveplot_input.pl. A GSEA database was created within which two important tables were populated, a Gene_Set_Hiveplot table that related NCBI gene symbols, with Molecular Signature Database collection, gene set, number of genes in the particular gene set, and ordinal position on the central vertical axis. The second table, GSEA_Report_XLS, was populated with the output of the GSEA-generated spreadsheets. Within our existing virus database, the Swine_Genes_Pos_For_Hive_Plot table was populated with data that related GeneID, Gene Symbol, chromosome, and ordinal positions on the chromosome and genome; the Hiveplot_Link_Colors table was populated with data that related tag sequence, dpi, fold change (infected relative to control), and link color. These four tables were required to generate the data files necessary for linnet to create the hive plots presented here. The hive plot input file was derived only from the tags that mapped to swine transcripts with EntrezGene Gene Symbols that were identical to human EntrezGene Gene Symbols.
Results
Clinical Evaluation
The clinical symptoms and gross pathology, previously described, 1 were typical of a systemic infection that resembled expectations based on experimental and natural infections. 12 Briefly, PRV-inoculated pigs developed mild clinical disease, with symptoms such as anorexia, sneezing, increased respiration rates, and dyspnea, beginning from 2 to 3 dpi and resolving by 14 dpi. Control animals did not display clinical signs or gross lung lesions consistent with PRV infection. Pigs inoculated with PRV had an increased (P < 0.05) rectal temperature from 1 to 6 dpi. No significant differences (P > 0.05) were found in daily weight gain between pigs inoculated with PRV (average 0.6 kg/day) and control pigs (average 0.6 kg/day). Gross lung lesions in PRV-inoculated pigs consisted of mainly hilar multifocal areas of purple to red areas of consolidation. Lesions were most pronounced at 3 and 6 dpi. Bacteria typically associated with porcine respiratory disease were not isolated from the broncho-alveolar lavage fluid (BALF) of any of the pigs. Pig serum was negative (mean S/N 1.22) for PRVgB antibody at 0 dpi and positive (mean S/N 0.26) at 14 dpi.
Transcriptome Analysis
For an in-depth assessment of the PRV-infected pig transcriptome, we generated and analyzed eight DE libraries with an average of 11,461,225 tags per library. Linkers and transcript tags with a count of less than two TPM were removed, resulting in a total of 7,286,872 TPM sequences of which 1,927,547 were unique tag sequences. To elucidate the global transcriptional response during infection, pairwise comparisons between infected and control at four time points were calculated (Fig. 2).
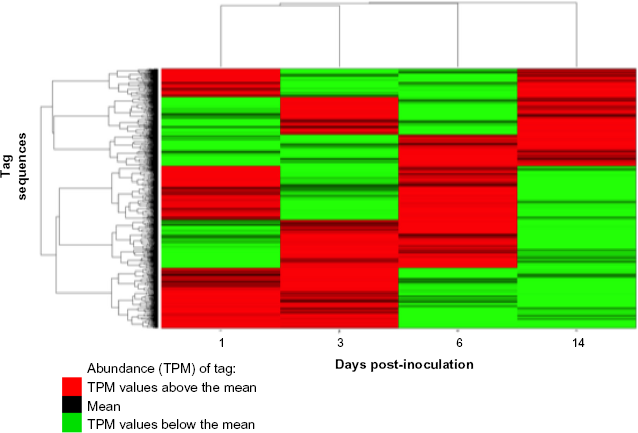
Clustergram of tag abundance with respect to time postinfection.
Cluster Analysis
Volcano plots show that 288 tags at 1 dpi (Fig. 3), 308 tags at 3 dpi, 288 tags at 6 dpi, and 661 tags at 14 dpi were found to be DE (fold change estimates (fc) > 3 (q < 0.001) relative to control tags). A total of 137 tags at 1 dpi are also DE at 3 dpi and of those 137 common tags, 40 transcripts matched to Refseq. The behavior of the DE tags at each time point was followed throughout the course of the experiment using k-means clustering of tags: cluster with respect to correlation distance (Fig. 4). The number of clusters is selected using silhouette plots, choosing the number of clusters that maximizes the silhouette values for all clusters. It is an objective way of determining the number of clusters. Figure 4 shows the little variation in the control tags using the optimum number of clusters for the different time points, where each line represents an individual tag. The number of DE tags changes between the time points (DE threshold set at 2 X fold change with an FDR of q ≤ 0.01).

Volcano plot of 1 dpi tags to define differential expression (DE). Volcano plot for PRV-infected vs control swine at 1 dpi, 288 tags selected. Orange dotted lines correspond to the q-value threshold (q < 0.01) and twofold change from control threshold. Darker blue dots, which exceed both thresholds, are significantly differentially expressed genes, and light blue dots that fail to exceed either threshold are not differentially expressed.

The k-means clustering of DE PRV infected relative to control tags, clustered with respect to correlation distance. The k-means cluster with correlation between the changes in the tag abundance over time as the distance measure. Tags were grouped on the similarity of their behavior of the time evolution of their tag abundance. Each line represents an individual tag.
Gene Set Enrichment Analysis
The updated analysis pipeline contains 7,804 swine RefSeq sequences and 240,420 HarvardGI accessions (SSGI release 14), allowing us to associate tags with transcripts and genes. Virus sequences from Refseq and GenBank allowed us to determine viral tag counts in the libraries. The DE swine genes were processed though the GSEA application,13,14 with the results parsed into a database. GSEA is a computational method that determines whether an a priori defined set of genes shows statistically significant and concordant differences between two biological states (eg, phenotypes). In the present case, the two states are infected vs. control at particular dpi as quantified by the DE transcript phenotype. The a priori defined 6,443 sets of genes were downloaded from the Molecular Signatures Database at the Broad Institute and consisted of four major collections: C2 – curated gene sets (ie, from various sources such as the KEGG, Biocarta, and Reactome databases, publications in PubMed, and knowledge of domain experts), C3 – motif gene sets based on genes known to share a cis-regulatory motif representing known or likely regulatory elements in promoters and 3‘-UTRs, 15 C4 – computational gene sets gleaned from cancer-oriented microarray data, and C5 – GO gene sets of sharing the same GO term. Gene sets refer to the Molecular Signatures Database collections, while gene lists refer to DE gene lists determined in the experiments described. Because the GSEA application processes expression data associated with human gene symbols, our analysis of swine genes was restricted to those with gene symbols that exactly matched their human homolog. The GSEA application involved multiple tests corrected via bootstrap. The primary result of the GSEA is the enrichment score (ES), which reflects the degree to which a gene set is overrepresented at the top of bottom of a ranked list of genes. In the analysis results, the enrichment plot provides a graphical view of the ES for a gene set (Supplementary data 1). The GSEA determined P-values, and FDRs refer to the statistics of association of the gene sets with our gene lists, not with differential expression. GSEA calculates the ES by walking down the ranked list of genes, increasing a running-sum statistic when a gene is in the gene set and decreasing when it is not. The magnitude of the increment depends on the correlation of the gene with the phenotype. The ES is the maximum deviation from zero encountered in walking the list. A positive ES indicates gene set enrichment at the top of the ranked list; a negative ES indicates gene enrichment at the bottom of the ranked list. Enrichment and normalized ES were calculated that provided a measure of the overrepresentation of a particular reference gene set at the top or bottom of the input ranked list of DE genes. Leading edge analyses were performed after the GSEA analysis to identify core genes from a given group of gene sets that were significantly (FDR ≤ 0.25) enriched in the genes present in the input DE gene list. The goal of this analysis is to identify those genes that were present in multiple significantly enriched gene sets (Supplementary data 1). Within a highly ranked gene set, each gene may not necessarily earn a high score, but the leading edge analysis reveals key subsets of genes and uncovers genes that behave similarly yet belong to distinct gene sets and therefore can detect subtle changes in gene expression.
In the leading edge analysis of the C2 curated gene sets, labeled with their experimental reference in Supplemental data 2, we observe that the number of gene sets increases from 1 dpi, with IL1B most common in inflammatory response gene sets 16 followed by OAS1 found in interferon response gene sets, 16 to a maximum at 3 dpi, with ISG15 and OAS2 present in 30 gene sets followed by IFITM1 and IRF7 in 29 gene sets, and decreases at 6 dpi, with IFIT3, IFIT1, OAS2, and ISG15 in the highest number of gene sets, and 14 dpi, with CCNB1 and BIRC1 in the highest number of gene sets that appear to be those related to regulation of cell cycle, cancer, and cell death. Many members of the herpesvirus family have also been shown to manipulate p53 for their own purposes, using specific viral proteins.17–21 The role of cyclin B1 (CCNB1) is to transition the cell from G2 to M phase, but it becomes unregulated when overexpression of cyclin B1 can lead to uncontrolled cell growth by binding to its partner Cdks. This is a consequence of p53, tumor suppressor protein, being inactivated. Regulation of survivin (BIRC1) also seems to be linked to the p53 protein. 22 At 1 dpi, the motif gene set, C3, contained genes originating from the bottom of the gene list, which are downregulated and involved in regulatory roles in neuronal growth, and the most common across the gene sets was Stathmin 2 (STMN2). No C3 gene sets were significantly differently expressed from controls at the other time points. Many of the C4 computational cancer-related gene sets were DE at all time points. Interestingly, at 3 dpi, the genes were all originating from the top of the gene list, that is, upregulated in relation to control, yet those from the module_44_signal gene set, IFIT1 and ISG15 in particular, were found to be downregulated at 6 dpi. The C5 GO gene sets sharing the same GO term showed only two different gene sets, each at 3 and 14 dpi.
Hive Plots
Hive plots were used to visualize the genomewide changes in the swine transcriptome, at each dpi, by the physical genome position of the regulated genes, the genes’ transcript abundance, and by GSEA collection encompassing KEGG pathway, regulatory motifs, and GO classification for each treatment vs control, allowing direct comparison by dpi and virus infection. We chose the layout of the visualization axes to depict that at a given dpi, a particular gene may be simultaneously involved in distinct regulatory motifs, KEGG pathway(s), and/or GO classification. This one-to-many relationship, gene to role, reflects the multiple biological roles of a particular gene in a given environmental history the organism was subjected to. This depiction is an attempt to ascribe data-driven physico-temporal qualities to genes that reveal their roles in PRV infection. A three-axis coordinate system was chosen as depicted in Figure 5, with two axes representing the swine autosomes stacked from the center of the figure radially outward from chromosomes 1-19, X, Y, and MT (mitochondrion) with the axis extending to the right being associated with gene set associations at the top of the experimental gene list (generally speaking, over DE with respect to control) and the left axis associated with the bottom of the gene lists (generally speaking, under DE with respect to control). Each gene set from categories C2-C5 in the Molecular Signatures Database is represented by a position on the center axis that extends vertically from the center toward the bottom of Figure 5. The gene sets were positioned on the axis relative to each other within a given category; those gene sets with more genes were placed above gene sets with fewer genes. The hive plot input file was derived only from tags that mapped to swine transcripts with EntrezGene Gene Symbols that were identical to human EntrezGene Gene Symbols.

Hive plot coordinates to facilitate the visualization of changes in the transcriptome. A three-axis coordinate system was chosen, with two axes representing the swine autosomes stacked from the center of the figure radially outward from chromosomes 1-19, X, Y, and MT (mitochondrion), with the axis extending to the right being associated with gene set associations at the top of the experimental gene list (generally speaking, over DE with respect to control) and the left axis associated with the bottom of the gene lists (generally speaking, under DE with respect to control). Each gene set from categories C2-C5 in the Molecular Signatures Database is represented by a position on the center axis. The gene sets were positioned on the axis relative to each other within a given category; those gene sets with more genes were placed above gene sets with fewer genes.
Hive plots identified regions of the swine genome that encompassed all chromosomes (1-18, X, Y) and the mitochondrial genome, which were DE either negatively or positively and associated with the GSEA gene set indicated by colored lines, where the color is proportional to the fold change with respect to uninfected controls permutated 20% (Fig. 6). Here, we can visualize the DE gene behavior profile across the whole genome at the time points during acute PRV infection. Most noticeably, early in infection, the DE gene sets associated with known swine pathways (C2) and gene ontology (C5) decreased, with the swine motifs (C3) decreasing in expression most significantly at 1 dpi a temporary interval of quiet or lack of activity in differential expression across all gene sets at 6 dpi. We found that transcripts associated with ribosomal function are consistently depressed relative to the control (3, 6, and 14 dpi). The GSEA strategy shows coregulated genes within gene sets. Transcripts of genes sharing common motifs (C3) are DE. Regulatory targets appear to be involved early in the disease process. The hive plots also show that genes with similar expression levels tend to be clustered within the same genomic neighborhoods.

Hive plots of DE genes associated with GSEA gene sets expressed in TBLN of PRV-infected pigs at 1 (
Discussion
We hope that by studying the transcriptome of the host, we could gain insight into the progression of PRV disease. The status of both the controls and PRV-infected swine was verified clinically. We propose a model of the relationship between TBLN gene expression profiles and infection pathology (Fig. 7). Upon infection of the host, in keeping with replication and dissemination by PRV, at 1 dpi we observe induction of the host innate immune response, including the upregulation of interferon responsive genes, inflammatory response genes, and cytokine–cytokine receptor interaction, but downregulation of histone deacetylases and multiple signaling motifs. Expression of proinflammatory cytokines, chemokines, adhesion molecules, inflammatory enzymes and receptors, and adaptive immune response conform to the fever and pneumonia observed during 1 to 6 dpi.
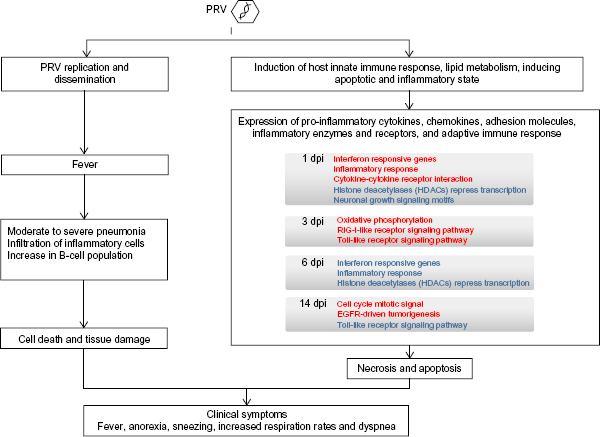
Model of the relationship between TBLN gene expression profiles and PRV infection pathology.
At 6 dpi, there is a significant shift toward downregulation of transcripts, and no transcripts are significantly upregulated in the control (Fig. 6C), including interferon responsive genes and inflammatory response genes that had been upregulated at 1 dpi. By 14 dpi, the pigs have seroconverted to have PRV gB antibody, and we begin to see recovery: lesions are less pronounced. There is a significant differential expression of the greatest number of genes of all the time points at 14 dpi most of which are featured in the computation cancer gene sets and most likely involved in cell death signaling, while cell regrowth and renewal are upregulated with cell cycle mitotic signaling gene sets.
A previous study compared the viral regulation of host cell gene expression during the productive infection by herpes simplex virus-1 (HSV-1) and PRV. 23 Although the two viruses have distinct natural hosts and low DNA sequence homology, they display a high degree of similarity in their viral replication cycles, virion structures, gene organizations, and gene functions. 24 Rat embryonic fibroblasts were used as a common permissive cell type for both viruses. While rats are not a natural host for either PRV or HSV-1, both viruses exhibit similar virulence and pathogenic effects in rodents as in their natural hosts, which may reflect common molecular interfaces of host and viral gene products during infection. Surprisingly, only 32% (498 out of 1,549) of cellular transcripts, representing diverse host functions, were similarly affected by viral infection of HSV-1 and PRV. Most of the alterations in cellular transcript levels occurred late in infection and were unlikely to derive from a general stress response, since more than a third of these late changes are virus specific. Commonly affected genes included oxidative-stress response genes, heat shock genes, and genes involved in the phosphatidylinositol 3-kinase/Akt signaling pathway. Interferon- and interleukin-related genes were altered after HSV-1 but not PRV infection. Further comparison with array data from the transcriptional response of human cells to HSV-1 infection shows only 29 HSV-1-responsive genes shared by rat and human cells, of which only 12 are similarly affected by PRV.
GSEA identifies gene sets consisting of coregulated genes; GO gene sets are based on ontologies and do not necessarily comprise coregulated genes. PRV has been shown to be a pertinent model for the time course transcriptomic study of herpesviruses and its mode of interaction with the host.25–27 Anselmo et al found miRNAs as well as other small regulatory molecules to be DE between PRV-infected and mock-infected porcine dendritic cells 28 and noted that infection caused an intense downregulation of miRNAs, which were well expressed in the mock-infected condition. Similarly, Flori et al found differential expression levels between PRV-infected and mock-infected PK15 cells eight hours PI. The downregulated miR-29b and miR-29a are together or individually connected to the upregulated SMARCE1, HBO1, NKX6-1, HOXA10, HBP1, OTUD4 genes, with highly significant functions in the development and function of the nervous system and in infectious mechanisms. Huang et al detected DE miRNAs in PK-15 cells after PRV infection and found that miR-21 was extremely upregulated and further suggested that the replication of PRV in PK-15 cells could be inhibited by chemokine (C-X-C motif) ligand 10 (CXCL10), also known as interferon-γ inducible protein-10 (IP-10), which was a novel target of miR-21. 26 However, the posttranscriptional regulation of these genes is unclear, and thus far, no data on host-specific genes and regulation of the replication of virus in vivo have been reported.
Multidirectional cooperativity is the norm of signaling networks rather than oversimplistic canonical or noncanonical linear pathways; for example, in Wnt signaling. 29 Recent genome-wide expression studies in several organisms, such as Drosophila, nematode, mouse, human, and Arabidopsis, have shown that genes with similar expression levels are nonrandomly distributed within genomes and tend to cluster within genomic neighborhoods.30,31 This seems to be evidenced in our hive plot visualization. The hive plots revealed aspects of host response that could not be visualized previously. This demonstrated that we cannot rely solely on canonical pathways to inform a transcriptome experiment.
Conclusion
Here, we introduce a new approach for visualizing whole genome similarities and differences between different treatments with hive plots. DE tags (with respect to control) at all time points were mapped to known metabolic, signaling, and other pathways/networks using GSEA. Gene activity was detected across the whole genome. Unfortunately, only 20% of DE tags can be associated with human gene symbols, but the picture will likely change dramatically as annotation improves. We identified groups of genes that are predicted to share the same regulatory elements that are knocked down in a coordinated fashion early in viral infection. The finding of significant cytokine DE was corroborated by the changes in cytokine protein levels in serum and TBLN. 1
Author Contributions
Conceived and designed the experiments: LCM, ELZ, KML. Analyzed the data: DOB, LCM. Wrote the first draft of the manuscript: LCM. Contributed to the writing of the manuscript: LCM, KML. Agreed with manuscript results and conclusions: LCM, DOB, ELZ, KML. Jointly developed the structure and arguments for the paper: LCM. Made critical revisions and approved final version: LCM, KML. All authors reviewed and approved the final manuscript.
Disclaimer
Mention of trade names or commercial products in this article is solely for the purpose of providing specific information and does not imply recommendation or endorsement by the U.S. Department of Agriculture.
Footnotes
Acknowledgments
We would like to thank S. Pohl, D. Adolphson, and M. Baker (ISU) for technical assistance, and S. Ohlendorf for secretarial assistance in the preparation of this manuscript.