
Abstract
The rank product statistic has been widely used to detect differentially expressed genes in replicated microarrays and a one-class setting. The objective of this article is to apply a rank product statistic to approximate the P-value of differential expression in a two-class setting, such as in normal and cancer cells. For this purpose, we introduce a simple statistic that compares the P-values of each class's rank product statistic. Its null distribution is straightforwardly derived using the change-of-variable technique.
Keywords
Introduction
The rank product statistic 1 is a robust nonparametric approach that has been proposed to detect differentially expressed genes in replicated microarrays with just one class or condition. Because the rank product statistic transforms expression intensity into ranks, it has several advantages, including fewer assumptions and easy handling of noisy data or few micro-arrays. 2 Although the rank product statistic has been used mainly for microarrays, it is also applicable to meta-analyses3,4 and proteomics. 5
The rank product statistic ranks genes according to expression intensities within each microarray and calculates the product of these ranks across multiple microarrays. This technique can identify genes that are consistently detected among the most differentially expressed genes in a number of replicated microarrays. However, a very large number of permutations and a substantial amount of computation time are required to accurately calculate the P-value to test for differential expression. Alternatively, Koziol 6 proposed a log-transformed rank product statistic and used a continuous gamma distribution to approximate its P-value. The computation time to calculate the P-value for testing differential expression is negligible compared with that required to calculate the permutations.
To extend the rank product statistic to approximate the P-value of differential expression under a two-class setting, such as in cancer cells and normal cells, Koziol 7 used the difference between two averaged gamma variables. However, calculating the null density of the difference is mathematically complicated. In contrast, this article proposes a simple variable for comparing the P-values of each class's log-transformed rank product statistic and describes its null distribution, which is easily derived by a change-of-variable technique.
Background of One-Class Rank Product Statistic
Assume that we have m replicate microarrays representing one class, with each microarray measuring expression of n genes. For each microarray j (j = 1,…, m), Koziol
6
ranked the expression levels X1j,…,Xnj, and denoted Rij. = rank(Xij) in a way such that the most highly expressed gene is assigned rank 1 and the least expressed gene is assigned rank n, then Rij. {1,…,n}. For each gene i, we have a rank tuple of {Ri1,…, Rim}. The original rank product statistic for gene i is

To calculate the P-value for the test that gene i is differentially expressed, RPi is compared with its permutation distribution under the null hypothesis that Rij for i = 1,.,n are exchangeable within each microarray j. 1 However, to accurately approximate the distribution, a very large number of permutations is required, which becomes very time-consuming computationally. Thus, a simpler approximation approach is needed to calculate the P-value of RPi.
Log-Transformed Rank Product Statistic
An individual P-value given by Rij/(n + 1) is approximately uniformly distributed on the unit interval (0, 1), with the approximation improving as n (the number of genes) increases. If Rij/(n + 1) is continuously uniform on (0, 1), the transformation of -2ln(Rij/(n + 1)) has a chi-squared distribution with two degrees of freedom, denoted as X 2 (2). In contrast, Koziol 6 used the transformation -ln(Rij/(n + 1)), which has an exponential density Exp(1). Chi-squared tables are readily available, so the advantages of chi-squared favor the approach proposed here.
We can combine individual chi-squared variables as follows

Let (ri1,…,rim) and rpi =

When (ri1,…,rim) is small, rpi and its P-value are also small, indicating that gene i is differentially expressed.
a New Statistic for Analyzing Two Classes
Suppose we extend the analyses to two classes, with m1 independent microarrays in class 1 and m2 independent microarrays in class 2. Each microarray measures n genes. Going forward, for simplicity, the i gene label is omitted. Let
Let X1 and X2 be
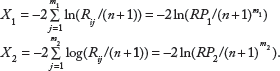
Note that the two independent random variables X1 and X2 have X 2 (2m1) and X 2 (2m2), respectively, under the null hypothesis that Rij .for i = 1,…,n are exchangeable within each microarray j.
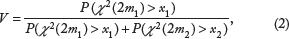
To calculate the P-value of differential expression of gene i under a two-class setting, we define a new statistic
The distributions of P(X
2
(2m1) > x1) and P(X
2
(2m2) > x2) are uniform (0, 1) under the null hypothesis. Then, the density of V is

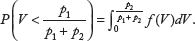
The proof is presented in the Appendix. The P-value for testing H0: class 1 = class 2 vs. Ha: class 1 > class 2 can be obtained by

Similarly, the P-value for testing H0: class 1 = class 2 vs. Ha: class 1 < class 2 can be obtained by
Numerical Examples
Simulation study
We evaluated the performance of the proposed statistic V in Equation (2) by comparing its specificity (or 1 false-positive rate) and sensitivity (or power) in detecting differential expression to the Wilcoxon rank-sum statistic, which is widely used for nonparametrical testing to calculate the P-value of differential expression under a two-class setting. For the following specifications, we conducted 1,000 simulation experiments to assess the specificity and sensitivity of the statistic.
To assess the specificity of the proposed statistic, we simulated 10,000 genes such that the gene expression in 40 microarrays for each gene was simulated independently from a standard normal distribution, where the first 20 samples (m1 = 20) were the control group and the second 20 were (m2 = 20) the treatment group. This specification represents a situation in which no genes are differentially expressed. The false-positive rate was then calculated as follows: the number of genes found to be differentially expressed at nominal level α were counted and divided by 10,000 (the number of genes).
Table 1 presents the false-positive rates of the proposed statistic for various α, m1, and m2. As can be seen from the table, the statistic maintained appropriate α-levels.
False-positive rates of the proposed statistic for various nominal α-levels and numbers of samples, where m1 and m2 are the sample numbers of the control group and the treatment group, respectively.

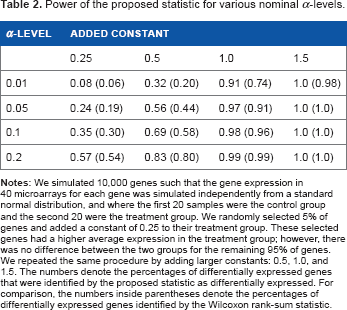
To assess the power of the proposed statistic, 10,000 genes were simulated such that the gene expression for each gene in 40 microarrays was simulated independently from a standard normal distribution and where the first 20 samples were the control group and the second 20 were the treatment group. Next, 5% of genes were randomly selected, and a constant of 0.25 was added to their treatment group. These selected genes had a higher average expression in the treatment group; however, there was no difference between the two groups for the remaining 95% genes. We repeated the same procedure by adding larger constants: 0.5, 1.0, and 1.5. In Table 2, the numbers represent the percentages of the selected 5% differentially expressed genes that were found to be differentially expressed at various significance levels α. The results of the proposed statistic were compared with those obtained from the Wilcoxon rank-sum test statistic. The table clearly shows that the proposed statistic is more powerful than the Wilcoxon statistic and that it was able to accurately detect the differentially expressed genes.
Power of the proposed statistic for various nominal α-levels.
Real data analysis
The widely used data set of Golub et al. 8 came from a study of gene expression in two classes of acute leukemia: acute lymphocytic leukemia (ALL) and acute myelogenous leukemia (AML). Gene expression levels were measured using Affymetrix high-density oligonucleotide microarrays containing 6,817 human genes. Three preprocessing procedures were applied to the gene expression levels and are available at http://www.genome.wi.mit.edu/MPR. These preprocessing procedures included (i) thresholding: floor of 100 and ceiling of 16,000; (ii) filtering: exclusion of genes with (max/min) < 5 or (max-min) < 500, where max and min refer, respectively, to the maximum and minimum levels for a particular gene across mRNA samples; and (iii) log10 transformation. 9 The data were then summarized by a 3,051 X 38 matrix, which is implanted in the multitest package from http://www.bioconductor.org/biocLite.R.
Table 3 presents the top 25 AML significant genes from Equation (3). Eleven genes marked with * are also reported among the top 25 AML-specific genes in Golub et al. We also compared P-values of the proposed statistic to those of the Wilcoxon rank-sum statistic. The proposed P-values were obtained under the overall null hypothesis that the expression levels are exchangeable within each of the independent microarrays. Eleven genes marked with * were also reported among the top 25 AML-specific genes in Golub et al.
Our P-values obtained under the overall null hypothesis that the expression levels are exchangeable within each of the independent microarrays.

were reported among the top 25 AML-specific genes in Golub et al. Our P-values are compared with P-values of Wilcox rank-sum test. Ten genes of the Wilcoxon rank-sum statistic were reported among the top 25 AML-specific genes in Golub et al.
Conclusion
To approximate the P-value of differential expression under a two-class setting, Koziol 7 derived the density of the difference between two averaged gamma variables, which is mathematically complex. In contrast, we provided a simple, nonparametric statistic V in Equation (2). Its null distribution was easily derived by the change-of-variable technique. In the sensitivity analysis presented in the Simulation study section, the proposed statistic was more powerful than the Wilcoxon statistic. In the specificity analysis, it also maintained appropriate α-levels. We developed an R program for this statistic, available at http://home.mju.ac.kr/home/index.action?siteId=tyang.
Koziol 6 noted that the P-values of 1n RPi. in Equation (1) were well approximated by the corresponding continuous gamma approximation (or in our case, chi-squared) over most of the data range; however, the estimation of extremely small P-values was rather imprecise. Specifically, the gamma approximation is conservative in that it tends to overestimate extremely small P-values, leading to false-negative results, which is due to the fact that the discrete rank products take values of 1, 2,…, nm, whereas the continuous chi-squared distribution uses positive, real numbers. 10 Because p1 and p2 in Equation (3) are based on gamma approximation, the P-value of the proposed statistic V may be imprecise, particularly when both p1 and p2 are extremely small.
Author Contributions
Conceived and designed the experiments: TYY. Analyzed the data: TYY. Wrote the first draft of the manuscript: TYY. Contributed to the writing of the manuscript: TYY. Agree with manuscript results and conclusions: TYY. Jointly developed the structure and arguments for the paper: TYY. Made critical revisions and approved final version: TYY. The author reviewed and approved of the final manuscript.
Footnotes
Appendix A. Proof
The density of W = U1/(U1 + U2) with Ui ~ Uniform(0,1) (i = 1,2) is