
Abstract
Advances in next-generation sequencing (NGS) have allowed significant breakthroughs in microbial ecology studies. This has led to the rapid expansion of research in the field and the establishment of “metagenomics”, often defined as the analysis of DNA from microbial communities in environmental samples without prior need for culturing. Many metagenomics statistical/computational tools and databases have been developed in order to allow the exploitation of the huge influx of data. In this review article, we provide an overview of the sequencing technologies and how they are uniquely suited to various types of metagenomic studies. We focus on the currently available bioinformatics techniques, tools, and methodologies for performing each individual step of a typical metagenomic dataset analysis. We also provide future trends in the field with respect to tools and technologies currently under development. Moreover, we discuss data management, distribution, and integration tools that are capable of performing comparative metagenomic analyses of multiple datasets using well-established databases, as well as commonly used annotation standards.
Introduction
The advent of next-generation sequencing (NGS) or high-throughput sequencing has revolutionized the field of microbial ecology and brought classical environmental studies to another level. This type of cutting-edge technology has led to the establishment of the field of “metagenomics”, defined as the direct genetic analysis of genomes contained within an environmental sample without the prior need for cultivating clonal cultures. Initially, the term was only used for functional and sequence-based analysis of the collective microbial genomes contained in an environmental sample, 1 but currently it is also widely applied to studies performing polymerase chain reaction (PCR) amplification of certain genes of interest. The former can be referred to as “full shotgun metagenomics”, 2 and the latter as “marker gene amplification metagenomics” (ie, 16S ribosomal RNA gene) or “meta-genetics”. 3
Such methodologies allow a much faster and elaborative genomic/genetic profile generation of an environmental sample at a very acceptable cost. Full shotgun metagenomics has the capacity to fully sequence the majority of available genomes within an environmental sample (or community). This creates a community biodiversity profile that can be further associated with functional composition analysis of known and unknown organism lineages (ie, genera or taxa). 4 Shotgun metagenomics has evolved to address the questions of who is present in an environmental community, what they are doing (function-wise), and how these microorganisms interact to sustain a balanced ecological niche. It further provides unlimited access to functional gene composition information derived from microbial communities inhabiting practical ecosystems.
Marker gene metagenomics is a fast and gritty way to obtain a community/taxonomic distribution profile or fingerprint using PCR amplification and sequencing of evolutionarily conserved marker genes, such as the 16S rRNA gene. 5 This taxonomic distribution can subsequently be associated with environmental data (metadata) derived from the sampling site under investigation.
Several types of ecosystems have been studied so far using metagenomics, including extreme environments such as areas of volcanism6–9 or other areas of extreme temperature,10,11 alkalinity, 12 acidity,13,14 low oxygen,15,16 and high heavy-metal composition.17,18 This invaluable resource provides an infinite capacity for bioprospecting and allows the discovery of novel enzymes capable of catalyzing reactions of biotechnological commercialization. 19
The first metagenomic studies were focused on low-diversity environments, such as an acid mine drainage, 20 human gut microbiome, 21 and water samples from the Sargasso Sea, 22 mainly due to the unavailability of both high-throughput sequencing technologies at that time and relevant software for the scaffolds’ assembly. As more and more researchers entered this new field of study, the need for powerful tools and software became apparent and therefore led to the creation of several such tools.
Sequencing Technologies
Two commonly used NGS technologies utilized to date are the 454 Life Sciences and the Illumina systems, with the ratio of usage shifting in favor of the latter recently. Both technologies have been widely used in metagenomic studies, and hence it is important to briefly describe their advantages and disadvantages with respect to the sequencing of metagenomics samples.
The 454 pyrosequencer was the first next-generation sequencer to achieve commercial introduction in 2004. 23 Its chemistry relies on the immobilization of DNA fragments on DNA-capture beads in a water-oil emulsion and then using PCR to amplify the fixed fragments. The beads are placed on a PicoTiterPlate (a fiber-optic chip). DNA polymerase is also packed in the plate, and pyrosequencing is performed.24,25 Its main difference from the classic Sanger sequencing is that pyrosequencing relies on the detection of pyrophosphate release on nucleotide incorporation rather than chain termination with dideoxynucleotides. The release of pyrophosphate is conveyed into light using enzyme reactions, which is then converted into actual sequence information. 23
In the initial years of high-throughput sequencing, scientists embraced the new technology and hence discovered the existence of the “rare biosphere”. 26 However, in many cases the apparent assignment of a microbial operational taxonomic unit (OTU) was in fact an attribute of sequencing errors, which caused an overinflation of the diversity estimates. 27 Noise generated by this 454 pyrosequencing technology affected different aspects of metagenomic data analysis and led to biased results. 28
PCR errors may lead to replicate sequence artifacts, which can cause overestimation of species abundance and functional gene abundance in 16S rRNA and full shotgun metagenom-ics, respectively. PCR can also generate noise in the form of single base pair errors (ie, substitutions, deletions) that can cause frame shifts for protein coding genes in shotgun meta-genomics. Moreover, PCR chimeras (sequences generated by undesired end-joining of two or more true sequences) can also affect 16S metagenomics results with respect to species distribution. 29 Sequencing errors can also occur due to the actual chemistry underlining the technology. For example, there is an inherent difficulty in clearly identifying the intensity of 454 pyrosequencing-generated flowgrams. This task becomes even more difficult during the sequencing of homopolymers. 30 The 454 pyrosequencing technology can generate reads up to 1,000 bp in length and ~1,000,000 reads per run. The relatively long read length generated by this technology (in comparison to other sequencing technologies) allows a significantly less error-prone assembly in shotgun metagenomics and permits greater annotation accuracy.31,32 The cost of sequencing using 454 pyrosequencing technology is estimated at around US$20 per Mb, but it has a relatively low coverage of 0.7 GB per sequencing run. With respect to pyrosequencing, <20 ng of DNA is sufficient for sequencing single-end libraries, although paired-end sequencing may require larger quantities of DNA.
Although 454 will eventually stop being supported by Life Sciences, still one should take into account that there is a large number of existing unpublished datasets that have been generated via this technology. Therefore, it is important to include it in this review and compare it with the other sequencing services that have become more popular over the last years, namely Illumina.
Illumina dye sequencing by synthesis begins with the attachment of DNA molecules to primers on a slide, followed by amplification of that DNA to produce local colonies. 23 This generation of “DNA clusters” is accompanied by the addition of fluorescently labeled, reversible terminator bases (adenine, cytosine, guanine, and thymine) attached with a blocking group. 33 The four bases then compete for binding sites on the template DNA to be sequenced, and the nonin-corporated molecules are washed away. After each synthesis cycle, a laser is used to excite the dyes, and a high-resolution scan of the incorporated base is made. A chemical deblocking step ensures the removal of the 3’ terminal blocking group and the dye in a single step. The process is repeated until the full DNA molecule is sequenced. Illumina has a variety of sequencing instruments dedicated to different applications. MiSeq, for example, has an output of 15 GB and 25 million sequencing reads of 300 bp in length; clustered fragments can be sequenced from both ends (paired-end sequencing), which can be merged so that 600 bp reads can be obtained. HiSeq2500 has a much greater output (1,000 GB per run) but offers 125 bp reads. Illumina yields involve a much lower cost (~US$0.50 per Mb), but the run time is longer than that for 454 pyrosequencing. Currently, this feature is being addressed by the MiSeq Illumina machine, which has been developed in order to run smaller jobs at a much faster rate with relatively high throughput. Illumina allows sample preparation sizes of <20 ng DNA (similar to 454 pyrosequencing). The shorter read length produced by Illumina may increase errors during assembly and, subsequently, the annotation inaccuracies during shotgun metagenomics data analysis. 34 In contrast, when analyzing 16S metagenomics data, this technology obviates the need for time-consuming noise removal algorithms required for pyrosequencing and makes analysis less error-prone. 35 The greater coverage/yield generally offered by Illumina allows significant decrease of systematic errors. This advantage and the low cost are the delineating factors that have turned Illumina into the preferred high-throughput sequencing technology for metagenomics studies.
Additional sequencing technologies are available and can potentially be used for metagenomic studies. These include the Applied Biosystems SOLiD 5500 W Series sequencer, which offers higher coverage than 454 pyrosequencing but lower than Illumina (~120 GB per run). It allows fragment or mate-paired sequencing; however, it can only guarantee a low error rate for sequencing reads of maximum 50 bp in length. 36 This reduces the possibility of generating a reliable and usable de novo assembly for shotgun metagenomics; but, on the other hand, this technology performs very well when utilizing a reference genome for mapping or assembly of reads. However, using the Exact Call Chemistry (ECC) module, the SOLiD system offers to boost the accuracy of its ligation-based sequencing.
An emerging sequencing technology that may have high impact on the fields of genomics and metagenomics was recently developed by Pacific Biosciences (PacBio). 36 This technology uses single-molecule real-time (SMRT) sequencing, which is a parallelized single-molecule DNA sequencing by synthesis. SMRT sequencing utilizes the zero-mode waveguide (ZMW), whereby a single DNA polymerase enzyme is fixed to the bottom of a ZMW with a single molecule of DNA as a template. The ZMW is a structure that creates an illuminated observation volume that is small enough to allow the observation of a single nucleotide of DNA (also known as a base) being incorporated by DNA polymerase. Each of the four DNA bases is attached to one of four different fluorescent dyes. When a nucleotide is incorporated by the DNA polymerase, the fluorescent tag is cleaved off, which diffuses out of the observation area of the ZMW where its fluorescence is no longer observable. A detector detects the fluorescent signal of the nucleotide incorporation, and the base call is made according to the corresponding fluorescence of the dye. PacBio provides much longer read lengths (~10,000 bp) compared to the aforementioned technologies, thus having obvious advantages when addressing issues of annotation and assembly for shotgun metagenomics. PacBio technology uses a process called strobing to perform paired-end read sequencing. Despite the high read length of PacBio, this technology is limited by high error rates and low coverage (albeit at higher throughput than Sanger sequencing).
In addition to the aforementioned technologies, which are based on optics, technologies such as Ion Torrent's semiconductor sequencing benchtop sequencer and Ion Proton are now coming into play. These technologies are based on the use of proton emission during polymerization of DNA in order to detect nucleotide incorporation. This system promises read lengths of > 200 bp and relatively high throughput, on the order of magnitude achieved by 454 Life Sciences systems. Additionally, it offers higher quality than 454, especially when sequencing homopolymers, but at a similar cost (about US$23 per Mb for the Ion Torrent PGM -314 Chip). Looking into the future, and given that 454 will eventually stop being supported by Life Sciences, it is very likely that former users of the 454 pyrosequencing will switch to Ion Torrent sequencing chemistry, due to the similarities of both (eg, emulsion PCR step) and the significant the advantages of the latter.
An even more cutting-edge technology is currently under development by Oxford Nanopore technologies, which is developing “strand sequencing”, a method of DNA analysis that could potentially sequence completely intact DNA strands/polymers passed through a protein nanopore. This obviates the need for shotgun sequencing and aims to revolutionize the sequencing industry in the future. Oxford Nanopore intends to commercialize this technology with the Company's GridION™ and MinION™ systems. For meta-genomics, this technology can have obvious advantages, as it will eliminate erroneous sequencing caused by shotgun metagenomics and exclude the need for the error-prone assembly step during data analysis (for details, see later). However, nanopore sequencing is at the moment noncommercialized (offered only through the MinION™ Access Program) and is still being optimized on case-by-case basis using specific template and sequencing needs.
Another example of an innovative and very promising technology is the Irys Technology (BioNano Genomics), which uses micro and nanostructures and offers new ways of de novo constructing genome maps. The input is DNA labeled at specific sequence motifs that can be used for imaging and identification in IrysChips. These labeling steps result in a uniquely identifiable, sequence-specific pattern of labels to be used for de novo map assembly or for anchoring sequencing contigs.
Shotgun Metagenomics
Assembly of Shotgun Metagenomics Data
Metagenomics studies are commonly applied to investigate the specific genomes (known as well as unknown, both cultured and uncultured) that are present within an environmental community under study. Moreover, when performing full shotgun metagenomics, the complete sequences of protein coding genes (previously characterized or novel) as well as full operons in the sequenced genomes can offer invaluable functional knowledge about the community. For these reasons, an assembly of shorter reads into genomic contigs and orientation of these into scaffolds is often performed to provide a more compact and concise view of the sequenced community under investigation. Early attempts at metagenomic data assemblies utilized tools initially implemented for single genome data assemblies. They, therefore, fell short when forced to assemble reads into contigs for metagenomic samples. However, assembly tools have significantly evolved since then, and the current line of tools have been modified and specifically designed to assemble samples containing multiple genomes, thereby rendering them much more affective for the task in hand.
The process of assembling shorter reads into contigs can take two different routes: 1) reference-based assembly and 2) de novo assembly. The choice of which route to follow depends on the dataset that needs to be analyzed and on the specific needs of each research project. For example, de novo assembly could be, in theory, used even if a reference genome exists, if the computational power allows for it.
Reference-based assembly refers to the use of one or more reference genomes as a “map” in order to create contigs, which can represent genomes or parts of genomes belonging to a specific species or genus. Tools such as Newbler (Roche), MIRA 4, 37 or AMOS, as well as the recent MetaAMOS, 38 are commonly used in metagenomics for performing referenced-based assemblies. These tools are not computationally intensive and perform well when metagenomic samples are derived from extensively studied and researched areas. In such cases, sequences from closely related organism would have already been deposited in online data repositories and databases, allowing them to be used as references for the assembly process. Often, assemblies are visually evaluated using genome browser tools such as Artemis. 39 The observation of large gaps in the query genome(s) of the resulting assembly, when comparing to the reference genome(s), can be seen as an indication that perhaps the assembly is incomplete or that the reference genome(s) used are too distantly related to the community under investigation in order to perform optimally.
De novo assembly refers to the generation of assembled contigs using no prior reference to known genome(s). 40 This task is computationally expensive and relies heavily on sophisticated graph theory algorithms, such as de-Bruijn graphs, which were specifically employed to tackle this job. Tools such as EULER, 41 Velvet, 42 SOAP, 43 and Abyss 44 were amongst the first to perform de novo assembly and are still widely used today. They require computers with large amounts of memory and generally long execution times (depending on the size of the dataset). However, these tools were built with the assumption of assembling a single genome and often underperform when used for metagenome assemblies. Problems arise from 1) variation between similar subspecies, 2) genomic sequence similarity between different species, and 3) difference in abundance for species in a sample also affected by different sequencing depths for individual species. These issues introduce kinks (or branches) in the de Bruijn graph, and have to be addressed in order to improve the assembly.
The next generation of assembly tools, such as MetaVelvet and very recently MetaVelvet-SL45,46 and Meta-IDBA, 47 was developed to address these issues. MetaVelvet and Meta-IDBA employ a combined binning (for details on binning, see below) and assembly approach to create more accurate assemblies from datasets containing a mixture of multiple genomes. They make use of k-mer frequencies to detect kinks in the de-Bruijn graph and then use these k-mer thresholds to decompose the graph into subgraphs. These tools further assemble contigs and scaffolds based on the decomposed subgraphs, and thus perform a more efficient grouping/ assembly of contigs, effectively separating those belonging to different species.
The IDBA-UD algorithm 48 was recently developed to additionally address the issue of metagenomic sequencing technologies with uneven sequencing depths. It makes use of multiple depth-relative k-mer thresholds to remove erroneous k-mers in both low-depth and high-depth regions. Comparison of the performances of these tools is often performed using the N50 length score, which is defined as “the length for which the collection of all contigs of that length, or longer, contains at least half of the total of the lengths of the contigs in the assembly”.49,50 A recent comparison of the latest line of assembly tools shows that IDBA-UD can reconstruct longer contigs with higher accuracy. 48 However, there is still much room for the improvement of metagenomic assembly algorithms in order for them to conceptually capture the task in hand.
Binning Tools for Metagenomes
Binning is the process of grouping (binning) reads or contigs into individual genomes and assigning the groups to specific species, subspecies, or genus. Binning methods can be characterized in two different ways depending on the information used to group the sequences in hand: 1) Composition-based binning is based on the observation that individual genomes have a unique distribution of k-mer sequences (also denoted as genomic signatures). By making use of this conserved species-specific nucleotide composition, these methods are capable of grouping sequences into their respective genomes. 2) Similarity- or homology-based binning refers to the process of using alignment algorithms such as BLAST or profile hidden Markov Models (pHMMs) to obtain similarity information about specific sequences/genes from publically available databases (eg, NCBI's nonredundant database - nr or PFAM). Thereafter, sequences are binned according to their assigned taxonomic information.
Available composition-based binning algorithms are included in tools such as TETRA, 51 S-GSOM,52,53 Phylopythia 54 and its successor PhylopythiaS, 55 TACAO, 56 PCAHIER, 57 ESOM,58,59 and ClaMS, 60 while examples of purely similarity-based binning software include tools such as CARMA, 61 MetaPhyler, 62 and SOrt-ITEMS. 63 Some tools employ similarity-based binning algorithms in their metagenomics analysis pipelines. Examples of such tools are IMG/MER 4, 64 MG-RAST,65,66 and MEGAN67–69 and will be described in more detail below.
Certain binning tools employ a hybrid approach using both composition and similarity-based information to group sequences. Some examples of such tools are PhymmBL 70 and MetaCluster.71,72 More innovative binning approaches include co-abundance gene segregation across a series of metagenomic samples, thus facilitating the assembly of microbial genomes without the need for reference sequences. 73 This new method promises to overcome the usual computational challenges of other binning tools and has been tested for a human gut microbiome.
Binning tools can further be characterized with respect to the type of algorithm they employ such as 1) ab initio unsupervised classifiers and 2) supervised/training-based classifiers. 60 Unsupervised binning refers to the process of using pre-existing bins derived from genomic sequences to classify a given dataset without user supervision. In contrast, supervised binning allows user interference and supervision in the training process per se. More particularly, the user may specify the type of sequences that will be used to train each bin and, furthermore, select sequences from known taxonomic lineages to use while training the classifier. Sophisticated algorithms such as support vector machines (PhylopythiaS), hidden Markov models (PhymmBL, TETRA), as well as self-organizing maps (ESOMs) have been used in binning algorithms. However, tools such as PhylopythiaS and TETRA allow little user intervention, while ClaMS and ESOM provide a more supervised training approach that can be fine-tuned to allow optimal classification for the specific dataset under consideration.
There are certain aspects that one must take into consideration when performing the binning of metagenomic sequences. Composition-based binning using genomic signature has its drawbacks, especially when performed on short reads (ie, 150 bps). Given that all possible tetranucleotide combinations amount to 256, it is unlikely to extract sufficient information to reliably assign a taxonomic rank to a specific bin using short reads. Therefore, it is common practice to perform composition-based binning on assembled datasets. This way, longer contigs can provide the required k-mer distribution information, which will allow effective binning and taxonomic assignment. 31 Observation of a taxonomic marker sequence (ie, 16S rRNA gene) within the bins can further facilitate reliable taxonomic assignment for the respective bin. Similarity-based binning also has its disadvantages. Although capable of binning reads of short length, it fails to do so accurately when the metagenome under consideration consists of numerous closely related species. This may cause assignment of closely related sequences to the same reference genome, perhaps at a higher taxonomic level (ie, order or class), thereby generating bins containing a mixture of genomes. Therefore, optimal binning results are expected to be attained when combining both composition- and similarity-based approaches as adopted by hybrid tools such as PhymmBL 70 and MetaCluster.71,72
Annotation of Metagenomics Sequences
Annotation of metagenomes is specifically designed to work with mixtures of genomes and contigs of varying length. Initially, a series of preprocessing steps prepare the reads for annotation. These include 1) Trimming of low-quality reads using platform-specific tools such as the FASTX-Toolkit. 74 Additionally, FastQC 67 can provide summary statistics for FASTQ files. Both have been recently integrated into the Galaxy platform.75–77 SolexaQA 78 and Lucy 279 are also used for FASTQ files. Most of these tools make use of Phred or Q quality scores,80,81 the thresholds of which depend on sequencing technology; 2) Masking of low-complexity reads performed using tools such as DUST 82 ; 3) A de-replication step that removes sequences that are more than 95% identical; 4) A screening step performed by some tools (ie, MG-RAST) in which the pipeline provides the option of removing reads that are near-exact matches to the genomes of a handful of model organisms, including fly, mouse, cow, and human. This is done using mapping tools such as Bowtie 2. 83
The next main stage of the annotation pipeline is the identification of genes within the reads/assembled contig, a process often denoted as “gene calling”. 64 Genes are labeled as coding DNA sequences (CDSs) and noncoding RNA genes, and certain annotation pipelines (eg, IMG/MER) also predict for regulatory elements such as clustered regularly interspaced short palindromic repeats (CRISPRs).
CDSs are identified using a number of tools including MetaGeneMark, 84 Metagene, 85 Prodigal, 86 Orphelia, 87 and FragGeneScan, 88 all of which utilize ab initio gene prediction algorithms. Often, annotation pipelines use an intersection of these tools to obtain a more informative prediction of the protein coding genes. Gene prediction tools utilize codon information (ie, start codon - AUG) to identify potential open reading frames and hence label sequences as coding or non-coding. Most tools can be trained by using the desired training sets. For example, FragGeneScan is trained for prokaryotic genomes only, and is used by IMG/MER and MG RAST as well as EBI Metagenomics. It is believed to be one of the most accurate gene-prediction tools currently available. However, like most of these tools, it is expected to have an average prediction accuracy of ~65%-70%, resulting in multiple genes that are missed altogether. 88
CRISPR elements are identified by programs such as CRT 89 and PILER-CR. 90 IMG/MER uses a concatenation of results obtained from both these programs, retaining the longest element prediction in case of overlap.
Noncoding RNAs such as tRNAs are predicted using programs like tRNAscan,91,92 ribosomal RNA (rRNA) genes (5s, 16s, and 23s) are predicted using internally developed rRNA models for IMG/MER, and MG-RAST uses similarity to compare three known databases (SILVA, 93 Greengenes, 94 and the Ribosomal Database Project-RDP95,96) to predict rRNA genes.
The next stage of the annotation pipeline involves functional assignment to the predicted protein coding genes. This is currently achieved by homology-based searches of query sequences against databases containing known functional and/or taxonomic information. Due to the large size of metagenomic datasets, this stage is often very expensive computationally and highly automated. BLAST or other sequence-similarity-based algorithms 97 often run on high performance computer clusters. Often, multithreading or other parallel programming approaches are used to divide jobs in multiple central/graphic processing units (CPUs/GPUs). This reduces the running time complexity and significantly speeds up querying execution time.
Some widely used data repositories to obtain annotation for metagenomic datasets include functional annotation databases such as KEGG,98,99 SEED, 100 eggNOG, 101 COG/KOG, 102 as well as protein domain databases such as PFAM103,104 and TIGRFAM. 105 Often, annotation pipelines make use of multiple databases or composite protein domain databases such as Interpro 106 (see EBI Metagenomics) in order to obtain a more collective, cumulative biological functional annotation.
IMG/MER utilizes HMMsearch (profile HMMs) to associate genes with PFAM, and genes are further annotated using COGs. Database of position-specific scoring matrix (PSSMs) for COGs are downloaded from NCBI and are used to annotate protein sequences. Moreover, genes are labeled using KEGG-associated KO terms, EC numbers, and assigned phylogeny using similarity searches. With a large set of genomes in its public repositories, IMG/MER can exploit its own resources, using them as reference nonredundant databases from which it obtains additional functional annotation.
MG-RAST utilizes many of the databases described above for annotation mapping as well as the NCBI taxonomy. The primary data product displayed to the user by MG-RAST is in the form of abundance profiles, and taxonomic information is projected against this data.
Both IMG/MER and MG-RAST are widely used data management repositories and comparative genomics environments. They are fully automated pipelines that provide quality control, gene prediction, and functional annotation. Both tools support user download of data products generated, as well as optional sharing and publishing within the respective portals. However, there are important differences between MG-RAST and IMG/MER that are relevant to the way MG-RAST calculates abundance profiles.
MG-RAST predicts all genes in the metagenome, and then identifies the best homologs of those genes in the isolate genomes using a tool called BLAT (BLAST-like alignment tool). 107 BLAT misses similarities below 70% identity, so many strong hits to other genes are missed. After the best hits to genes from an isolated genome are identified, all subsequent analysis is done using the genes of the isolate genomes, not the genes of the metagenome at hand. This creates a lot of limitations due to the fact that the analysis is not performed on the original genes of the metagenome but on the “proxy” genes to the isolated genomes instead. The advantage of this method is its speed; the only computationally intensive step is to find the best hits of the metagenomes against the isolates. Once this is done, all other comparisons are already preexisting. The other major advantage is that the MG-RAST database does not grow in size, as is the case with the IMG/MER database.
IMG/MER also begins with prediction of all genes from the metagenome, but then runs all the computations on those genes rather than on their proxies. This allows the identification of PFAM hits (which is not supported in MG-RAST)and provides much more detailed functional information compared to COGS, which is the only protein families database used in MG-RAST. The major bottleneck for IMG/MER is the exponential growth of the gene number, which is not an issue for MG-RAST since the metagenome genes are not kept for analysis. It is, however, important to use PFAM for functional analysis because by comparing the number of genes from any metagenome that go into COG or PFAM clusters, the second provides significantly higher coverage and therefore allows a much deeper analysis. Another major advantage of IMG/MER is that, since the tool keeps the original metagenome genes, it also keeps the original contigs, which provides synteny information. Therefore, it is far more suitable if one is interested in identifying novel biosynthetic gene clusters (BGCs) in the metagenomes, a type of analysis that may be less viable using MG-RAST. The prediction of BGCs from metagenomics data is recently gaining a great deal of interest due to their potential in biotechnological applications. The possibility to engineer BGCs for the production of secondary metabolites with improved properties, known for their use in anticancer drugs and antibiotics, offers limitless potential for bioprospecting.
The EBI Metagenomics service 108 is a newly developed web-based portal that uses metadata structures and formats that comply with the Genomic Standards Consortium (GSC) guidelines. Moreover, a novel data scheme currently being hosted by the EBI-EMBL is being adopted by the EBI Metagenomics service. This is known as the European Nucleotide Archive (ENA) 109 data schema and aims to integrate data derived from sequencing technologies under a consensus, mutually accepted standard. EBI Metagenomics offers a dual shotgun and marker gene analysis service. It allows the extraction of rRNA data from shotgun metagenomic data using tools such as rRNASelector 110 for concurrent marker metagenomic analysis. It therefore supports additional 16S rRNA-based analysis tools such as Qiime 111 (see section on Marker Gene Metagenomics) for the efficient taxonomic assignment of these sequences. For functional analysis and annotation of CDS sequences, EBI Metagenomics uses FragGeneScan to obtain protein coding sequences and thereafter utilizes databases such as Interpro, which is a composite, cumulative system comprised of multiple databases of protein families, and allows for protein domain prediction and functional assignment. EBI Metagenomics provides data archiving via ENA and provides unique accession numbers for submitted datasets. Archiving policies require the data to be made public; however, there is a 2-year period (upon submission) during which the data is kept private pending user publication of analysis results.
CAMERA 112 is another online cloud computing service that provides hosted software tools and a high-performance computing infrastructure for the analysis of metagenomic data. One advantage of CAMERA is that it allows greater user intervention and flexibility during the analysis process. However, this means that users must have expertise, knowledge, and hands-on experience in metagenomic date analysis per se, in order to ensure correct execution of the pipeline and accuracy of results. Moreover, in order to perform comparative metagenomics using CAMERA, the datasets in hand must be traversed through the CAMERA pipeline, thus making integration of data from different resources more computationally demanding. MEGAN 567 is yet another tool that performs analysis of metagenomic data and offers a wide range of visualization tools for metagenomic annotation results. It supports multiple visualization schemes including functional or taxonomic dendrograms, tag clouds, bar charts, and Krona taxonomic plots, 113 that allow hierarchical data to be explored in the form of a zoomable pie chart.
Marker Gene Metagenomics
It is widely accepted that sequencing of the 16S rRNA gene reflects eubacterial evolution. 114 Since the introduction of SSU rDNA-based molecular techniques,115–117 the study of microbial diversity in natural environments has advanced significantly. In addition, pyrosequencing24,25 of the 16S rRNA gene has been widely applied in the field of microbial ecology118–120 and has resulted in a great number of sequences deposited in relevant databases, thus enhancing the value of 16S as the “gold standard” in microbial ecology. While the 16S rRNA gene fragment, containing one or more variable regions, is the preferred target marker gene for bacteria and archaea, this is not the case for fungi and eukaryotes where the preferred marker genes are the internal transcribed spacer (ITS) and 18S rRNA gene, respectively.
Taxonomic analysis for prokaryotes (ie, bacteria and archaea) is regularly performed using 16S data derived from varying sequencing technologies (ie, 454 pyrosequencing as well as Illumina, Solid and Ion Torrent), and, for the purposes of this review, we will list the relevant software to allow analysis for most sequencing technologies. Commonly used tools for 16S data analysis and denoising include QIIME, 111 Mothur, 121 SILVAngs, 93 MEGAN, 67 and AmpliconNoise. 122 Despite the vast availability of algorithms and software for analysis of 16S metagenomics datasets, QIIME seems to be established as the “gold standard”. 123
It is important to be aware of certain aspects of the terminology required for the efficient analysis of 16S metagenomics data. These include the following: 1) Amplicon –- a DNA fragment that is amplified by PCR, eg, one or more 16S rRNA variable regions, or other marker genes. Most researchers will make use of standard PCR primers; 2) OTU –- species distinction in microbiology, typically using rRNA and a percentage of similarity threshold for classifying microbes within the same, or different, OTUs; 3) Barcode –- a short DNA sequence that is added to each read during amplification and that is specific for a given sample. This allows samples to be mixed (multiplexed) to reduce sequencing cost. During analysis, sequences need to be demultiplexed, ie, separated by sample.
Analysis usually requires a reference database that is searched to find the closest match to an OTU from which a taxonomic lineage is inferred. Some widely utilized databases include Greengenes, 94 (16S), Ribosomal Database Project,95,96,124 (16S), Silva93,125 (16S + 18S), and Unite 126 (ITS). These databases are less suitable for certain groups of organisms, such as protists and viruses, which are extremely diverse and for which considerably less sequence information is available compared to bacteria.
Denoising
Denoising is important for 16S metagenomic data analysis, and it is platform-specific; ie, certain platforms (eg, Illumina) require less denoising than others (eg, pyrosequencing). For example, denoising of 454 pyrosequencing data, despite being computationally expensive, is necessary due to intrinsic errors generated from pyrosequencing that can give rise to erroneous OTUs. A procedure called “flowgram clustering” removes problematic reads and increases the accuracy of the taxonomic analysis. Several denoising algorithms have been developed so far,127–131 but for the purpose of this review three of them will be analyzed in detail.
Denoising is performed very efficiently by Amplicon-Noise, 122 a tool that uses the following basic denoising steps: 1) Filtering of noisy reads: reads are truncated based on the appearance of low signal intensities; 2) Removing pyrosequencing noise: distance between the flowgrams is defined and true sequences and their frequencies are inferred by an expectation-maximization (EM) algorithm; 3) Removing PCR noise: the same ideas are used for removing PCR errors; 4) Chimera identification and removal: for each sequence, exact pairwise alignments are performed to all sequences with equal or greater abundance, which is the set of possible parents. Although a considerable number of sequences is lost during the denoising process, it results in high-quality sequences 132 ; however, there has been some debate on the level of stringency required to achieve such high quality. 133
A very popular software for the analysis of microbial communities is QIIME. Initially QIIME was implemented for use of 454 pyrosequencing datasets only, ie, using sff (Standard Flowgram Format) files, but currently QIIME has been modified to accept the fastq file format, thereby making the analysis of Illumina datasets possible. The QIIME developers provide users with extensive online tutorials for several workflows, and, moreover, QIIME is available as an open-source software package mostly implemented using the programming language PYTHON.
Another widely used software for the analysis of microbial communities is Mothur. It was created from the combination of pre-existing software, such as DOTUR, 134 SONS, 135 and Treeclimber, 136 but, due to the community support it has received, currently it incorporates many more algorithms, thus providing the user with a variety of choices.
More recently, a web-based application called SILVAngs 93 was developed, which provides a fully automated analysis pipeline for data derived from rRNA marker gene amplicon sequencing. The analysis workflow is based on 1) Alignment of reads, 2) Quality assessment and filtering of reads, 3) Dereplication, whereby identical sequences are filtered out to avoid overestimation, 4) Clustering and OTU picking using a priori defined thresholds, and 5) Taxonomic assignment of OTUs using the SILVA rDNA database.
The choice of which denoising algorithm to use is largely depends on the user. Once a choice is made, the user should also consider whether to deviate from the default parameters. Parameter adjustment is related to the dataset produced, ie, which specific 16S rRNA region was sequenced and which technology was used to perform the actual sequencing. In addition, it has been suggested that use of different denoising methods can produce significantly different outcomes, 137 which should be taken into careful consideration when comparing studies that have utilized different algorithms for data analysis.
OTU Clustering, Picking, and Taxonomic Assignment
After the demultiplexing of the dataset, ie, the assignment of reads to samples using barcode information, the next step is OTU picking. For bacteria/archaea, it is accepted that OTUs of similarity greater than 97% correspond to the same species, but also other dissimilarity cutoffs can be employed, if needed for the downstream analyses. There are numerous OTU picking strategies: 1) De novo is used if amplicons overlap and if a reference sequence collection is not available. It clusters all reads without using a reference and is quite expensive computationally, hence not very suitable for very large datasets. 2) Closed-reference is used if amplicons do not overlap and if a reference sequence collection is available. This approach discards reads that do not hit a reference sequence. 3) Open-reference is used if amplicons overlap and a reference dataset is available. This method clusters reads against a reference dataset, but if the reads do not match the reference, they are consequently clustered de novo. All the aforementioned are incorporated into QIIME. There are also other types of OTU clustering and picking strategies being developed138–141; the most appropriate choice for the downstream analysis will depend on the type of data and the user.
Taxonomic assignment of OTUs can be performed using a variety of algorithms. Currently QIIME supports numerous algorithms, such as BLAST, the RDP classifier, RTAX, Mothur classifier, and uclust, to search for the closest match to an OTU from which a taxonomic lineage is inferred. This requires reference databases of marker genes. Some commonly utilized databases include Greengenes, 94 (16S), Ribosomal Database Project95,96,124 (16S), Silva93,125 (16S + 18S), and Unite 126 (ITS).
Statistical Analysis and Visualization of Results
QIIME output includes a representation of a taxonomic tree in Newick format, which can be visualized in applications such as FigTree, 142 and a file in Biom (Biological Observation Matrix) format 143 representing OTU tables. This file can be imported into MEGAN for visualization or into any other statistical software requiring matrix-type data. In addition, alpha-diversity analysis (diversity within a sample, eg, Phylogenetic Diversity (PD), Chao, 144 etc.) and beta-diversity analysis (diversity across samples, eg, UniFrac, 145 PCoA), as well as taxonomic composition and phylogenetic analyses, are supported through QIIME. Numerous other tools and software packages exist for performing statistical analysis of metagenomic data. The Primer-E package 146 is commonly utilized by microbial ecologists and allows for multiple multivariate statistical analyses, such as multidimensional scaling (MDS), analysis of similarities (ANOSIM), and hypothesis testing. Recently the R statistical programming language 147 has gained imense popularity and is currently widely used for multivariate statistics. Packages such as vegan, 148 phyloseq, 149 and Bioconductor 150 provide multiple in-built functions and libraries for performing a wide range of statistical analysis required for metagenomic datasets. While it is out of the scope of this review to thoroughly analyze visualization tools for genomic data, readers are encouraged to visit a recent review article. 151
Data Management, Storage, and Sharing
Tools such as IMG/MER, CAMERA, MG-RAST, and EBI metagenomics (which also incorporates QIIME) provide an integrated environment for analysis, management, storage, and sharing of metagenome projects. This requires that a consensus commonly accepted annotation scheme is designed in order to allow for efficient data exchange, integration, sharing, and visualization between different platforms and to further reduce the need for reprocessing of metagenomic datasets, a task which is very expensive computationally.
The GSC is currently investing heavily toward a widely accepted language that shares ontologies and nomenclatures thereby providing a common standard for exchange of data derived from the analysis of metagenomic projects. Toward this goal, MIMS (Minimum Information about a Metagenome Sequence) and MIMARKS (Minimum Information about a MARKer Sequence) 152 have been devised, providing a scheme of standard languages for metadata annotation.
Conclusions
Tools and databases for metagenomic data analysis are currently well on their way to becoming more and more efficient and elaborate (for an overview of the tools most utilized nowadays for metagenomic data analysis, see Table 1). Technologies offering increased read length, such as PacBio, or new chemistry, such as Irys Technology and Nanopore Sequencing, are beginning to offer new capabilities to the analysis pipelines and aid in many aspects the assembly as well as the concurrent annotation process. Assembly tools such as IDBA-UD are being developed and increasingly improved to address the specific problem of assembling mixtures of genomes as is eminent for metagenomic samples. Databases like GOLD, 153 associated with the IMG/MER portal, can be used as a reference in order to perform validation tests for assembly tools. Moreover, the use of simulated metagenomic datasets has been proposed in order to asses these tools. 154
Tools grouped according to their main functionality.

There has been some controversy within the metagenomics community regarding the actual need for performing assembly on metagenomes. One contention is that using clustering algorithms such as cd-hit155,156 or uclust 97 is sufficient to group similar reads together and thereafter proceed to annotation of these clusters without prior assembly. This clustering approach may allow for more accurate annotation of highly diverse samples containing rare, uncultured genomes that may otherwise be excluded from the assembly process due to their low coverage. One drawback of not performing an assembly may be that complex regulatory elements such as CRISPRs may not be identified successfully. 31
Binning and annotation methods are also constantly being modified and altered to specifically address metagenomic analysis pipelines. A significant improvement of these processes will be achieved upon increase of the genomic repository of cultured as well as uncultured genomes within the public database repertoire. Composition-based as well as similarity-based binning methods, especially those making use of supervised machine learning algorithms (ie, PhylopithiaS, trained on reference genomes), will become increasingly accurate due to the availability of more reliable information.
At this stage it is important to mention that, in spite of the best efforts to reconstruct and prepare datasets by 1) quality filtering, 2) performing assemblies, and 3) binning sequences into taxonomically informative groups, annotation pipelines still achieve successful annotation for only ~50% of the sequences under analysis.31,157 As mentioned above, the annotation process is highly dependent on the available databases and hence limited by the amount of information that is present within these repositories. Sequences that do not have any similarity with any other sequence existing in a known database are termed “orphan genes”. 158 These genes are believed to be 1) a consequence of sequencing errors and/or reflect the inaccuracy of gene prediction tools, or 2) truly novel genes that have no sequence or function similarity to known genes and may share higher order similarity in the form of protein folds.31,158 A lot of work is currently being undertaken in order to shed some light on these unknowns/orphans using various types of information. Some existing tools use pathway information from metagenomic neighbors and also context-depended metabolomic data to assign a functional annotation to unknown genes.159,160 Along these lines, the use of metabolomic, metatranscriptomic, and/or metaproteomic data will provide a more elaborate view of the “picture”, addressing all aspect of the dogma of life in the metagenomics era. Moreover, single-cell genomics is now becoming increasingly popular by investigating information from sequencing individual cells. The synergy of single-cell genomics with metagenomics can allow a more accurate separation of metagenomics sequences into individual genomes, guided by the single-cell sequencing data.
A wide array of software is currently available to perform each step of the marker gene metagenomics analysis pipeline. What is missing from the literature is a systematic evaluation of software and algorithms that have been used so far and a standardized means of comparing results derived from different workflows. Variation in results can occur due to inconsistencies in a number of factors, such as DNA extraction,161,162 primer pair and amplification region,163–165 sequencing platform, 166 and the software used. 167 All of the aforementioned sources of variation make it very difficult to compare and obtain trustworthy results. Computational and programming challenges to improve the already available software can be achieved, but only through benchmarks, simulations, 168 and thorough testing. Initiatives such as the GSC could potentially take over the design of the “Minimum Analysis Requirements of Metagenome Sequences (MARMS)”. This will be made up of standardized methodologies and consensus in the choice of software, analysis steps, threshold values, and parameters. Such an initiative would eliminate, or at least minimize, the biases that can be generated by analyzing data using multiple methodologies.
The availability of data software such as EBI Metagenomics, IMG/MER, MG-RAST, and SILVAngs will further allow users with limited computational facilities to perform analysis of metagenomic samples. In comparative metagenomic analyses, one can use tools to compare samples from different ecological niches and extract information that is common and/or unique to a specific environment.8,169,170 Moreover, the GSC is striving toward the successful integration of analyzed data under a unified and mutually acceptable structure/format that will facilitate the exchange of valuable insights and information in the field of microbial ecology and environmental microbiology.
To sum up, we have created a metagenomics flowchart (Fig. 1) outlining all the aforementioned basic steps of the analysis pipeline. Analysis can take two different routes depending on the type of sequencing data (marker gene or shotgun metagenomics). Every analysis step shown in the flowchart is complemented by a list of some well-established tools used by the metagenomics community.
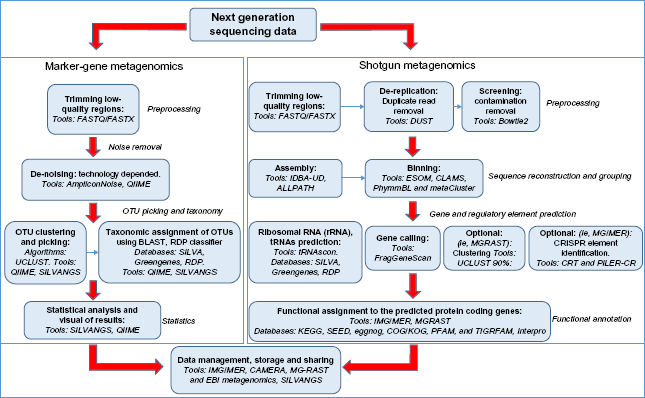
Flowchart of basic metagenomics steps and tools currently in practice.
Author Contributions
AO, GAP, II conceived the idea of the manuscript. AO, CP wrote the first draft of the manuscript. All other authors (GAP, II, NP, PP, GK, CA) made critical revisions and approved the final version of the manuscript.