
Abstract
We recently constructed a computable cell proliferation network (CPN) model focused on lung tissue to unravel complex biological processes and their exposure-related perturbations from molecular profiling data. The CPN consists of edges and nodes representing upstream controllers of gene expression largely generated from transcriptomics datasets using Reverse Causal Reasoning (RCR). Here, we report an approach to biologically verify the correctness of upstream controller nodes using a specifically designed, independent lung cell proliferation dataset. Normal human bronchial epithelial cells were arrested at G1/S with a cell cycle inhibitor. Gene expression changes and cell proliferation were captured at different time points after release from inhibition. Gene set enrichment analysis demonstrated cell cycle response specificity via an overrepresentation of proliferation related gene sets. Coverage analysis of RCR-derived hypotheses returned statistical significance for cell cycle response specificity across the whole model as well as for the Growth Factor and Cell Cycle sub-network models.
Background
Detailed mechanistic network models for the computational analysis of molecular profiling data are critical tools for understanding complex biological processes and their perturbations. Ideally, these network models are specifically designed to capture the normal, non-diseased biology of the tissue or cell type under investigation. They can then be used to better understand the impact of exposure to biologically active substances and toxicants and the associated disease risks, 1 as outlined in the 21st century toxicology settings.2,3
With the aim of developing a systems biology-based risk assessment approach for tobacco products, we are currently building a series of biological network models that reflect smoking-related molecular changes in target tissues, namely the lung and the cardiovascular system. One of the network models, the cell proliferation network (CPN) model, focuses on cell proliferation and encompasses the major areas involved in the regulation of lung cell proliferation. 4 The CPN is composed of two parts: one focuses on the core cell cycle machinery and contains only one sub-network named “Cell Cycle”; the other focuses on pathways regulating the cell cycle and consists of 4 components named “Growth Factor”, “Cell-Cell Interaction”, “Epigenetics”, and “Intra/Extra-Cellular Signaling”. The whole CPN model, and hence the sub-networks, consists of nodes that are either biological entities such as biological processes like “Gap 2 (G2) phase of mitotic cell cycle” or that represent protein abundances, protein activities, or mRNA expression. The nodes are connected by edges that are categorized either as causal or non-causal. Nodes and edges are expressed using Biological Expression Language (BEL 5 ) terminology. The whole CPN is composed of 848 nodes and 1597 edges that are supported by curated literature evidences. 4
To map and quantify the perturbations that could occur in an exposed biological system, we have applied a method called Reverse Causal Reasoning (RCR) 6 to score transcriptomic datasets. The RCR method is based on the identification of upstream controller nodes, called hypotheses, which are supported by observed gene expression changes. Because hypotheses can represent nodes within causal networks such as the CPN, their activities could be mapped to related networks and/or sub-networks. Hypotheses provide a better understanding of the molecular responses triggered within the exposed biological system. In addition, computational methods have been developed to quantify the observed perturbations within specific networks. 7
To further substantiate the correctness of the hypotheses, the relevance of the descriptive content of the network, and network directionalities, the network should be verified with independent data whose type of exposure was not included during model building, and which has a well-defined mode of action towards the principal mechanisms underlying the model. Therefore, a dedicated experiment was designed to generate a gene expression dataset that represents the molecular changes that occur during cell proliferation in an in vitro system. To be consistent with the context used to build the CPN (namely, non-diseased human lung), we chose to use normal human bronchial epithelial (NHBE) cells. Because NHBE cells are primary cells, they better reflect normal cell proliferation behavior compared to immortalized cell lines. In addition, NHBE cells represent a target cell type in the lung for exposure to cigarette smoke and other airborne chemicals and irritants 8 and have frequently been used to assess lung epithelium responses, including cell cycle progression, under various conditions.9–12 Moreover, it has been shown that these cells can be synchronized in vitro in the G0/G1 phase. 9 To investigate the molecular processes that occur at the onset of the cell cycle, we used the pyridopyrimidine-derived cyclin-dependent kinase (CDK) inhibitor PD-0332991 (INH), which specifically arrests the cells in the G1 phase. This inhibitor exhibits high specificity for CDK4 and CDK6, specifically reducing the phosphorylation of the retinoblastoma (Rb) protein at Ser780/Ser795. 13 INH is a potent anti-proliferative agent against Rb-positive tumor cells in vitro at a low nanomolar concentration range; 14 its activity in non-transformed cells has been reported only sparsely, for example, in certain tissues during embryogenesis, 15 or in differentiating myoblasts in vitro. 16
Experimentally, the optimal concentration of INH that causes sufficient inhibition of NHBE cell proliferation at low toxicity was determined by flow cytometry and applied to arrest actively proliferating subconfluent NHBE cell cultures. For verification of our CPN model, we followed the process of re-entering the cell cycle after washout of INH and measured the fraction of cells in the Synthesis phase (S-phase), namely the Bromodeoxyuridine (BrdU)-positive cells, at 4 time-points. At the same time, we compared the gene expression signaling from the re-proliferating NHBE cultures with the signaling of cell cultures with ongoing INH treatment. We also included an unperturbed proliferating control group that received only growth medium. The correctness of the upstream regulators within the CPN model was investigated by analyzing the qualitative and time-resolved gene expression changes for this independent experimental dataset in correlation with the onset and progression of the cell cycle in NHBE cells after release from INH, revealing the molecular signaling mechanisms.
Methods
Cell culture and treatment
Normal human bronchial epithelial (NHBE) cells (Lonza Inc., Walkersville, MD, United States) were isolated from donated human tissue after obtaining permission for their use in research applications by informed consent or legal authorization. The donor was a 56 years old Caucasian female with no history of smoking. NHBE cells were cultured in standard growth medium (GM): BEBM (Lonza Walkersville, Inc., Clonetics®) supplemented with BEGM® BulletKit® with BPE (0.13 mg/mL) and hEGF (25 ng/mL). According to the experimental design (see Fig. 1), NHBE cells from the same culture stock were treated with or without a non-toxic dose of 1 mm PD-0332991 (Biozol GmbH, Eching Germany), a pyridopyrimidine-derived cyclin-dependent kinase inhibitor with high specificity for CDK4 and CDK6. 13
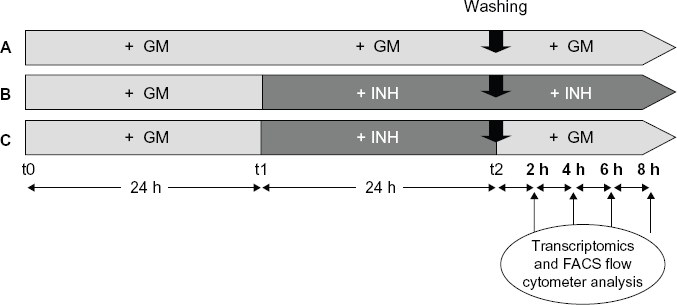
Outline of cell proliferation experiment. Diagrammatic representation of the 3 in vitro culture conditions applied to NHBE cells and analyzed at the gene expression level (2 hours, 4 hours, 6 hours, and 8 hours after the washing step). From t0 to t1, the cells were cultured in normal growth medium (GM) for 24 hours. PD-0332991 inhibitor (INH, final concentration 1 mM) was then added to the GM at t1 for 32 hours (
Cell cycle analysis
Cells were exposed to 10 mM of BrdU 2 hours before trypsinization (trypsin/EDTA solution from Lonza, Inc.). They were then harvested 2, 4, 6, and 8 hours after the washing step (Fig. 1). This time points were chosen to capture early events after re-entering cell cycle at Gap 1 (G1). BrdU immunostaining kit (APC BrdU flow kit, BD Pharmingen™) was then used to label cells that had replicated the DNA after the addition of BrdU to the medium. Cellular DNA was stained for 30 minutes (min) with a phosphate buffer solution containing propidium iodide (20 mg/mL, Life technologies™, Carlsbad, CA, United States) and RNAse A/Dnase free (100 mg/mL, Applichem GmbH, Darmstadt, Germany) and analyzed using a flow cytometer (BD FACSCanto II System with Fluidics Cart, Becton Dickinson Biosciences). For each experimental condition (Fig. 1), the number of biological replicates used was n = 3.
Transcriptomics data generation RNA preparation
For each experimental condition, 3 biological replicates were used to extract total RNA from NHBE cells using the RNeasy Mini Kit (Qiagen). Purified RNA was quantified using the Nanodrop ND-1000 (peqlab) and RNA integrity was determined using the Agilent 2100 Bioanalyzer. Only RNA samples with an RNA integrity number (RIN) higher than 6 were included for analysis.
Microarray Preparation
Transcriptome analysis was conducted using the GeneChip® HT 3′ IVT Express Kit according to the manufacturer's instructions (Affymetrix, Santa Clara, CA). Briefly, after synthesis of double-stranded cDNA using 100 ng total RNA as starting material, in vitro transcription was performed to synthesize biotinylated aRNA. The aRNA was then purified and fragmented. The degree of fragmentation and the length distribution of this fragmented biotinylated aRNA was checked by running samples on a 1.0% agarose gel. 10 μg of biotinylated fragmented aRNA were hybridized to Affymetrix HG-U133Plus2 at 45 °C for 16 hours. After washing and staining, arrays were scanned with Affymetrix Scanner 3000 7G. Captured array images were analyzed and converted to probe array signal intensity, saved as CEL files, applying default parameters set up in the Affymetrix data analysis software package. An initial chip quality check was also performed using the Affymetrix software.
Transcriptomics data is available in ArrayExpress, accession number E-MTAB-1272.
Transcriptomics data analysis
Raw transcriptomics data were processed and normalized using the GCRMA R package from Bioconductor. 36 Data were quality checked and all CEL files passed the quality criteria.
To identify the differentially regulated genes when GM was added after washing relative to the inhibitory condition (proliferation effect), and to then perform reverse causal reasoning analysis (see details below), pairwise comparisons were computed with linear models for microarray data (limma) following a global linear model. Coefficients of the model were estimated with an eBayes approach using the limma R package. 36 For each time-point, the gene expression levels were measured in NHBE for group C and compared to the expression levels measured in NHBE for group B. The cells from both groups were kept under cell cycle inhibitory condition for 24 hours before washing step. This resulted in a contrast for each treatment-control pair (growth medium versus cell cycle inhibition). Significantly differentially regulated genes were identified with a significance level (corrected using a false discovery rate; FDR) below 0.05, with an absolute log2 fold change value above 1.3, and an abundance level above log2 (100).
The analysis was performed to check the sustained effect of the CDK inhibitor over time.
2 groups of samples were compared. Samples originating from cells kept under the inhibitory condition (group B) before and after washing, and from cells maintained under growth medium before and after washing (group A, additional untreated control).
Gene set enrichment analysis (GSEA)
To investigate the main biological effects induced by growth medium (proliferation effect), and the sustained effect of the inhibitor, GSEA was performed with entire contrasts.
17
For each exposure time, the list of genes was decreasingly sorted by the
Reverse causal reasoning (RCR)
RCR
6
is a knowledge-driven backward reasoning technique for identifying potential upstream regulators or controllers which could explain the observed differential gene expression profiles. RCR analysis requires a priori knowledge in the form of hypotheses and significantly regulated genes (absolute log2 fold change value above 1.3; FDR < 0.05; abundance level ≥ log2 (100)) from the transcriptomics data are required as inputs. A hypothesis corresponds to a simple causal network constituted by an upstream node (subject term or “controller”) connected to downstream nodes (measured quantities, eg, expression of target gene) by a causal edge. Each edge represents the causal relationship between the “controller” and the target gene derived from a statement extracted from literature (eg, transcription activation of X increases the expression of Y, but decreases the expression of W). The notion of causal relationship directionality is important in RCR. Indeed, hypotheses can be evaluated as potential explanations for the observed differences in measurement sets by calculating two statistics called “richness” and “concordance”. For each hypothesis, the “richness” measures the over-representation of the set of observed state changes (corresponding to the pairwise differentially expressed genes) and the set of nodes downstream of the hypothesis. The “concordance” measures the consistency of the directions between the observed state changes and the expected direction from the hypothesis model. A
Hypotheses in Figure 6 were arranged as follows:
Verification of regulation directionalities
For each network model, shortest paths were extracted for each pair of hypotheses. The sign of the path was the product of single edge signs forming the path. Concordance sign was considered for the 2 hypotheses and compared against the path sign. A positive (negative) path between 2 hypotheses was deemed to be correct if the hypotheses had the same (different) concordance sign. A path was deemed to be incorrect otherwise.
Statistics were computed using a parameters: 0.5 as probability of success; the number of hypotheses as the number of total trials; the number of correct paths as the number of successes. Then the probability to randomly obtain more than number of correct paths was retained.
Results
Cell cycle perturbation analysis
The cell cycle distribution of NHBE cells under the different conditions (Fig. 1) was determined by flow cytometric assessment of DNA content and BrdU incorporation. NHBE cells in the control group (A, Fig. 1) that received the fully supplemented growth medium grew exponentially throughout the whole experimental period of 56 hours (19 to 24 hours population doubling time during the log phase as determined in a pilot study, data not shown), and the fraction of cells in the S-phase (BrdU-positive cells) at time-points t2 (48 hours) plus 2, 4, 6, and 8 hours was constant and in the range of 30%–35%. In addition, 1%–3% of the cells were classified as BrdU-negative S-phase cells based on their DNA content (group A, Fig. 2).
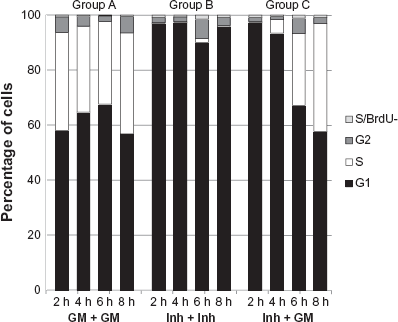
Flow cytometric analysis of cell cycle distribution of NHBE cells under various conditions. The proportion of NHBE cells in different phases of the cell cycle (G2, S, G1) was evaluated by flow cytometry using BrdU and PI staining. For all 3 culture conditions (group A, group B, and group C), the cells were counted 2 hours, 4 hours, 6 hours, and 8 hours after the washing step (see Fig. 1). Continuous exposure to PD-0332991 inhibitor (group B) blocked most cells in G1 phase (group B); the washing step of the inhibitor followed by the GM culture period (group C) allowed the cells to proliferate again because the proportion of cells in the S phase increased after 4 hours and at 8 hours (group C) and is comparable with the proportion of cells in the S phase after 8 hours in growth medium (group A).
To synchronize NHBE cells, we first tested the method described by Fischer et al 9 where cells are starved for 48 hours in an epidermal growth factor (EGF)-free and bovine pituitary extract (BPE)-free media. Unfortunately this method did not trigger the expected cell synchronization in Resting phase or G0 phase (G0)/G1 (data not shown), we decided to take advantage of the inhibitory effect of PD-0332991 on the cell cycle. At first, various doses (0.1 mM, 1 mM, 10 mM, 100 mM) of this drug were tested on NHBE cells and both cellular toxicity (Resazurin assay) and cell proliferation (BrdU assay) responses were measured after 24 hours of exposure (data not shown). Doses above 1 mM were excluded due to cell toxicity. The dose of 1 mM was selected due to its best efficiency to stop cell proliferation and thus to synchronize cells in G0/G1.
In the inhibitor-treated group (B, Fig. 1), NHBE cells exposed to INH at time (t) 1 (24 hours) for 24 + 8 hours were efficiently arrested in the G1 phase at the four measurement time-points: 90% or more of the cells were in G1; 2% or less were BrdU-positive S-phase cells; and another 1%–2% were BrdU-negative S-phase cells (group B, Fig. 2).
In the inhibitor-release group (C, Fig. 1), NHBE cells treated with INH at t1 followed by a washout with growth medium at t2, a time-dependent re-entry into the cell cycle at the S-phase was observed with an increase in the fraction of BrdU-positive cells after the washout at t2 from 2% at 2 hours to 5% at 4 hours, 27% at 6 hours, and 38% at 8 hours; 0%-2% were BrdU-negative S-phase cells (group C, Fig. 2).
These results confirm that under the chosen experimental conditions, the cells in the INH-release group could be efficiently arrested, and an increasing number re-entered the cell cycle at the S-phase between 2 and 4 hours after washout and reached the level of BrdU-positive cells in the untreated control cultures 8 hours after washout (see Supplemental File 7 for the raw data of the FACS analysis).
Differential gene expression analysis
The cells from the 3 groups, fully supplemented growth medium (group A), INH (group B), and INH-release group (group C), in the cell proliferation experiment (Fig. 2) were collected after 2 hours, 4 hours, 6 hours, and 8 hours of exposure and, following extraction, the mRNAs were hybridized on microarrays (see Methods—RNA and microarray hybridization). 2 differential gene expression comparison analyses were performed. In the first, group C was compared against group B, and in the second, group B was compared against the fully supplemented growth medium control group A.
In the group C versus group B comparison, the proliferation effect was studied over time. The volcano plot and the Venn diagram emphasizing the differentially expressed genes (see Methods—Transcriptomics data analysis) at each time-point are shown in Figure 3. The number of differentially regulated genes increased over time, from 2 to 8 hours of exposure (Fig. 3B). The Volcano plots also show that the expressions of some of the genes were significantly up-regulated, and only a few genes were significantly down-regulated (Fig. 3A and B).
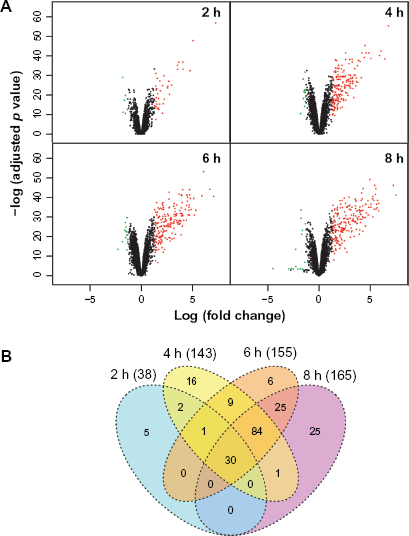
Differentially expressed genes under the inhibitor-released and inhibitory cell cycle conditions (group C versus group B). (
When comparing gene expression in group C versus group B, we found that 38 genes were differentially regulated at 2 hours, and a total of 199 genes were differentially regulated at later time-points; about 72% of the genes were differentially regulated at 4, 6, and 8 hours (Fig. 3B), but with a time-dependent increase in the numbers of genes. A core set of 30 genes was commonly regulated at all time-points, while other groups of genes were specifically regulated between 2 hours and 4 hours, 4 hours and 6 hours, or 6 hours and 8 hours (Fig. 3B).
In the group B versus group A comparison, the stability of the inhibitory effect was studied. As Figure 2 shows, the proportions of group A cells across each cell cycle phase did not change considerably over the various time-points. We found that the number of differentially regulated genes across the time-points was stable when comparing gene expression in group B versus group A (See Supplemental File 1A and B). The total number of genes that were differentially regulated at, at least, 1 time-point was 293 (combined number of differentially regulated genes across all time-points); 70% (206 of the 293) were differentially regulated at all 4 time-points.
Gene set enrichment analysis (GSEA) identifies main biological processes activated following proliferation induced exposure
To identify the main biological processes that are activated under proliferation conditions, GSEA was performed using collection gene sets representative of canonical pathways (collection 2 from MSigDB).17,18 Gene sets were scored against the ranked (t-statistic) list of genes obtained from the group C versus group B comparison.
The GSEA results showed that an overall enrichment of cell cycle related genes had occurred in the cells in these 2 groups (Fig. 4). In Figure 4, the gene sets are arranged to reflect the order of the cell cycle phases. No significant enrichment of cell apoptosis related gene sets was observed; rather, genes differentially regulated at 2 hours were associated with G1-S, while at later time points gene sets related to later cell cycle phases were significantly enriched, showing an early response capturing the G1-S transition. Moreover, GSEA analysis was able to capture the G2/M transition at 4 and 6 hours (Fig. 4). For the group B versus group A comparison that tested the stability of the inhibitor, the GSEA results also showed an enrichment of cell cycle related gene sets but with negative enrichment scores, as expected (see Supplemental Files 2 and 6).

Gene set enrichment analysis (GSEA) of gene sets associated to canonical pathways. Gene lists were built to represent the onset of proliferation upon release from the INH treatment and ranked according to the t-statistic from the results of the limma analyses. Gene sets were grouped according to the cell cycle phase to which they were associated. The last 3 gene sets in the list were associated to cell death. The Normalized Enrichment Score (NES) is shown. The red (positive NES) and green (negative NES) scales mark the FDR q-val scores with significances below 0.05.
Unlike the results from the cell proliferation experiment, no difference in the normalized enrichment score (NES) was observed across the time-points. A group of 206 genes (60% of the total) that are commonly differentially expressed for all time-points was identified (see Supplemental File 1 for details). This observation and the GSEA results together indicate a consistent and stable INH effect on gene expression in these cells.
GSEA analysis confirmed that the transcriptomics data reflect the experimental perturbation of the cell cycle.
Verification of upstream regulators by Reverse Causal Reasoning (RCR) analysis
To verify the correctness of the predicted upstream regulators of the CPN model, we applied RCR (see Methods—Reverse Causal Reasoning) to the cell proliferation datasets described above to predict the activity states of specific hypotheses that are consistent with the biology of the underlying datasets as determined by GSEA and flow cytometry. Mapping these hypotheses on the related sub-networks should further elucidate the expected molecular mechanisms involved.
RCR analysis was performed by selecting the genes that were differentially regulated (see Methods—Transcriptomics data analysis) between group C and group B (proliferation effect over time). RCR scored each set of significantly regulated genes (4 lists of genes in total: 2, 4, 6, and 8h) against the full set of hypotheses (>2000) from the Selventa Technology Platform. 19
RCR produces richness and concordance scores (see Methods
6
). Concordance measures the consistency of the directions between the observed state changes (corresponding to the pairwise differentially expressed genes) and the expected direction captured in the hypothesis model. By fixing the concordance

Results of Reverse Causal Reasoning analyses. Fifty-four hypotheses of the cell proliferation network (CPN) model had significant concordance (
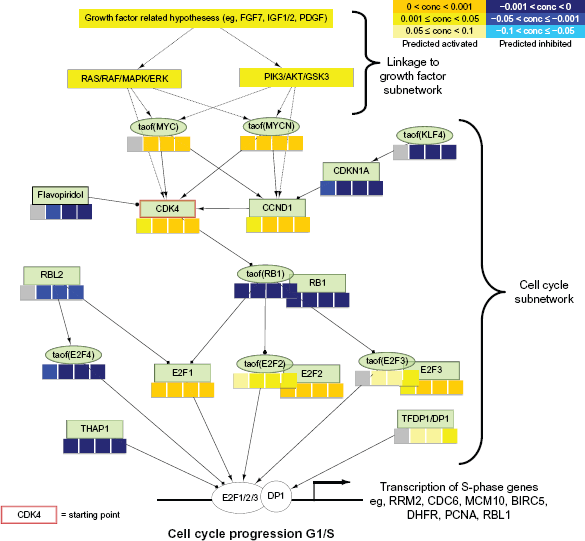
RCR results overlaid on a part of the Cell Cycle sub-network model. Nodes of the Cell Cycle sub-network model are organized in a network structure, and RCR results are shown as heat maps (concordance levels) beneath the name of each hypothesis. Upstream part of the network represents the link to the Growth Factor sub-network. The middle part shows hypotheses of the Cell Cycle sub-network model directly responsible for the S-phase genes transcriptional response (bottom part of the network).

The removal of the CDK4/CDK6 inhibitor (group C) drove the cells into the S-phase. Consequently, CDK4 and flavopiridol (a cyclin-dependent kinase inhibitor under clinical development) associated hypotheses were predicted to be activated and inhibited, respectively. Overall, high concordance was observed between the expected biological processes and the G1 to S-phase transition-associated processes.
Evaluation of the predicted hypotheses for the Growth Factor sub-network (Fig. 5) showed an induction of growth factor related Hypotheses (Platelet Derived Growth Factor Complex family Hs, anti-EGFR mAB Clone 225, IGF1, IGF2, FGF7). Interestingly, FGF7 was a component of the cell culture medium that was used in this study. Downstream from the growth factors, hypotheses that correspond to PI3K (kaof(PI3K family Hs), kaof stands for kinase activity of)) and serine-threonine protein kinase (AKT) (kaof(AKT family Hs)) activity were predicted to be time-dependently up-regulated, indicating the activation of this particular cellular pathways in our experiment (Fig. 6 (see also Supplemental File 5)). Consistent with this finding, the RCR analysis predicted the inhibition of PTEN activity (paof(PTEN)), a negative regulator of the PI3K/AKT signaling pathway which inhibits AKT activity via dephosphorylation. 20
14 of the 54 significant hypotheses were neither part of the Cell Cycle nor of the Growth Factor sub-network models. Hypotheses such as gtpof(RHOA), RAC1, and kaof(ROCK1) that describe the activities of RHOA, RAC1 and ROCK1, proteins that are mainly involved in cell migration processes, were predicted to be up-regulated. 21 However, because these processes, including cytoskeleton rearrangement, are also present in cell division, the increased activity of these genes might be expected. 22 Differentiation-associated hypotheses (Indian hedgehog homolog (IHH), GLI1 (taof (GLI1), taof stands for transcriptional activity of), GLI2 (taof (GLI2))) were predicted to be activated under proliferation conditions. When we investigated this more closely, we found that the respective underlying evidences were enriched for the cell cycle process gene ontology term associated genes (false discovery rate (FDR) < 1E-11).
It was important to verify that the regulation directionality of predicted active hypotheses was concordant with respect to the expected cascade of causal molecular events modeled in the backbone of the network models. Statistical analysis (see Material and Methods) showed regulation directionality in agreement between Network Models paths and the corresponding activation/inhibition of predicted hypotheses (CPN,
Discussion
Our study aimed at verifying the correctness and the relevance of the recently published CPN model 4 using a dataset independent of the network building process focusing on lung cell proliferation. The experiment was designed in such a way that it was possible to observe the re-entry and progression of human normal bronchial epithelial cells (NHBE) in the S-phase of the cell cycle following the withdrawal of the chemical CDK4/6-inhibitor that blocked cells in G1 phase. These results were observed by FACS (Fig. 2), and confirmed at the molecular level using gene expression data analyzed with computational approach (GSEA) supporting the identification of significantly enriched cell cycle-related pathways/biological processes (Fig. 4). Having checked that the dataset reached biological expectations (Fig. 4), transcriptomics data were used to evaluate the CPN model. As a first step, RCR analysis, which uses a database of hypotheses as prior biological knowledge, enabled to identify hypotheses predicted to be active upstream regulators of the observed gene expression in the dataset and which significantly covered the CPN model (Fig. 5). The subnetworks for which predicted active hypotheses were the most significantly represented were the cell cycle and growth factor sub-networks, indicating that the CPN model has the ability to capture specific signals. Indeed, the culture medium used to grow NHBE cells contains growth factors that activate growth factor pathways converging towards the cell cycle leading to cell proliferation. Under CDK4/6-inhibitor conditions, some growth factor signaling is blocked at the entry of the cell cycle corresponding to the G1-phase. 13 As a second step, it was important to verify that the regulation directionality of predicted active hypotheses was concordant with respect to the expected cascade of causal molecular events modeled in the backbone of the CPN model (Fig. 6). This was actually the case, indicating that those biological mechanisms were accurately modeled. Moreover, the prediction of the flavopiridol hypothesis demonstrates that the CPN may also support mode-of-action studies for biologically active substances such as putative drugs.
This verification process also enabled to pinpoint some unexpected findings. The hypothesis taof(TP53) related to the tumor suppressor p53 was predicted to be activated, implying that the transcriptional activity of p53 was activated. p53 activation in non-transformed cells mainly occurs after cell damage such as DNA damage and leads to cell cycle arrest, which is clearly opposite to our experimental set-up and the cell proliferation results, which show no difference between the untreated control (group A) and the INH-released (group C) cells at the 6-hour and 8-hour time points. Active p53 would normally act via the induction of genes involved in DNA repair and cell cycle regulation such as the cell cycle inhibitor p21/CDKN1A, 23 but CDKN1A, similar to other cell cycle inhibitors such as RB1, was predicted to be down-regulated in our analysis (Fig. 6). We found that evidence in our knowledgebase, ie, causal relationships available from the literature that support the p53-associated hypothesis, is originating from tumor cells. This observation from an experimental evaluation of the network model demonstrates the importance of context-specific causal evidence to be available in the knowledgebase, as well as the value of experimental verification studies to reveal the lack of such appropriate statements. Therefore, the underlying evidence statements in the knowledgebase for this hypothesis will be augmented to represent the p53 signaling in non-tumor cells by adding newly curated causal relationships from the appropriate tissue context, namely non-diseased lung tissue, when a new release of the model becomes available.
Another unexpected finding concerns the role of AKT in the Cell Cycle sub-network. One possible explanation could be the inhibition of GSK3B because active GSK3B has been reported to inhibit CyclinD1 (CCND124,25) and MYC (see Supplemental File 5); in addition, growth factors may act via the RAS/RAF/MAPK pathway. But, except the activation of c-Jun (taof(JUN)), the predicted activity of the RAS/RAF/MAPK pathway could not be identified, maybe because activation of the MAPK pathways is very fast and transiently regulated via phosphorylation and dephosphorylation. Therefore the 2-hour time point may already be too late to detect the activity of single pathway members. Moreover, the addition of more granularity, in terms of phosphorylation site, regarding the phosphorylation reactions involved in the regulation of AKT might augment the model predictions in this pathway.
These 2 examples highlight important aspects of the experimental verification of computational models. Among others, the full traceability of all evidences from the knowledgebase enables to understand unexpected and contradictory predictions, and the need of adding more context-specific evidences where appropriate.
Different approaches for biological network construction and evaluation/validation have been proposed. A 2-step approach was reported for a Growth Factor sub-network model: initially, a rough network was compiled from databases of biological pathways, 26 and in the second step, interactions between pathway components were evaluated by applying computational models on specifically generated experiments. Another example is a DNA damage-response network model, which was built initially as an extended, literature based, DNA damage-response model. In the second step, this model was augmented and verified by quantitative interrogation of a subset of the network components by Western blotting under doxorubicin conditions, as well as doxorubicin + TNF” to “Tumor Necrosis Factor (TNF) supplied conditions. 27 With this approach, network level relationships could be confirmed or identified partially; for example, for two of the computational models. One possible reason that limits direct experimental network model validation to only partial evaluations is the fact that these models are inherently incomplete, notably in complex systems such as mammalian organisms. However, a few complete mechanistic models in less complex systems have been proposed. 28 Another problem is that large-scale network models comprising thousands of components (eg, mRNAs, proteins) connected by tens of thousands of relationships, cannot be fully validated due to the lack of appropriate technologies.
On the other hand, neither mechanistic nor causal genome-wide network models have been proposed, since after the advent of the high-throughput technologies and, currently, networks mainly represent correlations among gene expression profiles. Network evaluation is usually carried out computationally against databases of protein-protein interaction networks, followed by biological validations limited to a small subset of yet undiscovered interactions. 29 Occasionally, predicted yet invalidated interactions involve even well studied cellular processes. Although cell proliferation, and, in particular, the cell cycle, probably represent the most studied biological process, some mechanisms are yet to be discovered; for example, cell cycle machinery differs from species to species and even across tissues/conditions within the same species, and new interactions among cell cycle related cell components are still being reported. 29
The overall results of our study demonstrate the importance and the value of the verification process. It is clear from this study that not a single dataset can cover the perturbation of the entire network model as observed with a lower coverage of the epigenetic component and the nuclear receptor intracellular signaling (FDR < 0.05, data not shown). The process would require the generation of additional data targeting the perturbations of these parts of the network. However, costs and unavailable technologies limit the generation of datasets. One possibility is to benefit from datasets newly available in public repositories. A complementary approach may be the involvement of the scientific community to evaluate the correctness of a network model. For example, when a manually assembled map of the mammalian target of the rapamycin (mTOR) signaling network was built from literature evidence extracted from 522 scientific publications 30 the map content was evaluated by sharing it via Payao, a collaborative environment tool. 31 This approach opened up a manual process for evaluating and augmenting the map content based on the scientific knowledge of the community. Following this idea, the CPN model 4 will be made available to the scientific community on an open web platform. Scientists will be able to access the CPN model through the BEL framework, which consists of a set of tools enabling the loading and visualization of the platform content. The BEL framework is made available by the OpenBEL consortium. 5
Conclusion
This work describes the process of experimental verification of the CPN model using an independent dataset designed for this purpose. The results show that the model faithfully captures the process that is activated when cells are released form the cell cycle block. The use of datasets newly available in public repositories and the contribution of the scientific community to our open access model will contribute to refine, adjust and augment the CPN model. Therefore, this network model evaluation process described here can be considered as an iterative and dynamic process that will increase the model accuracy over time. This can be regarded for this CPN model and the related RCR-based network models of diverse cellular functions32–35 as well as for all other computational modeling approaches on large-scale molecular datasets as a necessary prerequisite for their practical application; for example, to investigate the impact of exposure to biologically active substances and toxicants and the associated disease risks, as discussed in the concepts for the “21st Century Toxicology”.2,3
Author Contributions
Conceived and designed the experiments: CP, SG, CM, WKS, RBL, SQH, SW, JH, MCP. Analyzed the data: VB, CP, SG, CM. Wrote the first draft of the manuscript: VB, SG, WKS. Contributed to the writing of the manuscript: VB, CP, SG, CM, WKS. Agree with manuscript results and conclusions: VB, CP, SG, CM, WKS, RBL, JH. Jointly developed the structure and arguments for the paper: VB, CP, SG, CM, WKS, JH. Made critical revisions and approved final version: CP, SG, CM. All authors reviewed and approved of the final manuscript.
Funding
Author(s) disclose no funding sources.
Competing Interests
Author(s) disclose no potential conflicts of interest.
Disclosures and Ethics
As a requirement of publication the authors have provided signed confirmation of their compliance with ethical and legal obligations including but not limited to compliance with ICMJE authorship and competing interests guidelines, that the article is neither under consideration for publication nor published elsewhere, of their compliance with legal and ethical guidelines concerning human and animal research participants (if applicable), and that permission has been obtained for reproduction of any copyrighted material. This article was subject to blind, independent, expert peer review. The reviewers reported no competing interests.
Footnotes
Acknowledgements
We thank Andrea Völkel for the flow cytometry experiment; Dr. Nadine Schracke for RNA extraction; AROS laboratory for transcriptomics experiment; Dr. Arnd Hengstermann for critical discussions of the experimental design. Thanks to Selventa for collaboration and access to the Selventa Technology Platform.
Supplementary Materials
Additional File 1
Additional File 2
Additional File 3
Additional File 4
Additional File 5
Additional File 6
Additional File 7