
Abstract
An HPLC-UV method was developed and validated for the determination of lumefantrine in human plasma. Lumefantrine and its internal standard halofantrine were extracted from plasma samples using protein precipitation with acetonitrile (0.2% perchloric acid) followed by solid-phase extraction with Hypersep C8 cartridges. Chromatographic separation was performed on a Zorbax SB-CN HPLC column (3.0 × 150 mm, 3.5 μm) with water/methanol (0.1% TFA) as the mobile phases in a gradient elution mode. Detection was performed using UV/vis detector at λ = 335 nm. The method showed to be linear over a range of 50-10,000 ng/mL with acceptable intra- and inter-day precision and accuracy. The mean recoveries were 88.2% for lumefatrine and 84.5% for the I.S. The internal standard halofantrine is readily available from commercial sources. This method was successfully applied to a pharmacokinetic interaction study between a first-line antimalarial combination (artemether—lumefantrine) and antiretroviral therapy.
Introduction
Malaria is a serious and sometimes fatal protozoan disease caused by malaria parasites (
Lumefantrine (LF), also named benflumetol and chemically (9z)-2,7-dichloro-9-[(4-chlorophenyl) methylene]-a-[(dibutylamino)methyl]-9H-fluorene-4-methanol, is an aryl alcohol antimalarial first synthesized in the 1970's by the Academy of Military Medical Sciences, Beijing, China and registered in China for the treatment of malaria in 1987.
2
The compound is a yellow powder that is poorly soluble in water, oils, and most organic solvents, but soluble in unsaturated fatty acids and acidified organic solvents. LF is extensively bound (>99%) to plasma proteins, mainly high density lipoproteins.
3
LF as a drug is commercially available only in a fixed-dose combination with artemether (Coartem® or Riamet®).
4
This combination is well tolerated and highly effective and now becoming the most recommended first-line treatment for uncomplicated
To support pharmacokinetic interaction study between artemether/LF and an antiretroviral treatment for patients co-infected with malaria and HIV, here we describe an HPLC-UV method to determine LF in human plasma. Previously, Mansor et al reported an HPLC-UV method with a narrow calibration range (25-800 ng/mL) and requiring a large sample volume (1 mL). 5 Lindegardh and coworkers developed HPLC-UV methods to determine LF in plasma and sampling filter paper.4,6 However, the recovery of LF was relatively low (60%-75%), and the internal standards used in these methods are not commercially available. Our method is based on a previously published method with the following modifications 6 : (1) Protein precipitation utilized acetonitrile containing 0.2% perchloric acid in place of 1% acetic acid, affording an improved recovery (∼90%). (2) Use of the gradient mobile phase water (0.1% TFA) and methanol (0.1% TFA) which are salt-free solvents, enabled column wash with a high percentage of organic solvent. (3) The internal standard halofantrine is commercially available.
Experimental
Reagents and materials
Lumefantrine (Figure 1) and halofantrine (the internal standard, I.S.) were purchased from A.K. Scientific Inc. (Mountain View, CA, USA). Acetonitrile (MeCN), methanol (MeOH), water (H2O), Perchloric acid (HClO4), and formic acid (HCO2H) were obtained from Fisher Scientific (Fair Lawn, NJ, USA). Trifluoroacetic acid (TFA) was purchased from Sigma-Aldrich (St. Louis, MO, USA). All chemicals were of HPLC grade. Water was distilled water, if not mentioned specifically. Human plasma was purchased from Biological Specialty Co. (Colmar, PA, USA).
Chemical structures of lumefantrine and halofantrine (the I.S.).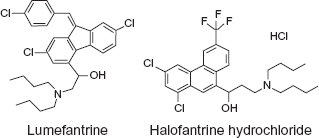
Instrumental and analytical conditions
The HPLC system consisted of Waters 1525 binary HPLC pumps, Waters 717 plus autosampler, and Waters 2487 dual λ absorbance detector controlled by Waters Breeze software (Version 3.30 SPA). Separation was achieved on a Zorbax SB-CN HPLC column (150 × 3.0 mm, 3.5 μm, Agilent), equipped with a pre-column filter, used at room temperature. The UV/vis detector was set at 335 nm, and injection volume was 50 μL. The mobile phases were water with 0.1% TFA (A) and MeOH with 0.1% TFA (B) pumped at a flow rate of 0.4 mL/min. The gradient program consisted of linear segments with 68% B (0-4 min), 68%-75% B (4-18 min), 75%-95% B (18-19 min), 95% (19-22 min), 95%-68% B (22-22.5 min), and 68% B (22.5-31 min).
Preparation of standard and quality control samples
Primary stock solutions of LF and I.S. were each prepared at a concentration of 1 mg/mL in MeCN-water (1:1) containing 0.5% formic acid. These primary solutions were diluted with MeCN-water (1:1) containing 0.1% formic acid to prepare working stock solutions and working solutions. The working solutions of LF were spiked to blank plasma to obtain calibration standards of 50, 100, 250, 500, 1000, 2500, 5000, 7500 and 10000 ng/mL. QC samples were spiked at 120, 900 and 9000 ng/mL by adding the working solutions into blank human plasma. Calibration standards and QC samples were prepared from separately weighted stock solutions. The stock solutions, standards, QC samples, and the I.S. working solution (100 μg/mL) were stored at -70 °C between uses.
Sample preparation
To a 0.2 mL aliquot of each standard, QC, and blank plasma was added 50 μL I.S. (100 μg/mL halofantrine). The mixture was precipitated with 0.5 mL MeCN containing 0.2% HClO4. After vortexing and centrifuging, the sample was poured into a pre-conditioned Hypersep C8 solid-phase extraction (SPE) cartridge (50 mg/1 cc, Thermo-Fisher) and pipet-mixed with 0.5 mL pre-loaded water. After pipet-mixing, the sample was drained into the bed and washed with water (1 mL × 3) and subsequently 0.5 mL MeCN-water (2:3) containing 0.1% TFA. The cartridge was then dried under vacuum (∼8 in Hg) for 10 min followed by eluting with 0.5 mL MeOH (0.1% TFA). The eluted sample was dried at 40 °C with a stream of N2, reconstituted with 200 μL MeOH-water (68:32) containing 0.1% TFA, and transferred into an autosampler vial.
Method validation procedure
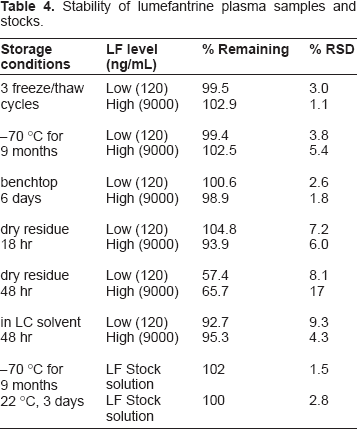
The method validation was conducted according to the guidelines of NIH funded AIDS Clinical Trials Group (ACTG), 7 which were developed based on Food and Drug Administration (FDA) guidelines. Calibration curves were obtained by linear regression of the peak area ratio of analyte to internal standard (Y-axis) versus the nominal analyte concentrations (X-axis) with a weighting factor of 1/x. The LLOQ was established using five samples independent of standards to determine accuracy and precision. The signal intensity of the LLOQ was ≥5-fold blank response. Intra-day precision and accuracy were determined by analysis of five replicates of each QC sample (n = 5) at low (120 ng/mL), medium (900 ng/mL), and high (9000 ng/mL) concentration levels extracted with a set of standards in one batch. The same procedure was repeated on five different days with new samples to determine inter-day precision and accuracy (total: n = 25 per concentration level). Precision was reported as relative standard deviation (RSD, %) and accuracy as percent deviation from the nominal concentration (% deviation). Recovery was assessed by comparing the peak area of LF or I.S. from the normally processed plasma samples to the peak area of LF or I.S. from directly injected water-MeCN (1:1) solution with the same concentration of LF or I.S. Specificity of the assay was tested with 6 different sources of human plasma and potential concomitant drugs. The stability of LF in human plasma was evaluated at these conditions: 3 freeze-thaw cycles, storage at -70 °C, room temperature storage (22 °C), and at different steps in the sample preparation process. Each condition was tested with QC samples at low and high concentration levels in triplicates. Fresh samples were used as reference. Stock solutions of LF and I.S. were evaluated at -70 °C and room temperature (22 °C).
Application to pharmacokinetic study in healthy volunteers
Plasma samples from 13 healthy volunteers were tested with this validated method. The clinical study was conducted at the Clinical and Translational Science Institute Clinical Research Center, San Francisco General Hospital. Each subject received 6 doses of Coartem (80 mg artemether and 480 mg LF) twice daily (study days 1-4), at day 4 blood samples were collected before the sixth dose and at 0.5, 1, 2, 4, 6, 8, 12, 24, 48, 72, 96, 120, 168, 216, and 264 hr post-dose for the analysis of LF. Whole blood samples were drawn into EDTA-containing tubes and centrifuged at 2000 g for 10 min. The resulting plasma samples were stored at -70 °C before analysis.
Results and Discussion
Internal standard selection
The ideal I.S. should possess similar behavior with the analyte in the process of sample preparation, LC separation, and detection, and it should not be potentially present in the samples. The I.S. should be eluted near the analyte but not overlap with the analyte unless different detection channels are used. 8 Efforts on selecting a close analog of LF as the I.S. were limited by commercial availability. Finally halofantrine was selected as the I.S. Halofantrine is readily available commercially and detectable at 335 nm. The recovery of the IS from sample preparation was similar with LF, with a retention time approximately 6 min less than LF. Sporadically interfering peaks were observed, but with a relative intensity less than 5% of I.S. signal at the final I.S. concentration. The I.S. concentration affects the fitting of calibration curve. Too high concentration of I.S. results in large error at lower end of the calibration curve. The I.S. concentration was selected based on its detection signal equivalent to the signal of the analyte at a concentration between the lower one-third and the middle of the calibration range in terms of magnitude. The I.S. concentration in the final injection solution was 25 μg/mL. Based on its UV response at 335 nm, 25 μg/mL I.S. was equivalent to ∼700 ng/mL LF, which was close to the middle point of the calibration curve.
LC optimization
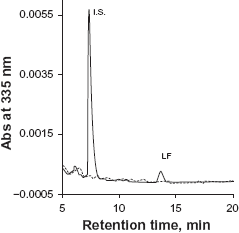
Phosphate buffer is commonly used as a mobile phase component in HPLC-UV assay to maintain constant pH. However, phosphate salts tend to precipitate in the solvent line with increasing organic solvent, resulting in instrument failure. We used 0.1% TFA instead of phosphate buffer to maintain an acidic condition in order to minimize peak tailing. Initially MeCN-water (55:45) with 0.1% TFA was used as mobile phase. However, an interfering peak partially co-eluted with the I.S. (Figure 2). This interference was eliminated by switching MeCN to MeOH. A drawback to using MeOH as a mobile phase is higher system pressure compared to MeCN. During the run, the LC system pressure ranged from 2500 to 3500 psi. A representative chromatogram of LF and the I.S. from the final method is showed in Figure 3.
Chromatograms of lumefantrine and the I.S. with MeCN-water (55:45) containing 0.1% TFA as the mobile phase. Dash gray line represented a sample in mobile phase solvents, solid black line represented a sample in plasma. A peak interfering with the I.S. was observed from the plasma sample. Representative chromatogram of lumefantrine and the I.S. with MeOH-water containing 0.1% TFA as mobile phase in the final method. Dash gray line is for blank plasma, solid black line is for an LLOQ sample in plasma.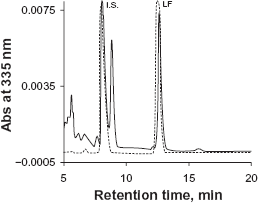
Sample preparation
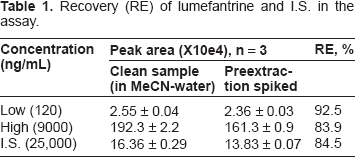
Recovery (RE) of lumefantrine and I.S. in the assay.
Method validation
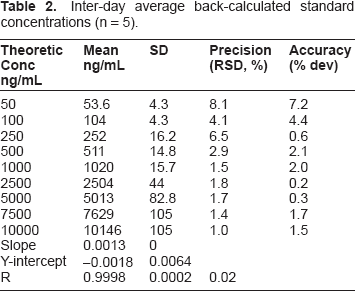
Inter-day average back-calculated standard concentrations (n = 5).
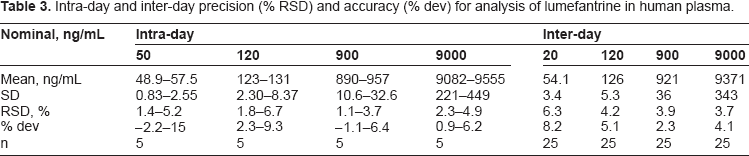
Intra-day and inter-day precision (% RSD) and accuracy (% dev) for analysis of lumefantrine in human plasma.
Specificity: We tested six different sources of human plasma and 12 potential concomitant drugs: nevirapine, lopinavir, ritonavir, zidovudine, lamivudine, efavirenz, chloroquine, sulfamethoxazole, trimethoprim, artemether, dihydroartemisinin, tenofovir. No significant interfering peaks were observed during the retention times of LF and I.S. at the wavelength of detection (λ = 335 nm), indicating high specificity and selectivity of the method (see supplemental data Figure S1 and S2).
Stability of lumefantrine plasma samples and stocks.
Application to pharmacokinetic study in healthy volunteers
The validated method was used to study the pharmacokinetic interaction of LF and an antiretroviral in 13 healthy volunteers. After 6 doses of Coartem® (480 mg LF twice daily), the plasma concentration—time profile over the period of 0-264 hr is shown in Figure 4. The precision and deviation for quality controls during analysis of LF samples is showed in Table 5. The method proved to be robust and reliable. The findings of this pharmacokinetic drug interaction study will be published separately.
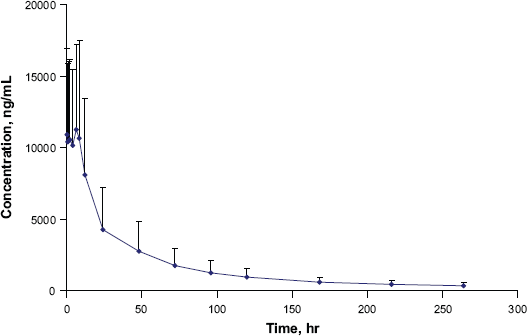
Plasma concentration—time profile of lumefantrine.
Method performance during clinical sample analysis.
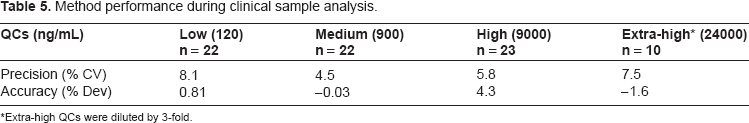
Extra-high QCs were diluted by 3-fold.
Conclusions
An HPLC-UV method for determination of LF in human plasma was developed based on a previously published method. 6 Fine tuning of the sample preparation method improved the recovery of LF significantly. Gradient elution followed by a wash phase with a high percentage of organic solvent minimized interference from carry-over impurities. TFA (0.1%), instead of phosphate salt, added to the mobile phase minimized peak tailing. The internal standard halofantrine used is readily available from commercial sources. This method was validated based on the ACTG guidelines, 7 which are based on FDA guidelines.
Disclosures
This manuscript has been read and approved by all authors. This paper is unique and not under consideration by any other publication and has not been published elsewhere. The authors report no conflicts of interest.
Footnotes
Acknowledgements
This work was supported by NIH/NIAID International Maternal Pediatric Adolescent AIDS Clinical Trials (IMPAACT) Group (grant number 1U01AI068632).
Supplemental materials
Partial volumes precision and accuracy for lumefantrine.
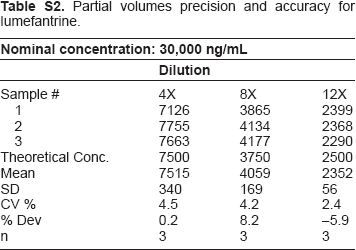
| Nominal concentration: 30,000 ng/mL | |||
|---|---|---|---|
| Dilution | |||
| Sample # | 4X | 8X | 12X |
| 1 | 7126 | 3865 | 2399 |
| 2 | 7755 | 4134 | 2368 |
| 3 | 7663 | 4177 | 2290 |
| Theoretical Conc. | 7500 | 3750 | 2500 |
| Mean | 7515 | 4059 | 2352 |
| SD | 340 | 169 | 56 |
| CV % | 4.5 | 4.2 | 2.4 |
| % Dev | 0.2 | 8.2 | −5.9 |
| n | 3 | 3 | 3 |