
Abstract
Gas chromatography with quadrupole time-of-flight mass spectrometry (GC-QTOFMS) and soft ionization generated by a rare-gas plasma is described here for the determination of various chlorophenoxy acid methyl esters and a few chlorinated herbicides. This plasma-based, wavelength-selectable ionization source, which can use Xe, Kr, Ar, Ne, or He as the plasma gas, enables ionization of GC-amenable compounds with ionization energies below 8.4, 10, 11.6, 16.5, or 22.4 eV, respectively. The advantages of soft ionization include enhanced molecular ions, reduced fragmentation, and reduced background noise as compared to electron ionization. In the study presented here for two plasma gases, we demonstrate that Kr plasma, which is softer than Ar plasma, yields molecular ions with a relative intensity >60% for 11 of the 16 test compounds. When using this “tunable” plasma to ionize the analytes, there is the possibility for selective ionization and less fragmentation, which may lead to increased sensitivity and may help structure elucidation, especially when using high-resolution mass spectrometry that generates accurate masses within a few parts per million (ppm) mass errors. Data generated with the Ar plasma and real matrices such as a peppermint extract, a plum extract, and an orange peel extract, spiked with 16 test compounds, indicate that the test compounds can be detected at 1-10 pg/µL of extract, and compounds such as menthone, limonene, eucalyptol, pinene, caryophylene, and other C15H24 isomers, which are present in the peppermint and the orange peel extracts at ppm to percent levels, do not appear to interfere with the determination of the chlorophenoxy acid methyl esters or the chlorinated herbicides, although there were matrix effects when the test compounds were spiked at 1-10 pg/µL of extract.
Keywords
Introduction
Many analytical methods have been published for the determination of chlorophenoxy acid methyl esters in environmental samples and foods. Such methods include gas chromatography with electron capture detection, 1 gas chromatography with either low- or high-resolution mass spectrometry (MS),2–6 and high-performance liquid chromatography interfaced with electrospray MS/MS6–10 or ion-mobility spectrometry. 11 Because such compounds need to be analyzed in a variety of sample matrices and require quantitation at low parts per billion concentrations, many sample preparation techniques have been developed as well. The reader may consult some of the references listed in the report by Pang et al 6 or Jafari et al 11 for details on the various sample preparation techniques, and Ref. 12 for an overview of analytical techniques as well as various derivatization methods for the chlorinated phenoxyacids.
This study was undertaken to explore the use of soft ionization gas chromatography with quadrupole time-of-flight mass spectrometry (GC-QTOFMS) in the identification of chlorophenoxy acid methyl esters, and thus to establish whether this “tunable” soft ionization source could be used for the determination of these compounds in real matrices. Soft ionization is achieved here with vacuum ultraviolet (VUV) light produced by a microplasma device based on a split-ring resonator. The specific emission wavelengths produced by the discharge, which typically comprise multiple resonance lines, were selected by choosing the plasma gas. Radiation with wavelengths in the range 104-150 nm, corresponding to photon energies between ~8 and ~12 eV, is commonly used. Although we present the mass spectral data for both soft ionization and 70-eV electron ionization (EI), the sensitivity data for 70-eV EI is not discussed here, as this study was not intended to be a side-by-side comparison of the two types of ionization sources.
Experimental
Chemicals and materials
A composited stock solution of the test compounds at 25-100 ng/µL in methyl tert-butyl ether (see Table 1) was obtained from Restek Corporation and was stored at 4°C. Serial dilutions (ie, at 10×, 100×, 1,000×, 10,000×, 20,000×, and 100,000×) of the stock solution were made in dichloromethane. Limonene, α-pinene, eucalyptol, α-thujone, caryophyllene, and mentone were obtained from Sigma-Aldrich. Spectroscopic-grade dichloromethane was from J.T. Baker. Ultrahigh purity (UHP) Ar (99.999%) and 10% Kr in He were purchased from Airgas USA, LLC. He used for GC analysis was of UHP grade from Airgas.
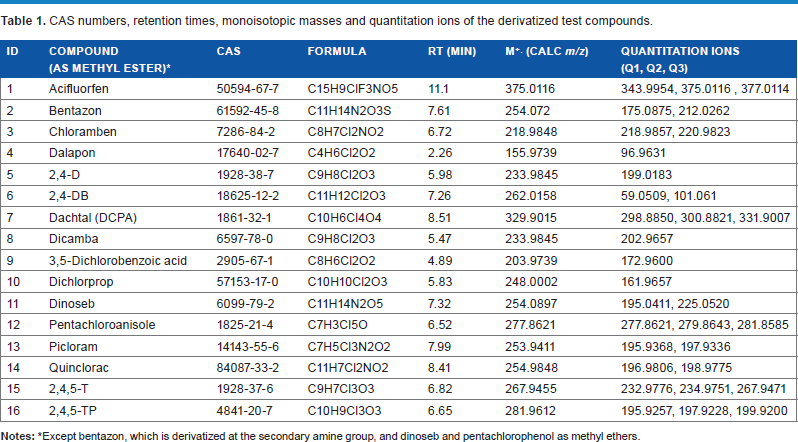
CAS numbers, retention times, monoisotopic masses and quantitation ions of the derivatized test compounds.
Notes:
Except bentazon, which is derivatized at the secondary amine group, and dinoseb and pentachlorophenol as methyl ethers.
Matrix preparation
The matrices chosen for evaluation included a dichloromethane extract of peppermint tea, a plum extract that was spiked with 100 pesticides including dacthal and many organochlorine and organophosphorus pesticides (the plum extract was in acetonitrile) at concentrations of 10-100 pg/µL of extract, and a dichloromethane extract of orange peel. The peppermint tea was an organic peppermint from Taylors of Harrogate (caffeine free) (www.taylorsofharrogate.co.uk). The extraction of peppermint tea was performed with dichloromethane in a closed vial, using occasional mixing on a vortex over a period of 24 hours. An amount of 0.7 g of tea was extracted with 3 mL of solvent. The extract was filtered using an Acrodisk syringe filter with a 0.2-µm PTFE membrane and was diluted 10-fold with dichloromethane before being split into three vials to be spiked with the test compounds at three different concentrations. The plum extract was prepared using QuEChERS 13 involving an initial extraction with water and acetonitrile, an extraction/partitioning step after the addition of salt, and a cleanup step with dispersive solid-phase extraction. The final plum extracts in acetonitrile were spiked with dacthal and the pesticides at 10, 20, 50, and 100 pg/µL of extract. The orange peel extract was prepared by soaking 20 g of orange peel with 40 mL dichloromethane overnight, and the extract was filtered through an Acrodisk syringe filter with a 0.2-µm PTFE membrane. The spiked orange peel extract was prepared by diluting the original extract 10-fold before spiking, and then adding a known volume of the stock solution containing the 16 test compounds.
GC-high-resolution QTOF mass spectrometer
The exact mass measurements were conducted with a GC-QTOF mass spectrometer (Agilent Model 7200) equipped with either a removable 70-eV EI source or a removable prototype microplasma photoionization (MPPI) source, operated in positive ion mode, and interfaced to an Agilent 7890 GC instrument. The QTOF mass spectrometer had a flight path of 2 m and was interfaced with a 4-GHz data acquisition system. Spectral data were acquired at a rate of 5 scans/s, and the mass range for data acquisition was m/z 50-600. The mass axis was calibrated daily using perfluorotributylamine (PFTBA), which was delivered to the MPPI source or the EI source via the GC-MS transfer line. The mass resolution of the QTOF mass spectrometer was >10,000 (full-width at half-maximum, FWHM) at m/z 271.9867.
The schematic of the MPPI source and other operational details are given elsewhere. 14 This windowless microplasma device uses rare gases at flow rates of 2-5 mL/min and is driven using ~1-2 W of RF (radio frequency) power at 2.5 GHz. The resulting plasma emits resonance radiation at specific wavelengths determined by the gas composition. The plasma gases used in this study were Kr with resonance lines at 10.03 and 10.64 eV, and Ar with resonance lines at 11.67 and 11.85 eV. The gaseous analyte flows through a channel in the plenum of the MPPI source, where it is irradiated with VUV light and thereby ionized. The sample ions are extracted from the MPPI source and collimated using electrostatic lenses in an approach similar to that used by the classic EI source. In order to change the plasma gas from Ar to Kr, the QTOF mass spectrometer is first calibrated with PFTBA using the Ar plasma, after which the Ar flow is stopped and the plasma is shut off. After the gas line is pumped down for a few minutes, the Kr valve is turned on followed by the ignition of the plasma. The change takes between 10 and 15 minutes.
The calibration standards and the spiked matrices were introduced via a 30 m × 0.25 mm id × 0.25 µm film thickness HP-5MS capillary column from Agilent Technologies. The oven temperature was programmed from 40 to 200°C at 30°C/min, and from 200 to 300°C at 4°C/min, where it was held for 3 minutes. Helium was used as the carrier gas at a flow rate of 1.5 mL/min. The injector temperature was 285°C, the source temperature was 230°C, and the GC-MS transfer line temperature was 300°C. The injector, fitted with a double tapered liner, was set in the splittless mode.
Data processing was performed using the MassHunter qualitative analysis software (Agilent Technologies, version B.05.00), and possible ion formulae were obtained using the Qual Formula Calculator algorithm incorporated in the software. The option “odd-electron” ion was selected for the molecular ion (if present) and “odd- and even-electron ion” was selected for the fragment ions.
Results and Discussion
Figure 1 shows a GC-QTOF total ion chromatogram of the 16 test compounds using a 30-m HP-5MS capillary column and the Ar plasma. Fourteen compounds are fully resolved chromatographically on the HP-5MS capillary column. 2,4-DB methyl ester (peak 6) and the dinoseb methyl ether (peak 11) slightly overlap, but they can be easily identified because there are no overlapping fragment ions with the same mass-to-charge (m/z) ratio. The retention times of the 16 test compounds are given in Table 1, together with the CAS numbers, chemical formulae, the calculated m/z values for the monoisotopic mass of each test compound, and the quantitation ions used in this study. A DB-5MS capillary column of the same dimensions as the HP-5MS column was used to analyze the spiked orange peel extracts using the same GC operating conditions. The elution order of the 16 test compounds from the DB-5MS column is the same as on the HP-5MS column with the exception of 2,4-DB and dinoseb. On the HP-5MS column, 2,4-DB methyl ester elutes before bentazon methyl derivative, whereas on the DB-5MS column the elution order of the two compounds is reversed. During the study, we had to replace the HP-5MS capillary column because the HP-5MS capillary column was inadvertently broken when removing the MPPI source for troubleshooting. Although the HP-5MS and the DB-5MS capillary columns have the same dimensions in terms of length, internal diameter, and film thickness, and in principle they are equivalent because they use the same stationary phase consisting of 5% phenyl and 95% methylsiloxane, they do not give identical performance in terms of analyte elution order, as shown here for 2,4-DB methyl ester and bentazon methyl. The slight difference in performance between these low-bleed columns appears to be due to the fact that the HP-5MS column is coated with 5% phenyl/95% methylsiloxane stationary phase whereas the DB-5MS is coated with 5% phenyl/95% methyl arylenesiloxane.
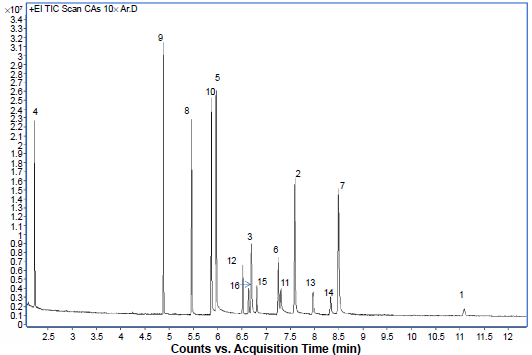
GC-QTOFMS chromatogram of the 16 chlorinated acid methyl esters analyzed using the MPPI source with Ar as plasma gas (conc. 2.5-10 ng/µL).
The discussion below will focus on the spectrum quality, the sensitivity of the ionization source for this particular class of compounds, and their detection in real matrices.
Spectrum quality.
Figure 2 shows the mass spectra of dacthal and 2,4,5-TP methyl ester obtained with this soft ionization source using Kr and Ar plasmas. For both compounds, the molecular ion is the base peak on the Kr-MPI spectra and decreases in intensity, yielding fragment ions with Ar-MPPI. When there were only a few fragment ions in the Ar-MPPI spectra, we were able to search these spectra using the NIST library of low-resolution mass spectra and obtain compound identification. The NIST scores for dacthal and 2,4,5-TP were 82.76 and 76.82, respectively. Other compounds identified via NIST library search (score given in parentheses) include methyl esters of dichlorprop (81.66), 3,5-dichlorobenzoic acid (81.12), dicamba (68.24), chloramben (71.61), 2,4,5-T (63.57), 2,4-DB (70.85), picloram (62.74), and quiclorac (60.7). In order to obtain more fragmentation, Ne plasma is the next choice, and experiments done in our laboratory on a set of organic compounds concluded that fragmentation using Ne plasma is very similar to that while using 70-eV EI.
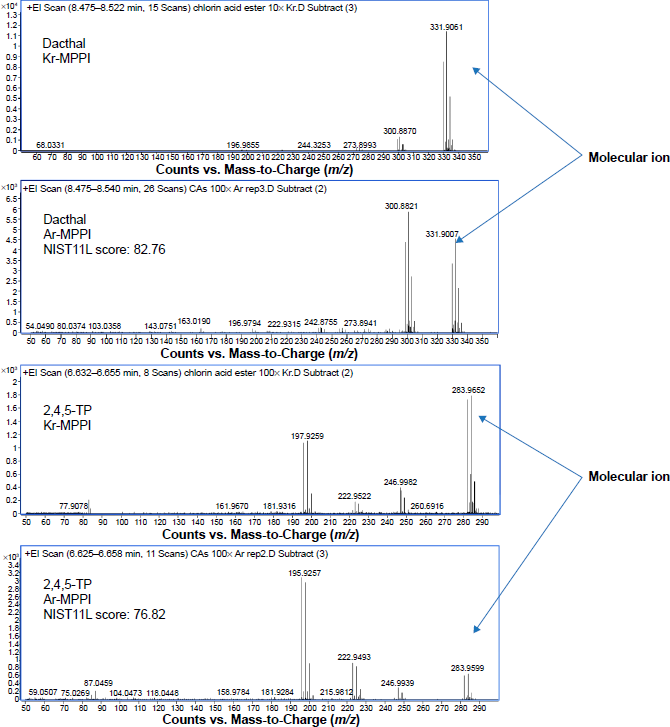
Kr- and Ar-MPPI spectra for dacthal and 2,4,5-TP methyl ester.
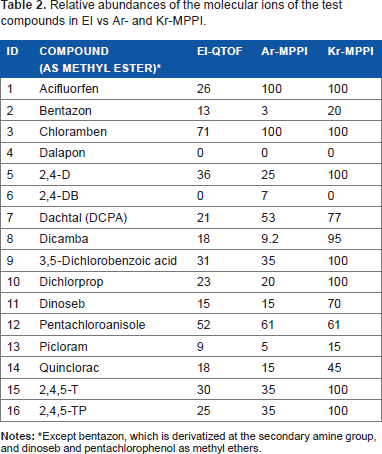
Along with the 70-eV EI, the Ar-MPPI and the Kr-MPPI spectra for each compound, in the order in which they are listed in Table 1, are given in the supplementary material. Table 2 summarizes the relative intensities of the molecular ions for 70-eV EI, Ar-MPPI, and Kr-MPPI. Because the Kr plasma has resonance lines at 10.06/10.64 eV and is softer than the Ar plasma (resonance lines at 11.62/11.83 eV), which is itself softer than the 70-eV EI, most of the methyl derivatives of the test compounds exhibit abundant molecular ions when ionized with the Kr plasma. For example, 11 (ie, methyl esters of acifluorfen, chloramben, 2,4-D, dicamba, 3,5-dichlorobenzoic acid, dichlorprop, 2,4,5-T and 2,4,5-TP; and dacthal, dinoseb methyl, and pentachloroanisole) of the 16 test compounds yield molecular ions with a relative intensity >60% (Table 2) with the Kr plasma. This is not surprising because 10 compounds have similar structures consisting of a phenyl ring substituted with 2-5 Cl atoms, carboxymethyl, methoxy, amino, and ether functional groups, except dinoseb methyl ether with two nitro groups and a sec-butyl group. Acifluorfen is a diphenyl ether substituted with a Cl, nitro, trifluoromethane, and carboxymethyl group. The other five compounds that exhibit more fragmentation with the Kr plasma include quinclorac methyl (a chlorinated quinoline with a carboxymethyl group), which yields a molecular ion with 45% relative intensity; picloram methyl (a chlorinated aminopyridine with a carboxymethyl group), which yields a weak (~20%) molecular ion; and bentazon methyl (a 2,1,3-benzothiadiazin-4-one-2,2-dioxide substituted with a methyl and an isopropyl group), which also yields a weak molecular ion. Dalapon (dichloropropionic acid) and 2,4-DB (dichlorophenoxybutanoic acid) methyl esters do not exhibit a molecular ion at all with the Kr plasma, most likely because of the formation of a stable tertiary carbonium ion in the case of dalapon and polarization of the phenoxy O–C bond aided by inductive electron withdrawal of the Cl on the phenyl ring.
Relative abundances of the molecular ions of the test compounds in EI vs Ar- and K-MPPI.
Notes:
Except bentazon, which is derivatized at the secondary amine group, and dinoseb and pentachlorophenol as methyl ethers.
As the ionization energy is increased to 11.6/11.8 eV in the case of the Ar plasma, more fragment ions appear in the mass spectra and specific fragmentation patterns begin to emerge for these compounds. For example, elimination of a Cl radical in the case of methyl esters of dicamba, 2,4-D, and 2,4,5-T and that of the methoxy group in the case of methyl esters of acifluorfen, chloramben, 3,5-dichlorobenzoic acid, and tetrachloroterephthalic acid (ie, this methyl ester is known as dacthal) were observed. Interestingly, in the case of dichlorprop and 2,4,5-TP methyl esters, the base peak in the Ar spectrum corresponds to the chlorinated phenol cation formed by the elimination of methyl acrylate from the molecular ion. Likewise, elimination of 2-propenyl acetate in the case of 2,4-DB methyl ester yields a weak 2,4-dichlorophenol ion at m/z 161.9678. However, the most abundant ions in the mass spectrum of 2,4-DB methyl ester are the ions at m/z 101.0610 and 59.0509, corresponding to the (CH2)3COOCH3 and carboxymethyl cations, respectively. This leads us to the conclusion that, by increasing the number of methylene groups attached to the phenoxy ring, the fragmentation pattern is quite different from those of the other chlorophenoxy acid methyl esters.
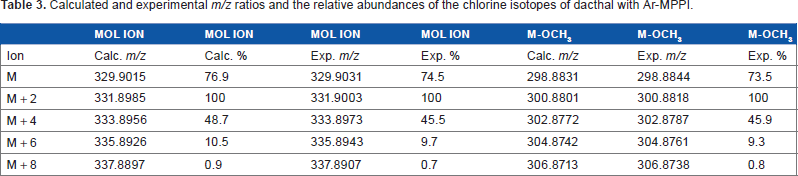
Typical variations in the m/z ratios of the Cl isotopes and their relative abundances are shown in Table 3 for dacthal. The mass errors for the various isotopes of the molecular ion of dacthal are in the range 0.0010-0.0016 u, and for its corresponding M-OCH3 fragment ion it was 0.0013-0.0020 u. The relative abundances of the Cl isotopes are typically within <10% from the theoretical values given in Ref. 15.
Calculated and experimental m/z ratios and the relative abundances of the chlorine isotopes of dacthal with Ar-MPPI.
Sensitivity and linearity of the Ar MPPI source
Table 4 summarizes the slopes of the calibration curves, the linear regression correlation coefficients (reported as R 2 ), the noise level reported as root-mean-squared (rms) noise, and the signal-to-noise (S/N) values for each test compound. The highest sensitivity, defined as the highest slope of the calibration curve, was exhibited by pentachloroanisole, and the lowest sensitivity by bentazon and acifluorfen. All calibration curves were linear at least over three orders of magnitude in concentration. The S/N values, which are at least 20, indicate that most chlorinated acid methyl esters can be detected at 1-5 pg per injection into the GC and a few of them (ie, pentachloroanisole and 2,4,5-T) even at subpicogram levels. Figure 3 shows the S/N values and the noise levels for 3,5-dichlorobenzoic acid and two calibration curves performed at 1-week interval. The noise levels for three replicate injections at 0.5 pg/µL were 4.0, 2.8, and 6.4 counts, and the S/N values were 83, 89, and 50, respectively. The ratio of the slopes of the calibration curves performed at 7-day intervals with the same calibration solutions was 0.94, which is well within the measurement error for such type of analyses. Overall, the determination of the chlorinated acid methyl esters by GC-QTOFMS with the Ar plasma delivers instrument detection levels at low picogram levels per injection into the GC.
Sensitivity, linearity and signal-to-noise (S/N) data for the test compounds (Ar-MPPI).
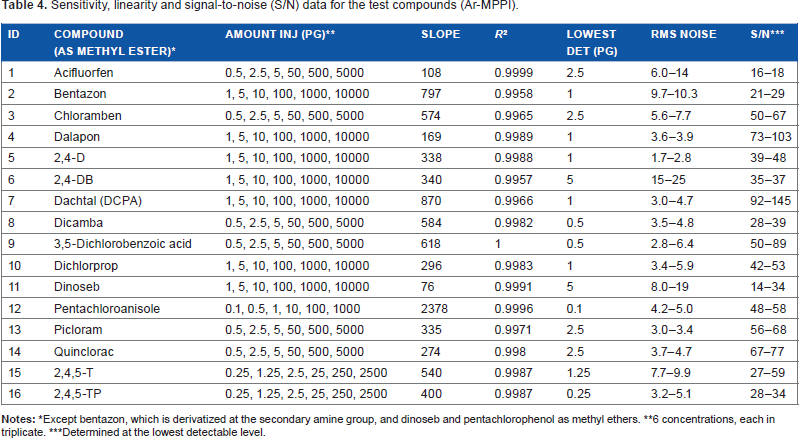
Notes:
Except bentazon, which is derivatized at the secondary amine group, and dinoseb and pentachlorophenol as methyl ethers.
6 concentrations, each in triplicate.
Determined at the lowest detectable level.
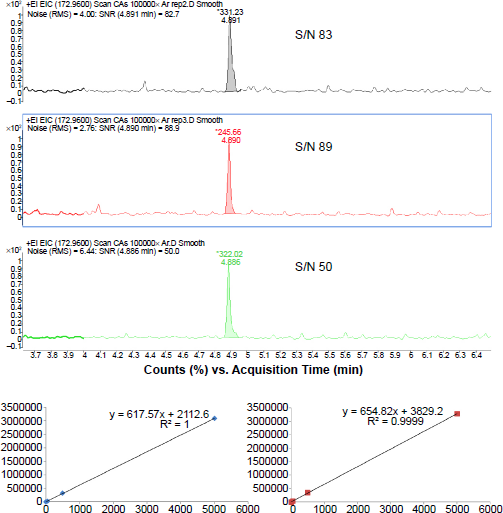
S/N and calibration data for 3,5-dichlorobenzoic acid methyl ester (conc. 0.5; 2.5, 5.0, 50, 500, and 5,000 pg/µL; vol. injected 1 µL The two calibrations were performed at 1-week interval).
Spiked matrix analyses
Table 5 summarizes the slopes of the calibration curves and the linear regression correlation coefficients for the peppermint tea extracts spiked with the test compounds at three concentrations. The matrix effect can be quantified by how much the slope of the calibration curve for the spiked peppermint matrix differs from the slope of the calibration curve for the reference standards. The calibration curve for the spiked peppermint extract is linear over the three concentrations for eight of the test compounds for which the ratios of the slopes of the spiked matrix to the standards curve are between 0.72 and 1.09. For the remainder of the test compounds spiked into the peppermint tea extract, the ratios of the slopes were either too low (ie, 0.35-0.65) or too high (ie, 1.56-1.96). One of the compounds in the low ratio category is dacthal, for which the ratio in the peppermint extract spiked at 10, 100, and 1,000 pg/µL was 0.54. The corresponding ratios for dacthal spiked in the plum matrix, in the presence of 100 other pesticides at 10, 20, 50 and 100 pg/µL, were 1.58, 1.08, 1.05, and 0.44, respectively. In both cases, the higher spike level tends to suppress the detector signal, but it is difficult to speculate why.
Matrix effect for the 16 chlorinated acid esters spiked into the peppermint extracts (Ar-MPPI).
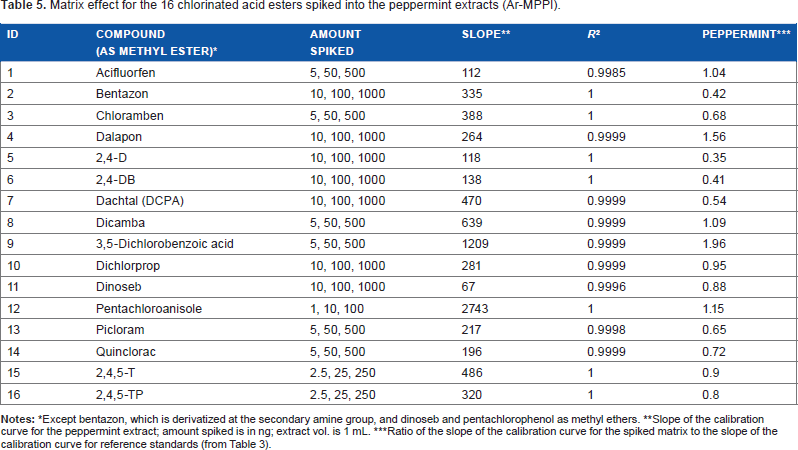
Notes:
Except bentazon, which is derivatized at the secondary amine group, and dinoseb and pentachlorophenol as methyl ethers.
Slope of the calibration curve for the peppermint extract; amount spiked is in ng; extract vol. is 1 mL.
Ratio of the slope of the calibration curve for the spiked matrix to the slope of the calibration curve for reference standards (from Table 3).
Table 6 shows the data for the orange peel extract spiked at two concentrations (1-10 and 100-1,000 ng/µL of extract). In this case, spiking was done only at two concentrations; therefore, to get an indication of the matrix effect, we compared the extracted ion currents (EICs) for the spiked orange peel extract with the corresponding calibration standard using the quantitation ions specified in Table 1. The ratios for the orange peel extracts spiked at the high concentrations (100-1,000 ng/µL of extract) were in the range 1.02-1.10 (see Table 6), indicating excellent agreement between the matrix and the standard. At lower spike levels (1-10 ng/µL of extract), the ratios ranged from 0.7 to 1 for eight compounds, and 0.48 to 0.59 for the other eight compounds. The reproducibility of the measurement (given as %RSD in Table 6) as determined from three consecutive injections of the spiked orange peel extract at the low spike level ranged from 2.5% to 27%, averaging 11.6%, which is typical for these type of measurements. Ten compounds exhibited RSDs between 2.5% and 8.2%, with the remaining compounds showing RSDs between 11% and 27%. Despite some signal variation for the spiked matrix, the shift in the retention time for all spiked matrices was <0.01 minute, and the mass shift was in the range 0.001-0.002 u.
Matrix effect for the 16 chlorinated acid esters spiked into the orange peel extracts.
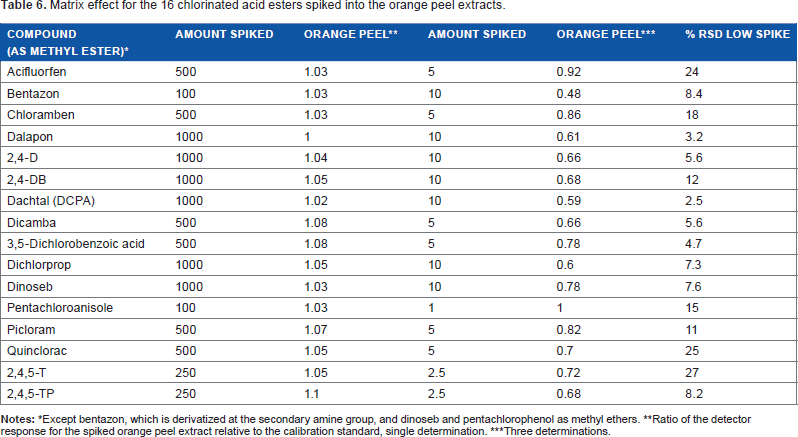
Notes:
Except bentazon, which is derivatized at the secondary amine group, and dinoseb and pentachlorophenol as methyl ethers.
Ratio of the detector response for the spiked orange peel extract relative to the calibration standard, single determination.
Three determinations.
The orange peel extract contained percent levels of limonene, and, despite all this, there was no shift in the retention times of the 16 test compounds in the spiked matrix relative to the reference standard, except for the switch in the elution order of 2,4-DB methyl ester and bentazon methyl, as shown in Figure 4, which occurred for both the matrix and the reference standard because a DB-5MS column was used for these measurements.
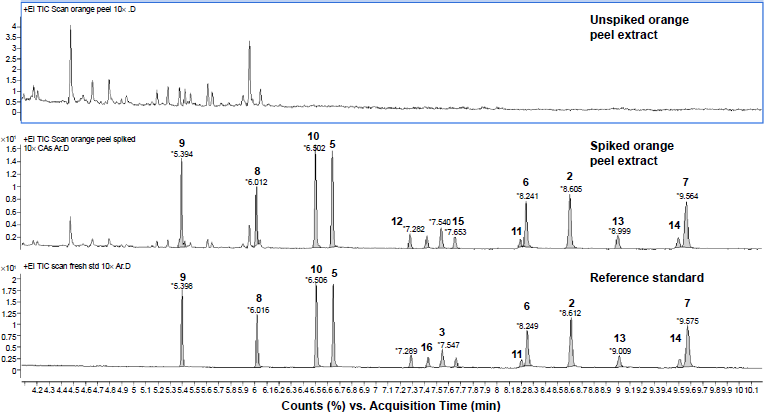
TICs of the unspiked orange peel extract, orange peel extract spiked with the 16 chlorinated acids, and the reference standard of the 16 chlorinated acids. Concentrations are in the range 2.5-10 ng/µL. The TICs do not show limonene because the peak is saturated. Also not shown are dalapon at 2.64 minutes and acifluorfen at 12.7 minutes. The chromatograms were obtained with a DB-5 MS capillary column (same GC conditions), so there is a slight increase in the retention time of all compounds as compared to the HP-5MS capillary column. Dinoseb before 2,4-DB on the DB-5MS capillary column.
Conclusions
Soft ionization using an Ar plasma and a high-resolution QTOF mass spectrometer allowed the detection of low picogram levels of chlorinated acid methyl esters when spiked in real matrices such as a peppermint tea extract, a plum extract, and an orange peel extract. The calibration curves were linear over three orders of magnitude in concentration, and the average S/N levels at the 0.1-2.5 pg per injection ranged from 14 to 120. Because the Kr plasma is softer than the Ar plasma, which is softer than EI, 11 of the 16 methyl derivatives of the test compounds exhibited abundant (>60%) molecular ions when ionized with the Kr plasma. Although this study focused only on a set of methyl esters of chlorinated acids, the group-specific fragmentation discussed here can be applied to other similar chlorinated acids, and may be of interest in untargeted analysis. In such a case, a molecular formula would be generated from the accurate mass of the odd-electron molecular ion that is most likely to be found with the Kr plasma, and the chemical structure would be derived from the fragment ions generated with the Ar plasma, which was shown to yield more fragmentation, and thus more information, from which chemical structure can be established. For quantitation purposes, we recommend the Ar plasma over the Kr plasma because at lower ionization energies there is at least an order of magnitude decrease in the detector signal despite the fact that most of the ion current is retained by the molecular ion.
Author Contributions
Conceived and designed the experiments: VLA. Analyzed the data: VLA. Wrote the first draft of the manuscript: VLA. Contributed to the writing of the manuscript: VLA, RU. Agree with manuscript results and conclusions: RU. Jointly developed the structure and arguments for the paper: VLA, RU. Made critical revisions and approved final version: RU. Built prototype MPPI source: PR. All authors reviewed and approved of the final manuscript.
Footnotes
Acknowledgments
The authors would like to acknowledge James Cooley (formerly with Agilent Technologies) for the design of several prototypes of the MPPI source, and George Yefchak and August Hidalgo for the MPPI source control software. The microplasma chip was fabricated by Martin Guth, formerly with Agilent Technologies. Melissa Churley of Agilent Technologies prepared the spiked plum extracts.