
Abstract
Caduet tablets are novel prescription drug that combines amlodipine besylate (AM) with atorvastatin calcium (AT). A spectrofluorimetric and an HPLC-fluorescence detection methods were developed for simultaneous determination of both drugs in tablets. In the spectrofluorimetric method, native fluorescence of AM and AT were measured in methanol at 442 and 369 nm upon excitation at 361 and 274 nm, respectively. The emission spectrum of each drug reveals zero value at the emission wavelength of the other drug, thus allowing their simultaneous determination without interference. In the HPLC method, separation of AM and AT was achieved within 8 minutes on a C18 column using acetonitrile:phosphate buffer (0.015 M, pH 3) (45:55, v/v) as the mobile phase. Fluorescence detection was carried out using excitation wavelengths 361 and 274 nm and emission wavelengths 442 and 378 nm for AM and AT, respectively. Excellent linearity was observed. Careful validation proved advantages of the new methods: high sensitivity, accuracy, selectivity and suitability for quality control laboratories.
Introduction
Amlodipine besylate (AM) (Fig. 1A) is a long-acting calcium channel blocker of dihydropyridine class that is used as an antihypertensive drug and in the treatment of angina pectoris. It inhibits the transmembrane influx of calcium ions into vascular smooth muscle and cardiac muscle thereby reducing blood pressure and increasing blood flow to the heart muscle. It is chemically described as 3-ethyl-5-methyl (4RS)-2-(2-aminoethoxymethyl)-4-(2-chlorophenyl)-1,4-dihydro-6-methylpyridine-3,5-dicarboxylate benzenesulfonate. 1
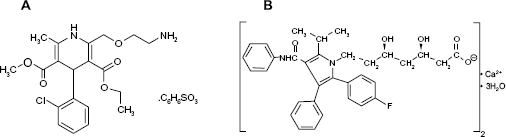
Chemical structures of AM (A) and AT (B).
Atorvastatin calcium (AT) (Fig. 1B) acts by competitively inhibiting 3-hydroxy-3-methylglutaryl coenzyme A (HMG-CoA) reductase that catalyzes the rate limiting step in hepatic cholesterol biosynthesis. Inhibition of the enzyme decreases level of low-density lipoprotein (LDL) cholesterol in blood. The primary use of AT is for treatment of hyperlipidemia and prophylaxis of cardiovascular diseases in patients with multiple risk factors. It is chemically designated as calcium (βR,δR)-2-(p-fluorophenyl)-β,δ-dihydroxy-5-isopropyl-3-phenyl-4-(phenylcarbamoyl) pyrrole-1-heptanoic acid (1:2) trihydrate.1,2
Caduet is a novel prescription tablets that combine both drugs, AM and AT and used for treatment of patients with hyperlipidemia and either hypertension or angina.
Several analytical methods have been described in literature for the simultaneous determination of AM and AT in binary mixture. HPLC with UV detection is the most widely used tool for the analysis of both drugs.3–5 Other reported methods include LC/MS,6,7 capillary electrophoresis, 8 high performance thin layer chromatography, 9 spectrophotometry,10–12 and voltammetry. 13
From the above-cited literature, it is obvious that the majority of recently published analytical methods have focused on HPLC with UV detection and spectrophotometric methods. However, there is neither a spectrofluorimetric method nor an HPLC-fluorescence detection method that has been reported for the simultaneous determination of AM and AT in the same pharmaceutical formulation. Furthermore, most of the previously published methods are both solvent- and time-consuming; thus, there is an urgent need for more rapid, sensitive, and less complicated methods that enable the simultaneous quantification of both drugs in tablets.
Accordingly, the main objective of this investigation was to develop and validate two new methods: spectrofluorimetry and HPLC coupled with fluorescence detection for the simultaneous determination of AM and AT in pure form and in tablets, offering better sensitivity than the previously reported methods.
Experimental
Chemicals and standards
AM pure sample was kindly provided by Alpha-Chem Advanced Pharmaceutical Industries SAE (ACAPI), Cairo, Egypt, was analyzed and found to be 100.37%. 14 AT was supplied by Delta Pharma Company, Ramadan City, Cairo, Egypt and its purity was certified to be 99.37%. Caduet tablets (Batch No. 1012031 and C11139, Pfizer, Cairo, Egypt) were purchased from local market and were labeled to contain 10 mg amlodipine base (equivalent to 13.87 mg amlodipine besylate) and 10 mg atorvastatin base (equivalent to 10.83 mg atorvastatin calcium). o-Phosphoric acid, HPLC grade of methanol and acetonitrile were purchased from Sigma-Aldrich Chemie, Steinheim, Germany. Potassium dihydrogen phosphate (ADWIC, Cairo, Egypt) was used.
Instrumentation and Chromatographic conditions
Fluorescence spectra were recorded and intensity measurements were made on RF-1501 spectrofluorimeter (Shimadzu, Kyoto, Japan). A pH meter model 3505 (Jenway, Staffordshire, UK) was used for all pH measurements. Chromatography was performed using HPLC system equipped with a solvent delivery (LC-10AD, Shimadzu, Kyoto, Japan), a system controller model CBM-20A Communications BUS module and a spectrofluorimetric detector (RF-551) with excitation wavelengths (λex) set at 361 and 274 nm and emission wavelengths (λem) set at 442 and 378 nm, for AM and AT, respectively. Chromatographic separation was achieved on Waters C18 column (250 × 4.6 mm, i.d.) packed with 5 μm particle size (Milford Massachusetts USA). The mobile phase was composed of acetonitrile: phosphate buffer (0.015 M, pH 3, adjusted with o-phosphoric acid) (45:55, v/v) and pumped at 1 mL min−1 flow rate. A glass vacuum-filtration apparatus was employed for the filtration of the mobile phase using 0.45 μm membrane filter (Sartorius Stedim Biotech GmbH, Goettingen, Germany). The HPLC method was carried out at room temperature, at the Center of Applied Research and Advanced Study (CARAS) in the Faculty of Pharmacy, Cairo University.
Standard solutions
Spectrofluorimetric method
AM and AT stock solutions (equivalent to 200 μg mL−1 base) were prepared in methanol. Dilution of appropriate volumes of stock solutions was carried out to obtain the corresponding working standard solutions, having concentrations (equivalent to 20 μg mL−1 base).
Hplc method
AM and AT working standard solutions (equivalent to 500 μg mL−1 base) were prepared in methanol.
General Procedure and linearity
Spectrofluorimetric method
Accurately measured aliquots of AM and AT working standard solutions equivalent to (5-100 μg) were transferred separately into 2 series of 10 mL volumetric flasks. The volume was completed to 10 mL with methanol. The emission spectra were recorded from 220 to 900 nm and the native fluorescence intensity was measured at λem 442 and 369 nm using λex 361 and 274 nm for AM and AT, respectively. A linear calibration curve was obtained for each drug by plotting the fluorescence intensity against the corresponding concentration of the drug and the regression equations were computed.
Hplc method
Into two series of 10 mL volumetric flasks, accurately measured aliquots of AM and AT working standard solutions equivalent to (50-2000 μg) were transferred separately and the volume was completed with methanol. Each solution was injected in triplicate (20 μL) and chromatographed under the previously specified conditions. Peak areas were then plotted against the corresponding concentrations of each drug to obtain the calibration graphs and the regression equations were computed.
Analysis of Pharmaceutical tablets
Fifteen tablets were accurately weighed and finely powdered. Two portions of the powder were accurately weighed: the first portion was equivalent to 20 mg AM base and 20 mg AT base for the spectrofluorimetric method, and the second portion was equivalent to 25 mg AM base and 25 mg AT base for the HPLC method, and then the first portion was transferred to a 100 mL volumetric flask and the second portion to a 50 mL volumetric flask. The powder was extracted with 30 mL methanol with the aid of shaking and the volume was completed using the same solvent. The solutions were then filtered through 0.45 μm nylon syringe filter, followed by dilution of the filtrate to the specified concentration range and then treated as described under “General procedure and linearity.”
Results and Discussion
Method development
Spectrofluorimetric method
Both AM and AT exhibited native fluorescence in their methanolic solutions. The effect of diluting solvent was checked and different solvents were investigated including water, 0.1 M acetic acid, methanol and ethanol. Methanol was found to be the best solvent in terms of sensitivity of measurement and stability of readings. Methanolic solution of AM showed emission fluorescence at 442 nm upon excitation at 361 nm while methanolic solution of AT showed fluorescence emission at 369 nm upon excitation at 274 nm (Fig. 2A and B). The proposed method allowed the simultaneous determination of both drugs based on the fact that each drug has its specific excitation wavelength at which the coformulated drug reveals no fluorescence emission. Figure 3A reveals that AM has λex at 361 nm and λem at 442 nm while AT has no emission at 442 nm. Similarly, Figure 3B reveals that AT has λex at 274 nm and λem at 369 nm while AM has no emission at 369 nm. The absence of overlap between the emission fluorescence of both drugs proved the selective quantification of each drug in binary mixture without previous separation.
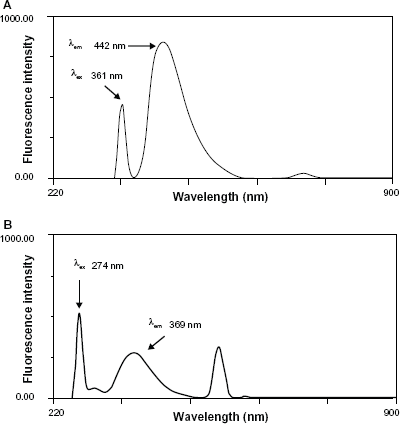
Excitation and emission spectra of AM (10 μg mL−1) (λex 361 nm, λem 442 nm) (A) and of AT (10 μg mL−1) (λex 274 nm, λem 369 nm) (B) in methanol.
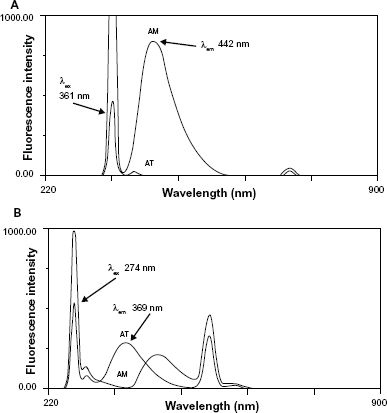
Excitation and emission spectra of AM (10 μg mL−1) and AT (10 μg mL−1) at λex 274 nm (A) and at λex 361 nm (B).
HPLC method
Good separation was achieved after screening a series of mobile phases. The suitability of mobile phase was decided on the basis of selectivity, sensitivity of the assay and separation among the coformulated drugs.
Type of Organic modifier
Initial efforts to develop a separation method using an isocratic elution system with a methanol-based mobile phase were unsuccessful: the compounds peaks could not be separated efficiently. On the other hand, acetonitrile was the organic modifier of choice as it improves the resolution on the stationary phase.
Effect of pH
Changing the pH of the mobile phase had an effect on the resolution of AM and AT. Therefore, the chromatographic conditions were optimized as a function of a mobile phase composed of acetonitrile and phosphate buffer (0.015 M) of different pH. A mobile phase of pH 3 was the most appropriate one. Different ratios of acetonitrile and the buffer were tested. The results illustrated that a ratio of acetonitrile:phosphate buffer (0.015 M, pH 3) of (45:55, v/v) was the most effective one. These conditions gave optimum resolution, clear baseline separation with reasonable retention time and no tailing of peaks of the studied drugs (Fig. 4).
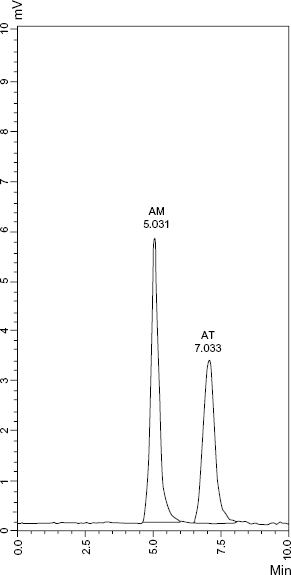
HPLC chromatogram of AM (200 μg mL−1) and AT (200 μg mL−1) using fluorescence detection (λex 361 nm, λem 442 nm for AM and λex 274 nm, λem 378 nm for AT).
Effect of Flow rate
The effect of flow rate on retention time of the peaks of the drugs was investigated. A flow rate of 1 mL min−1 was optimal for good separation in analysis time of less than 10 minutes.
Therefore, the optimum conditions could be summarized as: mobile phase composed of acetonitrile: phosphate buffer (0.015 M, pH 3) (45:55, v/v) at a flow rate of 1 mL min−1. Fluorescence detection was set at λex of 361 nm and 274 nm and λem of 442 nm and 378 nm for AM and AT, respectively. Good resolution was achieved with retention time 5.031 and 7.033 for AM and AT, respectively.
Method validation
The developed methods were validated in terms of guidelines of International Conference on Harmonization (ICH) for validation of analytical procedures. 15
Linearity and range
The linearity of the developed methods was evaluated by analyzing six concentrations of AM and AT in triplicate. The assays were performed according to the previously established experimental conditions for each method. Linear correlations between either the fluorescence intensity or the peak area and the corresponding concentrations of each drug were obtained over the ranges stated in Table 1 for the spectrofluorimetric and HPLC methods, respectively. The least squares linear regression analysis was adopted and the regression equations were then computed. The high values of correlation coefficients (>0.999) with small intercepts indicate good linearity of the calibration graphs. Statistical analysis of the data gave small values of the standard error of the estimation, as revealed in Table 1.
Assays parameters and methods validation for the determination of AM and AT.
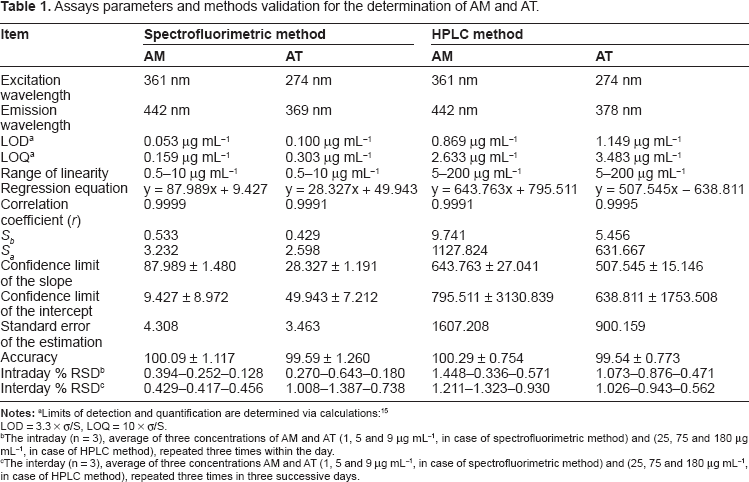
The intraday (n = 3), average of three concentrations of AM and AT (1, 5 and 9 μg mL−1, in case of spectrofluorimetric method) and (25, 75 and 180 μg mL−1, in case of HPLC method), repeated three times within the day.
The interday (n = 3), average of three concentrations AM and AT (1, 5 and 9 μg mL−1, in case of spectrofluorimetric method) and (25, 75 and 180 μg mL−1, in case of HPLC method), repeated three times in three successive days.
Accuracy
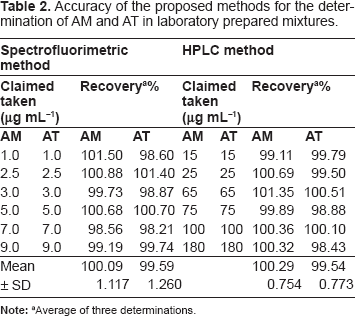
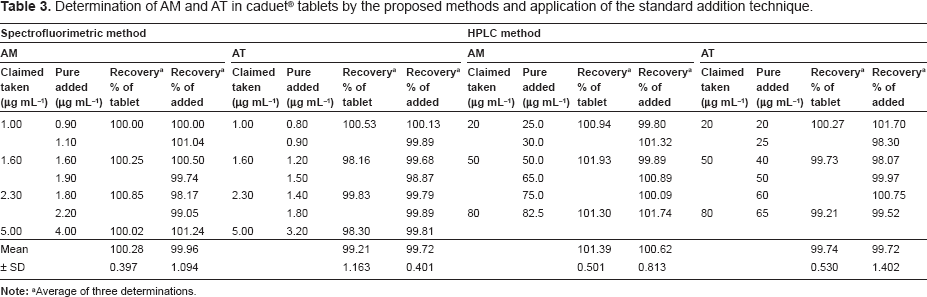
Accuracy is assessed by the proximity of the obtained value to the true value. The accuracy of the results was checked by applying the proposed methods for the determination of laboratory prepared mixtures containing AM and AT in pure form (in a ratio similar to that of the pharmaceutical dosage form). The percentage recoveries and their standard deviation for three replicates were calculated using the corresponding regression equations, Table 2. Furthermore, the validity of the suggested methods was checked by applying the standard addition technique, which was performed by adding known amounts of the studied compounds to a known concentration of the commercial product, Table 3. According to the results revealed in Tables 2 and 3, good accuracy was observed for the proposed methods and there is no interference from coformulated drug or the frequently encountered tablet excipients.
Accuracy of the proposed methods for the determination of AM and AT in laboratory prepared mixtures.
Determination of AM and AT in caduet® tablets by the proposed methods and application of the standard addition technique.
Precision
Each drug was assayed at three concentration levels as described above under “General procedure and linearity”. Assays were repeated three times within the same day to determine the repeatability (intraday precision) and three times on three different days to determine the intermediate precision (interday precision). As revealed in Table 1, the percentage relative standard deviation (% RSD) of intraday precision ranged between 0.128 and 1.448 and that of the interday precision ranged between 0.417 and 1.387. These results indicate high precision of the proposed methods.
Limit of Detection and Limit of quantification
Limit of detection (LOD) and limit of quantification (LOQ) were calculated according to the following equations:

System Suitability Tests for Hplc method
System suitability tests were used to verify that the resolution and reproducibility were adequate for the performed analysis. The system suitability tests included number of theoretical plates, resolution, peak tailing, capacity factor and selectivity factor. Results are revealed in Table 4.
System suitability results of the proposed HPLC method.
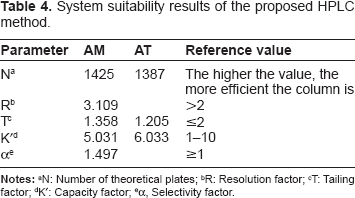
R: Resolution factor;
T: Tailing factor;
K': Capacity factor;
α, Selectivity factor.
Application of the Proposed Methods to the Determination of tablets
The proposed methods were applied successfully for the determination of the studied drugs in their coformulated pharmaceutical dosage form. Satisfactory results were obtained (Table 3). Hence, the proposed methods are applicable for the routine simultaneous estimation of AM and AT in tablet form.
Statistical analysis
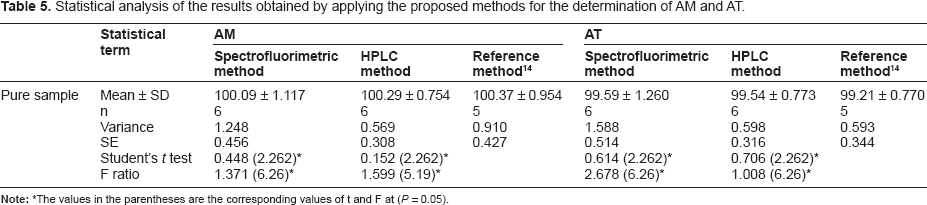
Reference method 14 was applied on pure samples and the results were compared by those obtained by applying the developed methods by statistical analysis. It was concluded that with 95% confidence, there is no significant difference between them, since the calculated t and f values are less than the theoretical values, proving similar accuracy and precision in the determination of AM and AT by both methods (Table 5).
Statistical analysis of the results obtained by applying the proposed methods for the determination of AM and AT.
Conclusion
Two new, simple and sensitive methods were explored for the simultaneous determination of AM and AT in pure form and in tablets. The spectrofluorimetric method and HPLC method using florescence detection, by virtue of their high sensitivity, could be applied to the analysis of both drugs in their coformulated dosage forms. It was possible to measure concentrations as low as (0.5 and 5 μg mL−1) for both drugs with good accuracy. Both the methods were validated as per ICH guidelines. Moreover, the proposed methods are reproducible and time saving and could be applied for routine analysis of both drugs in quality control laboratories.
Footnotes
Author Contributions
Conceived and designed the experiments: BAM, AAZ, MAM. Analysed the data: BAM, AAZ, MAM, MSA. Wrote the first draft of the manuscript: MAM. Contributed to the writing of the manuscript: BAM, MAM. Agree with manuscript results and conclusions: BAM, AAZ, MAM, MSA. Jointly developed the structure and arguments for the paper: BAM, AAZ, MAM. Made critical revisions and approved final version: BAM, AAZ, MAM, MSA. All authors reviewed and approved of the final manuscript.
Funding
This work was financially supported by the research committee in Faculty of Pharmacy, Cairo University.
Competing Interests
Author(s) disclose no potential conflicts of interest.
Disclosures and Ethics
As a requirement of publication the authors have provided signed confirmation of their compliance with ethical and legal obligations including but not limited to compliance with ICMJE authorship and competing interests guidelines, that the article is neither under consideration for publication nor published elsewhere, of their compliance with legal and ethical guidelines concerning human and animal research participants (if applicable), and that permission has been obtained for reproduction of any copyrighted material. This article was subject to blind, independent, expert peer review. The reviewers reported no competing interests.