
Abstract
Two simple, accurate and reproducible methods were developed and validated for the simultaneous determination of paracetamol (PARA) and pamabrom (PAMB) in pure form and in tablets. The first method was based on reserved-phase high-performance liquid chromatography, on a Thermo Hypersil ODS column using methanol:0.01 M sodium hexane sulfonate:formic acid (67.5:212.5:1 v/v/v) as the mobile phase. The flow rate was 2 mL/min and the column temperature was adjusted to 35 °C. Quantification was achieved with UV detection at 277 nm over concentration range of 100-600 and 4-24 μg/mL, with mean percentage recoveries were found to be 99.90 ± 0.586 and 99.26 ± 0.901 for PARA and PAMB, respectively. The second method was based on thin-layer chromatography separation of PARA and PAMB followed by densitometric measurement of the spots at 254 nm and 277 nm for PARA and PAMB respectively. Separation was carried out on aluminum sheet of silica gel 60F254 using dichloromethane:methanol:glacial acetic acid (7.5:1:0.5 v/v/v) as the mobile phase over concentration range of 1-10 and 0.32-3.20 μg per spot, with mean percentage recovery of 100.52 ± 1.332 and 99.71 ± 1.478 for PARA and PAMB, respectively. The methods retained their accuracy in presence of up to 50% of P-aminophenol and could be successfully applied in tablets.
Introduction
N-(4-Hydroxy phenyl) acetamide 1 (PARA) is the active metabolite of phenacetin (Fig. 1).1,2 It is an effective alternative to aspirin as an analgesic-antipyretic agent. 3 8-Bromo-3,7-dihydro-1,3-dimethyl-1H-purine-2, 6-dione comp with 2-amino-2-methyl-1-propanol (1:1)1,2 (PAMB) is a weak diuretic that is used along with analgesics for symptomatic relief of the premenstrual syndrome 2 (Fig. 1).1,2 P-Aminophenol (PAP), an impurity of PARA, 4 (Fig. 1) 1 is poisonous if swallowed. It lowers the ability of the blood to carry oxygen (methemoglobinemia). PAP may cause mutation and there is some evidence for its teratogenecity. 5 Several methods had been reported for the determination of PARA. PARA can be determined by fluorimetry. 6 Chromatographic methods, including ultra-high-performance liquid chromatography (UHPLC),7,8 HPLC,9–16 thin-layer chromatography (TLC),17,18 and gas chromatography (GC), 19 in addition to electrochemical methods.20–23 A chemometric technique was also used for the determination of PARA. 24 Few methods have been reported for the simultaneous determination of PARA and PAP, including spectrophotometry, 25 electrochemical determination, 26 and using sequential injection analysis. 27 A literature survey revealed that few methods were reported for the determination of PAMB, including spectro-photometry,28,29 and HPTLC. 30 Only a few methods were reported for the simultaneous determination of PARA and PAMB by HPLC 31 and HPTLC. 32 None of reported methods were capable of determination of the mixture under investigation; thus, it is important to develop methods that could be useful for their simultaneous determination. The aim of this work is to develop validated, simple, accurate, and reproducible chromatographic methods capable of the simultaneous determination of PARA and PAMB in the presence of PAP.
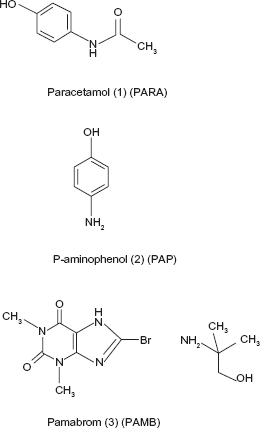
Chemical structure of PARA, PAP, and PAMB.
Experimental
Instrumentation
The HPLC apparatus was a Hewlett-Packard series 1100 equipped with quaternary pump, diode array detector, and a manual injector 20-μL loop (Waldbronn, Germany). The column was a Thermo Hypersil ODS (200 × 4.6 mm 5 μm particle size) (Bellefonte, PA, USA).
A Shimadzu-dual wavelength lamp flying-spot scanner CS9301 densitometer (Tokyo, Japan) was used for densitometric evaluation of the plates at the following settings: photomode: reflection, lane: auto, zero set mode: at start, scan mode: linear, difference: off, lambda: single, trace: off. We also used an ultraviolet short wave length lamp (254 nm) (ENF-260/FE, Westbury, NY, USA).
TLC plates used were silica gel/TLC cards with fluorescent indicator 254 nm and a layer thickness of 0.2 mm 20 × 20 cm aluminum cards Fluka (Buchs, Switzerland).
The ultrasonic bath used was from JP Selecta, s-a, cd.300513 (Barcelona, Spain).
Reagents and samples
All solvents used were LC grade and all reagents were analytical grade.
Methanol, acetonitrile, dichloromethane, and glacial acetic acid were obtained from Merck (Darmstadt, Germany).
Highly pure water was prepared using a 0.45 μm white nylon HNWP 47-mm filter from Millipore (Billerica, MA, USA).
Pharmaceutical grade PARA was kindly supplied by Haya Pharm (Port Said, Egypt). The purity of PARA was found to be 100.18 ± 0.730 according to the company method.
PAMB of pharmaceutical grade was kindly supplied from Haya Pharm. Purity of PAMB was found to be 99.42 ± 1.549 according to the company method.
PAP of pharmaceutical grade was supplied from Sigma-Aldrich (St. Louis, MO, USA). Purity of PAP was 98.00%.
Women Kit tablets were manufactured by Haya Pharm (Batch No. 11192), and contained 500 and 20 mg of PARA and PAMB per tablet, respectively.
Chromatography
For LC method
Chromatographic separation was performed on a Thermo Hypersil ODS (200 × 4.6 mm 5 μm), which was adjusted to 35 °C. The mobile phase consisted of methanol:0.01 M sodium hexane sulfonate:formic acid (67.5:212.5:1 v/v/v), pumped at a flow rate 2 mL/min. The mobile phase was filtered through a Millipore filter 0.45 μm, white nylon HNWP 47 mm. The injection volume was 20 μL. The elution was monitored at 277 nm. The run time was 8 min.
For TLC-Densitometric method
Ten microliters of solutions of the tested substances were applied to silica gel 60F254 TLC plates 20 × 20 using a 10-μL pipette. The plate was placed in a chromatographic tank previously saturated for 45 min with a developing mobile phase of dichloromethane: methanol:glacial acetic acid (7.5:1:0.5 v/v/v). The plate was developed in a normal vertical developing tank at ambient temperature over 16 cm. The spots were detected under a UV lamp (254 nm) and the drug was scanned densitometrically (applying flying-spot mode) at 254 and 277 nm for PARA and PAMB, respectively.
Standard solutions
Stock standard solutions
Stock standard solution of PARA, PAMB, and PAP (1 mg/mL) were prepared by dissolving 25 mg of each in 25 mL methanol. Working standard solutions of PAMB (0.08 mg/mL and 0.32 mg/mL) were prepared by separately diluting 2 mL and 8 mL of its standard stock solution to 25 mL with methanol for the LC and TLC methods, respectively.
Sample preparation
Twenty Women Kit tablets were thoroughly ground and mixed. An amount equivalent to 20 and 500 mg of PAMB and PARA, respectively, was accurately weighed, transferred to a 50-mL volumetric flask, and dissolved in 20 mL methanol. The solution was sonicated for 10 min and then cooled. The solution was diluted to volume with methanol and filtered.
Calibration
For LC method
Accurately measured volumes of PARA stock solution and PAMB working standard solution (for the LC method) equivalent to 1-6 mg and 0.04-0.24 mg were transferred into two separate series of 10-mL volumetric flasks and the solutions were completed to volume with methanol. Each solution (20 μL) was injected in triplicate. A calibration plot for each drug was obtained by plotting the area under the peak against drug concentration (100-600 and 4-24 μg/mL for PARA and PAMB, respectively) and regression equations were computed.
TLC-densitometric method
Accurately measured volumes of PARA stock solution and PAMB working standard solution (for TLC method) equivalent to 0.5-5 mg and 0.16-1.6 mg were transferred into two separate series of 5-mL volumetric flasks and the solutions were completed to volume with methanol. Ten microliters of each solution was applied using 10 μL pipette to TLC plates. Spots were separated 2 cm apart from each other and 1.5 cm from the bottom edge of the plate. A calibration plot for each drug was obtained by plotting the area under the peak against drug concentration (1-5 and 0.32-3.2 μg per spot for PARA and PAMB, respectively) and regression equations were computed.
Assay of Sample preparation
For LC method
The procedure described under the LC method was repeated using a volume of PARA stock standard solution equivalent to 1-6 mg and 0.04-0.24 mg of PAMB using PAMB working standard solution (for LC method). The concentration of each drug was determined based on its corresponding regression equation.
For TLC-Densitometric method
The procedure described under the TLC densitometric method was repeated using a volume of PARA stock standard solution equivalent to 1-5 mg of PARA and 0.32-3.2 mg of PAMB using PAMB working standard solution (for TLC method). The concentration of each drug was determined based on its corresponding regression equation.
Assay of Laboratory Prepared mixture
For LC method
The procedure described under the LC method was repeated using a mixture of standard stock solutions equivalent to 0.5-3 mg PARA, 0.3%-50% PAP, and 0.05 mg-0.24 mg PAMB using PAMB working standard solution (for LC method). The concentrations of each drug were determined based on its corresponding regression equation.
For TLC-densitometric method
The procedure described under the TLC densitometric method was repeated using a mixture of standard stock solutions equivalent to 0.5-5 mg PARA, 0.3%-50% PAP, and 0.16-1.6 mg PAMB using PAMB working standard solution (for TLC method). The concentrations of each drug were determined based on its corresponding regression equation.
Results and Discussion
The goal of this work was to develop chromatographic methods for the simultaneous determination of a mixture of PARA and PAMB in the presence of PAP. The proposed LC and TLC methods gave good resolution for this mixture under investigation (Figs. 2 and 3). No published chromatographic methods are capable of achieving the resolution of our method.
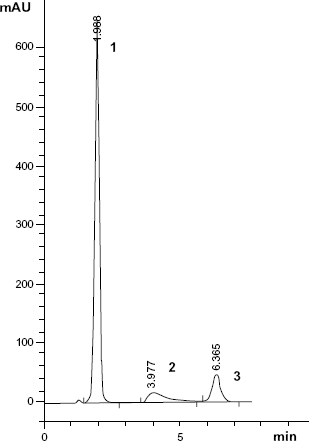
A typical LC chromatogram of laboratory prepared mixture of (1) PARA (500 μg/mL), (2) PAP (250 μg/mL), and (3) PAMB (20 μg/mL).
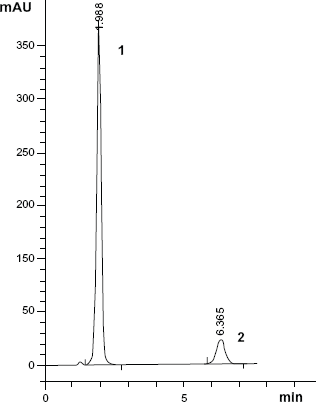
A typical LC chromatogram of Women Kit sample solution containing (1) PARA (250 μg/mL) and (2) PAMB (10 mg).
For LC method
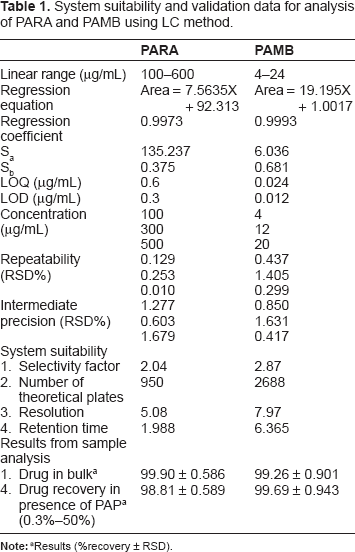
The chromatographic conditions were optimized. Column, column temperature, mobile phase composition, and flow rate were studied. Several columns were used, such as Inertsil C8 (4.6 × 250 mm, 5 μm), Thermo Hypersil BDS (4.6 × 150 mm, 5 μm), Zorbax Sb-C18 (4.6 × 250 mm, 5 μm), and Thermo Hypersil ODS (4.6 × 200 mm, 5 μm). The first two columns did not achieve adequate separation of all compounds. However, when Zorbax Sb-C18 was used, a prolonged retention time for PAMB was observed. Thermo Hypersil ODS was used and sharp, symmetrical peaks were obtained with good resolution and minimal elution time and noise. We used a reverse-phase C18 column, which is suitable for nonpolar and moderate polar analytes, including acids and neutral compounds. It was also found to be stable at low pH. Column temperature between 25 °C and 35 °C was investigated. Lower temperatures from 25 °C to 30 °C led to an increase in retention time of all compounds, increasing the run time. A temperature of 35 °C was chosen because it shortens the retention time of all compounds and decreases the run time. A mobile phase consisting of methanol:0.01 M sodium hexane sulfonate:formic acid (37.5:212.5:1 v/v/v) was firstly used. Altering the proportion of methanol did not affect the resolution of all peaks, however, remarkable affect was observed on the retention time of PAMB. Increasing the proportion of methanol from 20%-80% reduced the retention time of PAMB and shortened the run time. Decreasing the proportion of methanol 20%-80% led to increase the retention time of PAMB and prolong the run time. 0.01 M sodium hexane sulfonate was chosen as a compromise between analysis time and peak shape, since lower amounts showed peak shape distortion and higher amounts showed increased retention time. Thus, satisfactory separation with minimal elution time was obtained using mobile phase composed of methanol:0.01 M sodium hexane sulfonate:formic acid (67.5:212.5:1 v/v/v). The pH of the mobile phase was 2.5, which was required for better interaction between the compounds and the mobile phase. No pH adjustment was needed, which was an added advantage of the proposed method. Flow rates from 1-2 mL/min were studied. Flow rates of 1 and 1.5 mL/min led to an increase in retention time and hence the time of analysis. However, 2 mL/min reduced the run time without affecting resolution. The detection based on peak area was conducted at 277 nm, which was found optimal for the detection of all compounds. The retention times for all compounds are shown in Figure 2. The system suitability test results of the developed method are presented in Table 1.
System suitability and validation data for analysis of PARA and PAMB using LC method.
For TLC-densitometric method
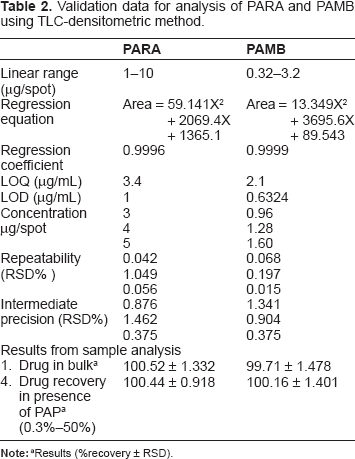
The TLC method was suggested for the determination of PARA and PAMB in presence of PAP based on the difference in Rf values. Several mobile phases were attempted to achieve complete separation of the three components. Dichloromethane:methanol (7.5:2.5 v/v) and dichloromethane:ethyl acetate (7.5:2 v/v) was attempted. The first mobile phase did not achieve adequate separation of the three components; the spots did not migrate from baseline. However, using the second mobile phase, the spots migrated from baseline, but both PARA and PAMB separate at the same Rf values. Changing the ratio of the mobile phase by reducing the percentage of methanol by 50% (dichloromethane:ethyl acetate (7.5:1 v/v)), led to adequate separation of the three components, but still the spots were tailed. By adding glacial acetic acid in a ratio of 7.5:1:0.5 v/v/v for dichloromethane: ethyl acetate: glacial acetic acid, the tailing for all spots was reduced considerably. The Rf values were 0.24, 0.53, and 0.13 for PARA, PAMB, and PAP, respectively (Fig. 4). Results are summarized in Table 2.
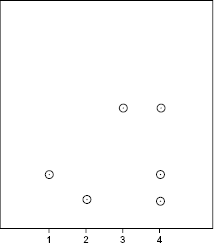
A TLC plate showing (1) PARA, (2) PAP, (3) PAMB, and (4) Laboratory prepared mixture of PARA, PAP, and PAMB.
Validation data for analysis of PARA and PAMB using TLC-densitometric method.
Analysis of Pharmaceutical formulations
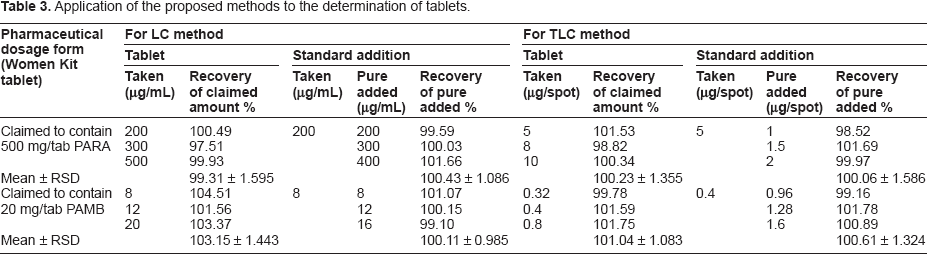
The proposed methods were applied for the determination of PARA and PAMB in tablets. Satisfactory results were obtained for PARA and PAMB in good agreement with the labeled claimed Table 3.
Application of the proposed methods to the determination of tablets.
Method validation
Linearity and range
The linearity range was studied for PARA and PAMB using the proposed LC and TLC methods. A linear relationship was obtained between the area under the peak and the concentration of the two drugs. A first-order equation was used for the calibration in the LC method, while a polynomial equation was applied for the TLC method. Results are summarized in Tables 1 and 2. The calibration ranges were established by considering the necessary practical range, according to each compound concentration present in the pharmaceutical formulations, to give accurate, precise, and linear results. The calibration ranges for the proposed methods are shown in Tables 1 and 2.
Accuracy and precision
Accuracy of the results was calculated as percentage recovery from five samples of the drugs in bulk powder analyzed using the proposed methods. The results obtained were compared statistically with the manufacturer's methods using t-test and F ratio. The results of the proposed methods suggest the accuracy of the proposed methods since there is no significant difference between the proposed methods and the manufacturer's methods (Table 4). A standard addition technique was applied to further validate the accuracy of the proposed methods. To evaluate precision, repeatability and intermediate precision were analyzed. Repeatability was measured by analysis of three different concentrations for each drug. The RSD for the average concentration of each drug measured on three different days is intermediate precision (Tables 1 and 2).
Results from the use of the proposed and manufacturer's methods for the analysis of PARA and PAMB in bulk material.
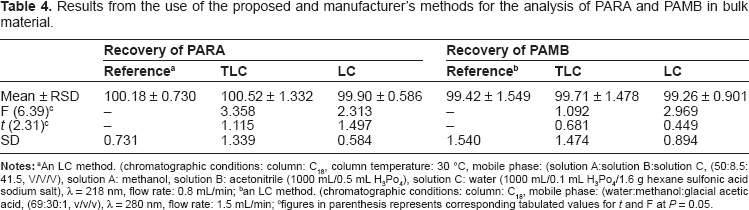
an LC method. (chromatographic conditions: column: C18, mobile phase: (water:methanol:glacial acetic acid, (69:30:1, v/v/v), λ = 280 nm, flow rate: 1.5 mL/min;
figures in parenthesis represents corresponding tabulated values for t and F at P = 0.05.
Specificity
Specificity is the ability of an analytical method to measure analyte response in the presence of interferences. Specificity of the proposed methods and its good potential to determine both PARA and PAMB in presence of PAP was assessed by the determination of both drugs in a laboratory prepared mixture (Figs. 2 and 4). It was also shown in the application of the proposed methods that both drugs in samples solution can be determined without the interference of excipients. Figure 3 shows that the peaks were free from any co-eluting peaks, thus demonstrating that the proposed method is specific. Results are summarized in Tables 1 and 2.
Robustness
The robustness of the proposed methods was assessed by the ability to remain unaffected by small changes in experimental conditions. For the LC method, changing flow rate by ±0.2, temperature ±2 °C, and small changes in mobile phase organic strength by ±2% had no significant effect on the chromatographic resolution. Small changes in the components of the mobile phase in the TLC method did not affect the separation. Thus, the methods is robust.
Limit of Detection and Limit of quantification
The limit of detection (LOD) and the limit of quantification (LOQ) were defined as the concentration for which signal-to-noise (S/N) were 3 and 10, respectively. The values obtained from the averages of six experiments are shown in Tables 1 and 2.
Conclusion
By searching literature, it was found that none of the reported methods was capable of simultaneous determination of PARA, PAMB, and PAP. The proposed chromatographic methods (LC, TLC) achieved this goal. The results indicate that the proposed methods are accurate, reproducible, precise, and applicable for determining both drugs in tablets without any interference from excipients. These facts suggest the use of the proposed methods in routine and quality control laboratories for these two drugs.
Footnotes
Author Contributions
Conceived and designed the experiments: OME. Analyzed the data: OME. Wrote the first draft of the manuscript: OME. Made critical revisions: OME. The author reviewed and approved of the final manuscript.
Funding
Author(s) disclose no funding sources.
Competing Interests
Author(s) disclose no potential conflicts of interest.
Disclosures and Ethics
As a requirement of publication the author has provided signed confirmation of compliance with ethical and legal obligations including but not limited to compliance with ICMJE authorship and competing interests guidelines, that the article is neither under consideration for publication nor published elsewhere, of their compliance with legal and ethical guidelines concerning human and animal research participants (if applicable), and that permission has been obtained for reproduction of any copyrighted material. This article was subject to blind, independent, expert peer review. The reviewers reported no competing interests.