
Abstract
Background
The outbreak of a novel coronavirus, known as severe acute respiratory syndrome coronavirus 2 (SARS-CoV-2), or COVID-19, raised worldwide concern. The present study investigates the association between anti-contagion policies and the spread of COVID-19 across the United States.
Design and methods
We selected the most frequently implemented COVID-19 anti-contagion policies in all the U.S. states issued from 29 February 2020. Accordingly, we modified an epidemiological model and combined it with a comprehensive statistical analysis to evaluate the policies’ individual and overall likely impact.
Results
For the first time, a novel index, evaluates the associations between policy implementation and COVID-19 spread at both statewide and national levels. Our results indicate that governmental policies requiring mask use, businesses social distancing, and quarantining travelers may be most effective for controlling COVID-19 spread. Simultaneously, widespread orders like school closure and safer-at-home that can be particularly disruptive to the economy and social fabric of society may be unnecessary given their lack of association with reducing infection.
Conclusions
The absence of any COVID-19 vaccines during the first several months of its pandemic necessitated using governmental policies to help stop the spread of this disease. Our index showed the association between implemented policies and COVID-19 spread, highlighting the specific policies with the greatest association - mandatory quarantine upon entering a state, businesses implementing social distancing, and mandatory mask use - and those with less association like school closure and saferat- home orders. This study provided evidence to inform policy choices for the current global crisis and future pandemics.
Introduction
In the United States (U.S.), there were nearly 39,960,000 confirmed cases and over 656,000 deaths of people who tested positive for severe acute respiratory syndrome coronavirus 2 (COVID- 19) as of August 31, 2021. 1 The first COVID-19 case in the U.S. was reported in Washington State on January 22, 2020. 2 By March of 2020, states and federal governments were implementing public health interventions to reduce the growth rate of COVID-19 across the nation (Table 1).3–6
Significance for public health
The absence of any COVID-19 vaccines during the first several months of its pandemic necessitated using nonpharmaceutical interventions to help stop the spread of this very contagious and lethal disease. We examine all major anti-contagion policies across the 50 U.S. states and combine this with a comprehensive epidemiological and statistical analysis to develop a novel policy ratio index. Our index shows the association between implemented policies and COVID-19 spread, highlighting the specific policies with the greatest association - mandatory quarantine for travelers, businesses implementing social distancing, and mandatory mask use - and those with less association like school closure and safer-at-home orders. This article presents a novel index to evaluate the associations between policy implementation and novel coronavirus spread statewide and nationally and provides evidence to inform policy choices for the current global crisis and future pandemics.
To study the impact of policy implementation, investigating the evolution of COVID-19 is crucial; thus, well-known compartmental mathematical models (e.g., SIR, SEIR) have often been applied.7–9 Using those models, previous studies predicted the spread of COVID-19 in Europe, 10 China, 11 Germany, 12 and various communities in South Korea, India, Australia, and the U.S. 13 However, these research studies deployed simplified models incapable of producing reliable estimates since such models consider the transmission rate to be constant, imposing limitations on predicting other parameters (e.g., daily susceptible and infected cases). 14 Furthermore, COVID-19 epidemiological studies mostly used reported infected cases as the response value, which comprises primarily diagnosed symptomatic infections 15 but does not take diagnosed asymptomatic and non-diagnosed cases into account. 16 In investigating the effect of policies, previous studies mainly focused on evaluating one17–19 or a few implemented orders. 20 According to Hsiang et al., 5 developing epidemiological simulations to investigate the effect of policies is not merely sufficient for policies impact evaluation since the actual effects of policies on the number of infected cases in the ongoing pandemic are unknown21–24 and more analytics methods (e.g., statistical analysis) are required to be implemented to support the findings. In this regard, Chaudhry et al.'s 16 study on 50 countries highlighted that except for the days to lockdown, no other association between reducing the number of cases and the rest of studied variables (lockdown and border closure) was found. The number of confirmed cases as the response value was used during their analysis; however, as discussed, the number of confirmed cases is not a well-representative of total infected cases. Above-mentioned studies failed to report all policies’ overall associations, or the most important policies in effect, with COVID-19 spread which can help policy makers to curb the pandemic more effectively.
To address these shortcomings for the U.S., we first modified the SEIR model by updating the model parameters on a daily basis using the daily death statistics reported for every state. Accordingly, we used our predicted number of daily infected cases (included all the infected categories) for every state produced by the modified SEIR model as the response value and the implemented anti-contagion policies as predictors in a comprehensive statistical analysis. As a result, we evaluated the individual and overall effects of the most frequently implemented anti-contagion policies. For the first time in the COVID-19 literature, we present a novel index (policy ratio) highlighting the associations between policy implementation and COVID-19 spread for every state of the U.S.
To perform the present research, we selected the most frequently implemented COVID-19 anti-contagion policies in the U.S. The study data includes policy activity, policy implementation duration, and the number of implemented policies in each of the 50 U.S. states for the study period, as presented in Figure 1.
Design and methods
Data collection
We selected the most frequently implemented COVID-19 anticontagion policies in the U.S. out of more than 50 policies issued from February 29, 2020 (Table 1). The study data includes policy activity in each of the 50 U.S. states from March 1, through July 31, 2020 (Figure 1).25–27 We chose the end of July as the cut-off time because COVID-19 policy activity became relatively stable in the U.S. The number of daily COVID-19 cases, deaths, and tests were obtained and cross-checked from multiple sources, including the Centers for Disease Control and Prevention (CDC), 28 Johns Hopkins Coronavirus Resource Center, 29 The New York Times COVID data repository, 30 and Worldometers data center 31 to ensure data integrity and consistency. The study used COVID-19 outcome measures (cases and deaths) starting two weeks after each policy was implemented and suspended to account for the response lag.
Most frequently implemented anti-contagion policies across the U.S. Table is sorted based on the implementation date.

Epidemiological analysis
Compartmental models are frequently used to model infectious diseases. 32 One such model, the Susceptible-Infectious-Recovered (SIR) model, has been used since the beginning of the COVID-19 pandemic to predict the spread13,33–35 and simulate the progress of COVID-19.36,37 However, the SIR model fails to consider the latent phase - when the individual is infected but not yet infectious - which is an important period in the case of COVID-19. 38 Adding a latent/exposed population can incorporate the latent phase within the SIR model. In this way, infected individuals move from susceptible to exposed to infected.39,40 As such, the Susceptible-Exposed- Infectious-Recovered (SEIR) model is defined by four coupled nonlinear ordinary differential equations (ODEs) as below: 41

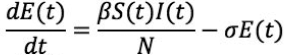

where N, S, E, I, and R represent the number of individuals in the population who are susceptible, exposed, infectious, and removed (recovered/deceased), respectively. Also, b, s, and g are the contact, infection, and recovery rates, respectively. In the present study, to perform the SEIR model, we recall the ODEs (eqs. 1–4) in pythonTM and initialize the parameters E0, I0, and R0. In this regard, for every simulation, we assumed the number of susceptible individuals equals the corresponding regional population collected from the U.S. Census Bureau. 42 Also, the number of exposed, infected, and recovered individuals on the first day of the study period was set at 1, 0, and 0, respectively. It should be noted that these assumptions are used to merely initialize the values in the model and all the values are updated during the iteration based on the real data.
To provide a reliable result for each state, the general SEIR model needed to be trained for every state using the corresponding reported state data. Otherwise, there would have been no differentiation among the contact rates (b). To train the model based on the available death data, we added the case fatality rate (CFR, the proportion of people who die from a specified disease among all individuals diagnosed with the disease over a certain period). Based on the CFR estimations for COVID-19 reported in the literature, we initialized the CFR to be 0.01% of the total population.43,44 Later, we implemented an optimizer using the least squares method to minimize the difference between the predicted and actual daily death rate for every state. In reality, due to the implementation of anti-contagion policies, the contact rate (b) and basic reproduction number (R0, the number of secondary cases an individual would produce in a completely susceptible population45,46) are not constant. Therefore, we defined b as time-dependent, representing the effective reproduction number (Rt, the number of secondary cases an individual would produce at any specific time46,47). Having a time-dependent contact rate increases the reliability of the model with the real-life situation. 48 Moreover, to estimate the values of incubation periods (i.e., the period of the days from the time the individual is exposed to the virus to the onset of symptoms) and infectious periods (i.e., the period in which an individual is infectious), we examined several studies49–52 and considered the corresponding values to be 3 days and 10 days, respectively. Accordingly, both infection (s) and recovery rates (g), which are defined as the reciprocal of incubation and infectious periods, were calculated. As a result, the daily total number of susceptible, exposed, infected, and recovered cases for every state were estimated. We used the total numbers of daily infected cases for every state as response values to perform the statistical analysis.
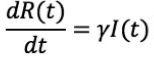
There are four categories of infected cases, including nondiagnosed symptomatic, non-diagnosed asymptomatic, diagnosed symptomatic, and diagnosed asymptomatic. 53 According to previous studies54–56 and the CDC, 57 most people who were infected with COVID-19 were asymptomatic, and daily reported cases mainly included those symptomatic since they were the individuals more likely to get tested. 58 To perform comprehensive modeling, our modified SEIR model considered all those categories and represents the total number of daily infected cases for every state. We used this number as the response values for performing our statistical analysis. Also, to evaluate the overall effect of anti-contagion policy implementation, we used the SEIR model in two different scenarios. First, we considered every state's total population to predict the daily number of infected cases if there were no policies in effect. Next, we evaluated the daily number of infected cases with the policies in effect. Implementing the anti-contagion policies impacts both the number of daily cases and daily deaths. Since the reported number of infected cases (i.e., number of infected cases reported on data sources for each state) was not an accurate representation of the total infected cases, we used the daily reported deaths data to optimize the SEIR model. As a result, having the data of both scenarios, we calculated the policy ratio, or the average ratio of total infected cases when no policy was in effect compared to when policies were implemented, as follows:

The duration of every policy in every state during the study period. States are ordered alphabetically based on their abbreviations.
where Inp is the total number of daily infected cases when there is no policy in effect and Ip is the total number of daily infected cases when policies are implemented. The larger policy ratio represents the greater potential effect of policies in controlling COVID-19.
Figure 2 shows the flow diagram of the modified SEIR model developed in this study.
Statistical analysis
To perform the statistical analysis, we defined the predictors (implemented anti-contagion policies) as categorical variables either in-effect or suspended. We used our modified SEIR model outcomes (i.e., the daily number of total infected cases) as response values to investigate every policy's potential effect in each U.S. state using statistical analysis. To find a statistically significant association between our predictors and response values, the appropriate regression modeling, either Negative Binomial Regression Modeling (NBRM) or Poisson Regression Modeling (PRM), was selected depending on data equidispersion or overdispersion. 59,60 All the analyses were performed considering 95% confidence intervals (95% CI). We evaluated both tolerance and the variance inflation factors to diagnose the collinearity in multiple regression by observing the R 2 of regressing one predictor on all other predictors throughout the analysis. Accordingly, we removed all statistical noise (i.e., random irregularity). To investigate the effect of any probable noise and outlier, we examined the models using Akaike Information Criterion (AIC) and Bayesian Information Criterion (BIC). All statistical analyses were performed using SPSS (International Business Machines Corporation (IBM), Armonk, NY, USA). As a result, after removing noises and checking all the criteria [e.g., p-value (<0.05), CI (95%)], we determined which policies and to what extent they decreased the number of daily infected cases for every state of the U.S. throughout the study period. Accordingly, we demonstrated the most effective anti-contagion policies in control of COVID-19 across the nation.
Results
The most effective policies
Our findings reveal that among all policies, mandatory quarantine upon entering a state (order No. 6; see Table 1), businesses implementing social distancing protocols (order No. 13), and mandatory mask use (order No. 16) are the policies associated with reducing COVID-19 spread. There was a significant association between policy implementation and reduction in the total number of infected cases in the country for 55%, 75%, and 45% of the states that implemented mandatory quarantine upon entering a state, businesses implementing social distancing protocols, and mandating mask use, respectively.
To reveal specific policy action that may help explain slowing the spread of infection, Figure 3 demonstrates the states which showed a significant decrease in the number of infected cases after implementing orders 6, 13, and 16. The findings suggested that implementing those policies is associated with an average 40% reduction in the total number of infected cases. Zeroing in on one state, for example, New York, shows that mandating mask use was associated with a 66% decrease in the total number of infected cases. Similarly, implementing the mandatory quarantine upon entering a state was associated with a 48% reduction in the total number of infected cases in New York. Supplementary Table S1 presents the details of the multivariable binomial regression analyses, including the incidence rate ratio (i.e., the exponents of coefficients in the multiplicative Poisson model) and standard error for orders 6, 13, and 16.

Flow diagram of modified SEIR model.

The association of each of three policies (mandating mask use, businesses implementing social distancing protocols, and mandatory quarantine upon entering a state) with a reduction in the number of COVID-19 infected cases. The colored lines represent the upper and lower bounds of the association. Also, the vertical dashed line demonstrates the average value of association for all states shown here.
Novel policy ratio index
We defined and calculated a policy ratio (the average ratio of total infected cases when no policy was in effect compared to when policies were implemented - see Methods) for every state to represent the overall association of policy implementation with controlling the spread of COVID-19. Figure 4 demonstrates the value of the policy ratio calculated for each U.S. state. Alaska had the greatest impact (policy ratio: 3666), and South Dakota had the least impact (policy ratio: 17) from policy implementation, respectively. Also, this figure shows policies are more effective in states with less population density since the probability of getting infected in populated areas is higher than areas with less population density (this is mainly because the COVID-19 is highly infectious). As a result, the virus can rapidly spread compared to areas with lower population density.
Figure 5 compares the cumulative number of infected cases considering two different scenarios - one if there were no policies in effect (Figure 5a) and one with policies implemented (Figure 5b). Considering our calculated policy ratio and the cumulative number of infected cases reported by the end of July, 30 we estimated the total number of infected cases when no policies were in effect. We estimate that implementing policies was associated with an average 58% reduction in the total number of infected cases (average of the column titled “Estimated reduction in the number of infected cases due to implementing policies (%)” in Supplementary Table S2). Figure 5, indicates that the implementation of anti-contagion policies was associated with nearly 10.8 million fewer Americans becoming infected by July 31, 2020 which highlights the importance of policies in controlling the spread of the virus.
According to research by Ioannidis, 61 the COVID-19 infection fatality ratio (IFR; i.e., the proportion of deaths among all infected individuals) for the locations with mortality rates less than the global average (i.e., <118 deaths/million) and high death rate (i.e., more than 500 deaths per million) is 0.20 and 0.57%, respectively. Johns Hopkins Coronavirus Resource Center 29 reported that the mortality rate of COVID-19 in the U.S. is more than 500 deaths per million. Therefore, considering the total number of infected cases when no policies were in effect (predicted by the present study) and 0.57% as the IFR, implementing the examined policies was associated with 61,560 fewer deaths nationwide as of July 31, 2020. Based on other estimations of IFR by Russel et al. 62 at 1.3% for all the ages combined and Brazeau et al. 63 at 1.15% (for highincome countries), the number of fewer deaths nationally associated with implementing the policies may have been as many as 140,000. Supplementary Table S2 presents the cumulative number of reported and predicted infected cases and deaths considering two policy implementation scenarios.
We evaluated the relation between our policy ratio and both normalized reported number of cases and deaths across the nation. Results demonstrated a significant negative association between policy ratio and those two criteria. This means the higher policy ratio is associated with fewer infected cases and deaths, which confirms the association of policy implementation with reducing COVID-19 spread (p<0.05). Additionally, we investigated the relationship between the state policy ratio and population density. The correlation analysis exhibited a significant negative association (p<0.05), demonstrating that policies have a greater association with reducing COVID-19 spread in the states with less population density. To test this correlation, using the modified SEIR model developed here, we calculated the effective reproduction number Rt) over the study period in the states with greatest population density, including New Jersey (2.26), Rhode Island (1.78), and Massachusetts (2.13), and the least population density, including Montana (1.60), Wyoming (1.52) and Alaska (1.36). Our findings indicated that, on average, the effective reproduction number was 40% higher in states with the largest population density. This confirms an increase in the probability of becoming infected in more populated areas and, accordingly, a decrease in the potential of anti-contagion policies controlling COVID-19 in these areas. This finding is consistent with other research study by Hu et al. that showed that contact rates tend to increase with density. 64 Figure 4 presents the population density distribution, the policy ratio, and the average effective reproduction number for each state.

The distribution of policy ratio and population density over the study period (March 1 to July 31, 2020). The average effective reproduction number (Rt) for every state is presented in parenthesis.
Discussion and Conclusions
We have presented COVID-19 case outcomes as they relate to the top 16 anti-contagion policies implemented in each of the U.S. states from March 1, 2020 through July 31, 2020. This study differs from other COVID-19 epidemiology and policy studies in that we modified the SEIR model and combined it with a comprehensive statistical analysis to better capture symptomatic and asymptomatic cases and examine, for the first time, the association of all the major policies implemented in the U.S. states with COVID-19 spread during the first six months of the pandemic. Additionally, we predicted the total number of COVID-19 infected cases and deaths if no policies were implemented to highlight the potential impact of anti-contagion policies in controlling COVID-19 in the U.S. Moreover, we calculated the average effective reproduction number for every U.S. state, indicating the number of secondary infections likely to occur from a single infection in every state.
Our findings show the policies of mandating mask use, businesses implementing social distancing protocols, and mandatory quarantine upon entering a state were associated with an average 40% reduction in the total number of infected cases. Additionally, policies implemented across the states may have saved nearly 10.8 million people from being infected. Considering different IFRs reported by other research studies and our estimated number of infected cases, results demonstrated that policies may have been associated with 140,000 fewer deaths nationwide. Note that previous studies based reported IFR values based on symptomatic cases only. 65 Yet, the majority of COVID-19 infected cases are asymptomatic. 28 Therefore, using the previously reported values of IFR, we expected the number of estimated deaths (Supplementary Table S2) to be more than the reported number of deaths for all the U.S. states; however, it is not. The lower-than-expected reported number of deaths could be due to various other factors, such as population density, age, race, and ethnicity. We also calculated the average effective reproduction number for all U.S. states, and our results demonstrated a direct association between the population density and the effective reproduction number. This finding is not surprising given that when individuals are in closer proximity to one another, the droplet transmission and airborne transmission increase causing an acceleration in the spread of the virus. 66 The policies of mask-wearing and businesses implementing social distancing found potentially effective in this study are consistent with other U.S. anti-contagion policy observational studies.67,68 However, our study provides even greater evidence for these policies because our epidemiological and statistical analysis accounted for many infected cases not included in other studies, which depended only on reported COVID-19 rates.
Several policies examined in this study did not show significant associations with reducing the number of infected cases across the U.S. One such policy that stands out is school closure which has sparked much debate throughout the COVID-19 pandemic. 69 Research based on previous influenza viruses indicated children would be major spreaders of the coronavirus. 70 However, the evidence produced since states first implemented school closure in mid-March 2020 supports our findings and indicates children are at significantly less risk for COVID-19 infection.71,72 However, children's role in spreading the disease remains unclear. 73

The cumulative number of infected cases: a) no policies; b) policies in effect.
Further evidence that school closure may not be significantly linked to increasing infection rates can be seen in Europe when, throughout the fall of 2020, in contrast to the widespread canceling of in-person education in the U.S., schools remained opened using safety precautions like mask-wearing and ventilation without it significantly accelerating disease spread. 74 Experts have criticized school closures, arguing that closing schools may have caused social, economic, and health problems even more common and more severe than those due to COVID-19, 75 including increased risk of loneliness, addiction to videogames and binge-watching, alteration of circadian rhythms, direct or assisted domestic violence, and academic achievement gaps.76–78 In learning from past pandemic research, a 2014 review by Mangtani 79 commissioned by the Department of Health in England (now known as the Department of Health and Social Care) concluded that “the benefit of school closure in reducing clinically important outcomes needs to be balanced against secondary adverse effects.”
Social distancing (i.e., prohibiting gatherings with members outside the household), non-essential business closure (stay-athome order), and safer-at-home orders were three other prominent policy areas not associated with a significant reduction in COVID- 19 spread. One reason for these findings may be the difficulty with grouping the many types and levels of social distancing measures or restricting people to their homes into just one or two categories. The various aspects such as geographic level of examination, COVID-19 incidence rates at the time of implementation, duration, frequency, and intensity of such orders make evaluative studies on these policies difficult to compare to one another. For example, Thu et al. 80 reported a wide variation in the effectiveness of social distancing measures between ten highly infected countries. Additionally, the timing of social distancing, business closure, and safer-at-home orders in terms of how soon after the first reported case and how frequently (continuous versus intermittent) the policy is implemented can impact their effectiveness in reducing infection spread. 81
The lack of accurate data about COVID-19 cases, especially asymptomatic cases, in the U.S., 82 posed a challenge to verifying our epidemiologic model's case and death values. While we used existing data to estimate these values, we can further analyze their precise association with policy implementation as more accurate retrospective case data becomes available over time. A limitation of this study is that the data does not account for the interactions between policies. We recommend future investigation into the interplay of policies to determine potential synergies and conflict, rollout approach, and communication strategies to emphasize prioritization. This analysis focuses mainly on COVID-19 infected cases and also considers deaths. However, we did not examine hospitalizations. Future investigations should include hospitalizations to represent severity and, together with health system capacity data, identify inadequacies in medical care to inform medical response-related policies.
The ultimate goal of this research is to help inform discussion about further policy actions state and national governments can take to curb infection spread now and during future pandemics. With 3 out of 16 (19%) of the examined policies accounting for the majority (about 75%) of positive policy-related impact on COVID- 19, Pareto's principle, 83 or the “80/20 rule,” surfaces here. As the country continues reopening businesses and schools, decisionmakers should focus on policies emphasizing mask-wearing, social distancing, and quarantining travelers as they may have the greatest chance of preventing the spread of COVID-19.
Footnotes
Acknowledgements
The authors are grateful to the Northern Illinois University College of Engineering and Engineering Technology and to the Division of Research and Innovation Partnership for their financial support to carry out this research. The authors also want to thank T. J. Hogan (Northern Illinois University) and E. Vernon (Seattle University) for their valuable feedback. However, all the results, justifications, and conclusions are solely the authors and have not been endorsed by any other party.