
Abstract
Background
The novel coronavirus disease is an ongoing pandemic that started in China in December 2019. This paper is aimed at estimating the first two infections waves in Italy in relation to adopted health policies.
Design and methods
We moved deaths of the Italian COVID- 19 registry from recorded to infection date by the weighted moving average. We considered two infection fatality ratios related to the effective or saturated health system, we estimated the likely incidence curve from the resulting deaths and evaluated the curve shape before and after the national health policies.
Results
From the 24th of February 2020 to the 7th of February 2021, we estimated 6,664,655 (4,639,221-9,325,138) cases distributed on two waves. Suitable daily infection fatality rates were 2.53% within the first wave and 1.15% within the second one. The first wave (February-July 2020) had its peak on the 14th of March 2020 (26,575). The second wave (August 2020-February 2021) was fatter with the peak on the 12th of November (60,425) and a hump in December before decreasing to 26,288 at the end. Adopted health policies were followed by changes in the curve rate.
Conclusions
Tracing infection contacts and quarantining asymptomatic people reduced virus lethality in the second wave. Restriction on population mobility is effective within a suppression strategy, distance learning reduces contacts among families. Removal of restrictions should be implemented by sequential steps for avoiding a quick rising of incident cases. A reasonable public health daily goal to control both virus spread and lethality could be to find at least 87 cases for each death.
Introduction
The severe acute respiratory syndrome coronavirus 2 (SARSCoV- 2) is a new virus that emerged in December 2019 in Wuhan (China). 1 The related spectrum of pathological manifestations is named coronavirus disease 2019 (COVID-19) and usually ranges from mild flu symptoms to bilateral interstitial pneumonia. 2 Virulence and transmission features of SARS-CoV-2 pose two major challenges to health authorities to reduce mortality and avoid health system saturation. Firstly, despite the virus is not very aggressive in the whole population (about 1 death out of 100 infections in developed countries),3-6 lethality increases with age (up to 10-15 deaths out of 100 infections in people aged more than 75 years) and in people with concomitant comorbidities and/or patients who are immunosuppressed.7-9 Since the prognosis of severe cases depends on the availability of intensive care beds, lethality also increases in periods with a saturated critical care capacity. Secondly, the virus can also spread through presymptomatic and asymptomatic transmissions (which are difficult to detect and isolate), hampering the efforts to lower hospital workload by reducing transmission chains in the population.10-13 The percentage of asymptomatic carriers is about 40%14,15 and has a negative correlation with age.16-18 Several studies suggested the need to consider asymptomatic infections by testing all contacts of confirmed cases, (including those without symptoms) and by dedicated reports in official statistics.19,20 In Europe, COVID-19 spread started in Italy in February 2020. In the beginning, it was not clear the important role played by asymptomatic infections and diagnostic tests were performed above all on suspected cases with symptoms (except in the Veneto region). 15 The virus hit very hard the country, with over 28,000 deaths in March- April/2020 (half of them concentrated in the Lombardy region). The governmental administration (following Chinese measures) established a national lockdown (the first in a democratic nation after the Second World War) for containing the virus spread. Schools were closed on the March 15th, one week later individual mobility other than health- and work-related was limited to 200 meters around the home, and all non-essential industrial production was locked down from the last week of March. Restriction measures blocked the first wave and from May they were gradually removed in parallel with strong development of the COVID-19 contact tracing system. From August, the second wave started slowly (less than 1500 detected cases and 15 deaths per day for all the month) and was under control until September (the number of weekly detected cases grew linearly). From October, the virus spread started running faster (the number of weekly detected cases grew exponentially) and new restrictions were adopted. Data of the first wave were characterized by a case fatality ratio (CFR)

very high compared to those of other countries. A comparative study ranked the most affected countries by CFR (evaluated on the 19-th of April) as follows: Italy (9.2%), the Netherlands (7.4%), Spain (6.0%), France (2.6%), China (2.3%), Switzerland (1.9%), South Korea (1.6%), USA (1.2%) and Germany (0.7%). 21 Presumably, the large toll in Italy was at least in part explained by the number of undetected cases due to an ineffective contact tracing system until May-June/2020. A more accurate measure of lethality is the infection fatality rate (IFR)
Significance for public health
The COVID-19 pandemic posed important challenges to public health institutions. All around the world, countries experimented with severe and unprecedented measures of containment, which strongly restricted people's mobility. To provide quantitative measures about the effects of the adopted public health policies on the virus spread and lethality is an important step for controlling the pandemic.
but it requires the knowledge of the true number of infections. To achieve this goal, the National Institute of Statistics (ISTAT) performed a serological survey aimed at estimating the actual number of cases and found Coronavirus infection six times more prevalent than official data. 14 This result highlighted the importance to assess the true number of infections to evaluate both the virus lethality and spread correctly. By assuming different IFRs, this study is aimed at estimating the daily incidence and lethality of Italian infections in relation to the public health policies implemented over the first year of the pandemic.
Design and Methods
Study design
This study analyzed publicly available data of Italian COVID- 19 confirmed cases collected in the national registry by the Civil Protection (CP) and the National Health Institute (ISS).
Settings
On the 31st of January 2020, the Italian Government declared the health emergency status and delegated the CP to manage it. The CP established a data network (including all Italian regions) to collect COVID-19 data in a national registry (managed by the ISS) and publishes aggregate data about the virus spread updated day by day.
Participants
All Italian confirmed cases of COVID-19.
Outcomes
Primary outcomes were: 1) the number Nk of persons infected on the k-th day of pandemic (i.e., daily incident cases); 2) the number Dk of persons who died among Nk (i.e. number of deaths by day of infection); 3) the number Δk of persons who were officially detected among Nk (i.e., the number of diagnosed cases by day of infection).
Data sources/measurement
Aggregate data from the national COVID-19 registry are stored in a public repository and updated daily. 22 Data contain daily counts of diagnosed and lethal cases, of performed tests by region and refer to all people who tested positive to the polymerase chain reaction test or (from January 2021) to the antigen rapid test.
Statistical analysis
Rationale
During an ongoing epidemic with many asymptomatic infections (like the COVID-19 pandemic), the number of diagnosed cases strongly depends on the related contact tracing system. For that reason, we estimated daily infections from resulting deaths. A reliable estimate of virus lethality in high-income countries is 1.15%,
3
but it increases when the health system capacity is saturated. Since in Italy lethality is known (and higher than expectations) only over the first wave, for the second one we considered two scenarios: the first one is related to an overloaded health system (like in the first wave); the second one is related to a health system working below the saturation level (i.e., with lethality in line with expectations). We chose the scenario that was the most consistent with data, that is the one providing estimated daily infections
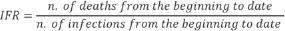
IFR: Lethality on the whole period
Let N(j) and D(j) be respectively infections and deaths within the j-th age class over the whole pandemic period, the infection fatality ratio of the jth age class (IFR (j)) is equal to

and the overall IFR can be expressed as the weighted mean of IFR j s

with

Daily Infection Fatality Rate: Lethality by day
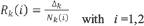
Let k be the number of elapsed days from 2020/02/24 (the earliest collected date), Nk(j) be the incidence within the j-th age class on k-th pandemic day and Dk(j) the related deaths among Nk(j). We define the daily infection fatality ratio within the j-th age class (IFRk(j)) and the overall one (IFRk) as
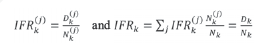
with

We can note that IFR can be written as the weighted mean of IFRk

with

By defining the i-th wave of deaths (wi) as the i-th inverted Ushaped part of the related curve in a time-period Ti between two local minima Ti = (ti-1, ti), we can similarly define the infection fatality ratio (IFRk (w2)) of wave i as

with

Furthermore, we will say that a wave has a hump if after the peak it has two close inflection points.
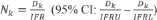
Estimating Nk
By assuming that the IFRk does not change over time (IFRk = IFR) through reliable estimates of IFR (95% CI: IFRL - IFRU) we can estimate Nk (with related 95% CI) as
Similarly, by assuming that the IFRk does not change within wave wi (IFRk = IFR(wi)), we can estimate Nk (with related 95% CI) within wi as

Estimating Dk and Δk
Let dk,k + j and δ k,k + j be the number of persons infected on k-th pandemic day who died or were diagnosed j days after the infection, the number of deaths (Dk) and of detected cases (Δk) among infections on k-th pandemic day can be evaluated as

Since we only have the corresponding number of events by the occurrence date (of death or diagnosis)

we estimated Dk and Δk as

where pj(k+j) and πj(k+j) are the fractions

Let Tdead and Tdiagn be respectively the time from infection to death and diagnosis and αk and δ k be the binary variables representing respectively the events to die (αk = 1) or be alive (αk = 0) and to be diagnosed (δ k = 1) or undetected (δ k = 0) on the k-th pandemic day, pj(k+j) and πj(k+j) can be expressed as the conditional probability to die or be diagnosed j days after infection
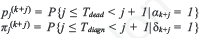
and
The ISS provided estimated quartiles (Q1, Q2, Q3) of time distributions from symptoms to death and diagnosis in three different periods of occurrence (March-May, June-September, and October- December). 23
Corresponding values of Yule-Bowley indexes  are equal or close to zero, indicating that ISS estimates for time to death are admissible under symmetric distributions except in the summer period (strongly biased by clusters of vacationers).
24
We do not consider these biased estimates and only used estimates within remaining periods (which are equal each other, Table 1). We added 5 days (the mean time from infection to symptoms)
25
to ISS estimates to obtain corresponding parameters estimates of the probability density function of time from infection to death and diagnosis
are equal or close to zero, indicating that ISS estimates for time to death are admissible under symmetric distributions except in the summer period (strongly biased by clusters of vacationers).
24
We do not consider these biased estimates and only used estimates within remaining periods (which are equal each other, Table 1). We added 5 days (the mean time from infection to symptoms)
25
to ISS estimates to obtain corresponding parameters estimates of the probability density function of time from infection to death and diagnosis
Crude and adjusted ISS quartiles of conditional times from symptoms to diagnosis and death with COVID-19, by three pandemic periods. Italy, December 2020.

ISS, estimates were adjusted to obtain corresponding parameters estimates of conditional times from infection to diagnosis and death. Data from https://www.epicentro.iss.it/coronavirus/sars-cov-2-decessi-italia#8;
YBI, Youle-Bowley index of asymmetry. It ranges in [-1,1] and is equal to 0 in case of symmetry; STD, standard deviation. It was calculated by the interquartile difference.

and
If necessary, we adjusted for symmetry by replacing the median with the center of quartiles and assumed that functions in (6) follow the truncated normal distribution

where μ and σ are the mean and standard deviation of the parent general normal probability with
We can note that the (4) with probabilities (5) derived from (7) can be also interpreted as a weighted moving average of period 2μ + 1 on time series dk + j and δ k + j

Choosing appropriate IFRks within waves
We simulated two scenarios with different IFRs: IFR (1) = 2.53% (2.31-2.77%) and IFR (2) = 1.15% (0.78-1.79%). The former is related to an overloaded health system and was calculated at the end of the first wave (on July/2020) through the ISTAT serological survey; the latter is related to an effective health system and is (to date) one of the most reliable estimates of lethality for high-income countries. 3 Through the (1) we estimated Nk in both cases

and studied the ratios Rk (i) of detected cases Δk among estimated infections Nk (i) on k-th day (Figure 1)

Ratio between detected and estimated cases of COVID-19 by IFR=1.15% (black curve) and IFR=2.3% (grey curve). Italy, February 2020 – February 2021.
If Rk (i)>1 (i.e Δk > Nk(i)) then the assumed IFR(i) overestimated the actual IFRk on the k-th pandemic day and the number of detected cases Δk for each death Dk (i.e., the ratio Δk /Dk) was greater than

For the second wave w2, we chose the IFR(w2) with related estimates of Nk (k ∊ w2) (3) most consistent with data. The (8) also provides a reliable cutoff for maintaining the daily rate IFRk under a fixed threshold: at k-th day, we should find more than 87 cases for each death for having IFRk<1.15% and more than 40 cases for having IFRk<2.53% (Figure 1). Finally, under the assumption of an effective health system (IFR=1.15%) and according to estimates in (3), the expected number of infections per death within age classes is shown in Table 1 of supplemental material.
Evaluating health policies
We defined the mean weekly death curve rate as the difference between the number of deaths at the first and the last day of the week divided by 7. We evaluated health policies by calculating the relative difference of these rates between the week before and after the day when the policies come into effect (Table 2). These relative differences are equal by construction to those of incidence cases of infections. Relative differences in the fraction of detected cases (Table 2 of supplemental materials) allowed for further considerations.
1-week variation of curve of deaths with COVID-19 by infection day before and after most important health policies. Italy, March 2020-February 2021.

Trentino opened high school January 7th; Abruzzo, Tuscany and Aosta Valley opened January 11th. I aggregated those openings to January 18th in order to evaluate the weekly rate.
Data access and cleaning methods
Data are open and can be downloaded in .csv format. 22 The region of Emilia-Romagna reported 154 deaths on August 15th that refer to March, April, and May. We redistributed those deaths to the right months using the observed regional mortality distribution in that period.
Results
During the first 350 days of the COVID-19 pandemic (from February 24, 2020 to February 7, 2021), Italy performed 34,362,726 tests, detected 2,639,972 cases, and recorded 91,273 deaths. Infections were distributed on two waves, the first one lasted 157 days (from 24th February to 29th July 2020), the second one (from 30th July 2020 to 7th February 2021) lasted 193 days. During the first wave, authorities detected 246,836 cases and performed 6,690,311 tests, during the second one they detected 2,393,136 cases and performed 27,672,415 tests. The monthly number of tests strongly increased from 488,307 in March 2020 to 6,068,119 in January 2021.
Deaths by infection day
The curve of deaths by day of infection increased up to 672 deaths on 14th March 2020 (the peak), then decreased down to a minimum of 6 deaths on 29th July 2020. The second wave started on July 30th, presented a peak of 695 deaths on 12 November 2020 and a hump with about 480 deaths from 16 to 29 December before decreasing down to 302 deaths on 7 February 2021 (Figure 2).
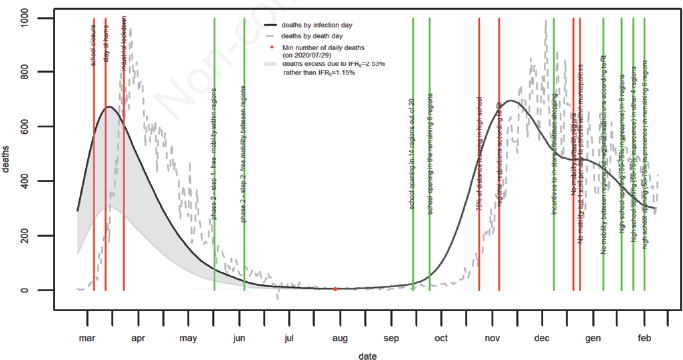
Number of deaths with COVID-19 by infection date. Italy, February 2020 – February 2021.
Lethality
By considering the first scenario (IFRk (1) = 2.53%) over the whole pandemic period, we obtain the ratio Rk(1) greater than 1 from July 20th to November 17th, 2020. By considering the second scenario (IFRk (2) = 2.15%) over the whole pandemic period we have the ratio Rk (2) greater than 1 just from August 8th to Septeber 5th, 2020 (Figure 1). To Keep data coherence, we assumed a daily infection fatality ratio equal to 2.53% within the first wave (IFRk = 2.53%, k
Incidence curve of infections
The Curve of incident cases is presented in Figure 3 and shows 6,664,655 (4,639,221-9,325,138) infections from the beginning to the 7-th of February 2021. The first wave had its peak of 26,575 new infections on March 14th, 2020 and ended within the last two weeks of July. The second wave started to grow slowly in august and increased faster from the last week of September onwards. It approached its peak of 60,425 infections on 12th November, was stable at about 41,500 between 17th and 29th December, and finally decreased to 26,288 on 7th of February 2021.
Health policies effects on estimated curves
During the first wave, the average number of deaths in Figure 2 had a relative reduction of 49% after the school closure of the 5- th of March 2020, of 120% after the restriction to the mobility of March 12th, 2020, of 44% after the industrial production lockdown while it increased relatively of about 28% after allowing first intraregional and later inter-regional mobility (Table 2). During the second wave, the average number of deaths relatively increased by 143% after the first partial opening of schools (of 14 out of 20 regions) and of 110% after the second one (of remaining 6 regions). The first restriction to the mobility on 24th October 2020 was followed by a rate relative reduction of 15%, while the second one (2020/11/05) of 66%. Government-induced spending incentives for in-store Christmas shopping (cashback scheme) announced on 8th December 2020 were followed by a rates relative increment of 54% and a change in the concavity of the curves (Figures 2 and 3). After restrictions of 20 and 24 December weekly rates relatively decreased by 800% and continued to decrease after the relaxation of regional restrictions (based on Rt) of January 7th, 2021. Rates increased up after the school's opening in January 2021. The proportion of detected cases strongly increased from the first to second wave (Figure 1), where they are close to the lower bound of estimated cases (Figure 3). The rate of detection increased after school opening and decreased after their closure except in a case (Table 2 of supplemental materials).
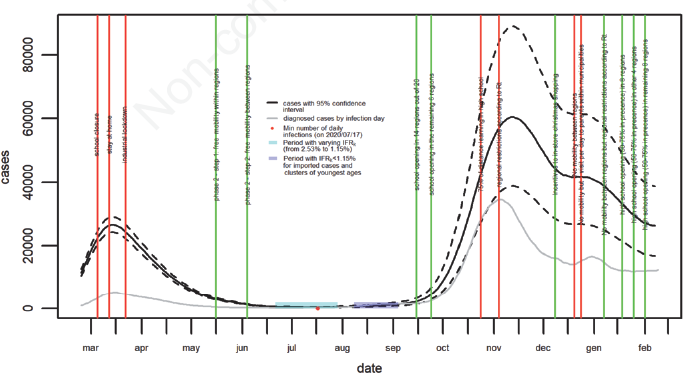
Estimated incidence curve of COVID-19 infections. Italy, February 2020 – February 2021.
Discussion
This paper provides a comprehensive picture of the COVID-19 pandemic in Italy of the first two waves (February 2020- February 2021) and its relationship with non-pharmaceutical health policies adopted by the Government.
Lethality
Virus lethality was different between the first and the second wave. Suitable infection fatality ratios were IFR(w1) = 2.53% within the first wave and IFR(w2) = 1.15% within the second one. From the 19-th of July to the 17-th of November 2020 an IFRk = 2.53% overestimates the actual one (Figure 2). In March and April 2020, hospitals in most affected areas were quickly overloaded causing an increase of 40% of deaths for any cause in Italy (for the same months of 2015-2019). 26 Furthermore, in Lombardy (the epicenter of the first wave) nursing homes were used as hospitals support resulting in unprecedented mortality among their residents.27,28 The lethality excess of COVID19 in the first wave (Figure 1) is in line with the mortality excess of deaths for any cause in the same period. An IFRk = 1.15% is not consistent with observed data from August 8th to September 4th (Figure 2), a lower one seems to be more suitable. This can be also seen by the ISS estimates of quartiles of time to death distribution in the summer period (Table 1), which are strongly affected by imported cases for summer holidays and younger age of infected people. Cases were mostly detected at airports and seaside and the mean age of infected people decreased under 30 years.24,29 After the peak of the second wave (from November 14th, 2020) IFRk = 2.53% was no longer inconsistent with data, supporting the assumption that hospitals overload (caused by COVID-19 incidence peaks) is associated with higher mortality. To keep lethality below 1.15%, authorities could daily look for more than 87 cases per death. Detecting less could mean that asymptomatic people were not quarantined or that infection was spreading in populations at higher risk of death (for example nursing homes). A reasonable warning event to introduce further restriction measures could be to find less than 56 cases per death, which corresponds to the lower bound of infections per death one should expect under the assumption of an effective health system (Table 1 of supplemental material, last row). Moreover, health authorities could use Table 1 of supplemental materials to estimate expected infections for each death by age class under the assumption of an effective health system.
Health policies
The higher lethality of the first wave is associated with a lesser daily average number of performed tests (43,503 vs 143,854). Testing infections contacts to find and quarantine asymptomatic people helped to reduce the infection fatality rate in the second wave by reducing the number of transmissions chains in populations and the resulting hospitals’ burden. Restrictions of population mobility were always followed by a time-trend inversion (from increasing to decreasing) of death and incidence curves and shorter lag-times (from actions to expected effects) were associated with stronger policies (Figures 1 and 3). If not introduced gradually (e.g., incentives to in-store shopping), removals of mobility restrictions were followed by an increment in curves rates. Strong and concentrated restrictions to mobility followed by their gradual removal are associated with a steeper wave, while gradual restrictions to mobility followed by a sudden removal are associated with a fatter wave. The lockdown of industrial production (2020/03/23) seems to have had a light additional effect on previous measures. Specific measures on student mobility are associated with changes in curves rates. Presumably, students flow could affect the virus spread by increasing inter-household contacts. 30 Since children and young people are often asymptomatic, less inclined than adults to social distancing, and more intensive users of public transport, they could drive the virus into their house as silent spreaders. Even if the proportion of detected cases increased from the first to the second wave, most likely there were still many cases that are left out from the contact tracing system. They presumably include irregular situations but probably also part of asymptomatic infections among the youngest people, since the proportion of detected cases decreased after school closure and increased after school opening. Arranging test campaigns at school entrance could have several advantages, such as i) school would remain open and the risk of infections would be evaluable; ii) infections could be detected outside; iii) national incidence among children and teenagers would be routinely counted.
Study limitations
The study is based on available data which do not contain the age of death and of detected cases. Variables distributions by age could allow more accurate model assumptions on distributions of times from infection to death and diagnosis, implying better estimates and possibilities to make reliable predictions. However, we run the analysis with several assumptions about the range of possible values of a function (7) and the results are robust (the length of the function domain only affects the smoothness of the incidence curve, the shape is the same).
Conclusions
A reasonable infection fatality ratio of the SARS-CoV-2 in high-income countries is 1.15%. Peaks in daily incidence (causing hospitals overload) are associated with possible higher infection fatality rates. Italian COVID-19 first wave was characterized by a lethality higher than the high-income countries average (2.53% vs 1.15%) probably due to the health system capacity saturation. The development of contact system tracing slowed the virus spread in the second wave and resulted in shortened periods of hospitals overload and lower lethality. The detection of at least 87 cases per death could be a useful cut-off for controlling virus spread and lethality. The detection of fewer than 56 cases per death could be a reasonable warning event to evaluate further restrictions measures. Restrictions on population mobility are effective within a suppression strategy. Removal of restrictions should be implemented by sequential steps for avoiding a quick rising of incident cases. Test campaigns could be organized at the entrance of schools, to block (at least in part) infections outside, to measure the risk of infection in a specific school (and activate/increase distance learning if needed), and to assess the national incidence among younger ages. Making all data publicly available would increase the support from all researchers.
Footnotes
The author declares no conflict of interest.