
Abstract
Background
Air pollution has caused health and environmental problems around the world. In this study we analysed the temporal evolution of air pollution in Cotonou regarding the standards of Benin and of World Health Organization (WHO).
Design and methods
Solar-powered electrochemical sensors (CO: carbon monoxide, SO2: sulphur dioxide, and O3/NO2: ozone/nitrogen dioxide) and photoionization detectors (for NMVOC: nonmethane volatile organic compounds) were permanently installed and monitored from June 2019 to March 2020 at Akpakpa PK3 (A) and Vèdokô Cica-Toyota (B) roundabouts.
Results
CO and SO2 concentrations at both roundabouts were significantly higher on weekends than on weekdays. The concentrations of NMVOC and O3 / NO2 on Sunday differed considerably from the other days of the week at A and B, respectively. There was a positive linear correlation between the concentrations of CO and SO2, O3 / NO2 and SO2, and CO O3 / NO2 to B, and only between CO and O3 / NO2, in A. At the two sites, the average of SO2 concentrations (in μg/m3) were higher than the WHO standard (500) for an exposure of 10 minutes (2258 A and 2143 B) and the Benin standard (1300) for 1 hour exposure (2181 in A and 2092 in B).
Conclusion
Air pollution varies in hours and days in Cotonou. Standards are respected, except for SO2. Particular attention should be paid to the concentrations and the possible sources of gas. More sophisticated monitoring system should be put in place.
Significance for public health
Air pollution negatively impact the health of the population. In Benin, many people make professional activities around roads, especially at roundabouts. Therefore, air pollution, therefore, does not affect only road users, but also a large number of professionals, who are, mainly, women. This study showed the evolution of certain air pollutants over time according to WHO and Benin standards. It serves as an advocacy and decision-making tool for the definition and implementation of strategies to mitigate and prevent the consequences of this pollution.
Introduction
Air pollution is defined as the contamination of an indoor or outdoor environment by a chemical, physical or biological agent that modifies the natural characteristics of the atmosphere. 1 The WHO (World Health Organization) estimates that approximately nine out of ten people worldwide breathe polluted air 2 and this pollution kills approximately seven million people every year. 3 This phenomenon is growing in most parts of the world, especially in the poorest regions, such as Africa and Asia. For example, a study published in 2016 by the Organization for Economic Cooperation and Development (OECD) reported that the number of premature deaths caused by air pollution in Africa increased by 36% between 1990 and 2013.4,5 Other studies carried out in some African capitals have revealed various pollutants in the air with concentrations higher than WHO standards: this was the case of CO in Nigeria, 6 particulate matter in Senegal 7 and Ghana, where poor neighbourhoods are the most polluted.8,9 In several African countries, the standard limits are often exceeded with health risks for the populations9-11 in countries such as Mauritania, 10 Burkina Faso 11 and Ivory Coast. 12 The same is certainly true for Benin.
WHO estimates that among adult deaths attributed to air pollution, 43% are due to chronic obstructive pulmonary disease, 29% to lung cancer, 25% to stroke, and 24% to heart disease. 2 In Nigeria, air pollution is responsible for one in five child deaths.13,14 In Benin, Lawin et al. studied the exposure of motorcycle- taxi drivers to CO and its impact on respiratory health. 15 Avogbe et al. examined driver's exposure to benzene and showed that concentrations below 3.2 mg/m3 could cause an increase in IgG immunoglobulin and a decrease in platelets and white blood cells (lymphocytes, eosinophils). 16 Ayi-Fanou et al. demonstrated that exposure to benzene and polycyclic aromatic hydrocarbons increased DNA adducts in street vendors, motorcycle-taxi drivers, gasoline vendors and populations living near roadways, in contrast to persons living in rural areas and people living near roads, unlike people living in rural areas. 17 Air pollution affects the environment: it is involved in the formation of acid rain and thus impacts the productivity of plants, it also harms aquatic life. 18
Taking into account the above and taking into account the increase in epidemiological diseases linked to air contamination, 4 each country better understands the severity of air pollution and tries to limit its damage. The present study was established in this context. Its general objective was to assess the level of air pollution in the economic capital of Benin, more specifically, to examine the temporal evolution (hourly and daily) of some pollutants and to compare the recorded values to national and international standards.
Design and Methods
Study locations
Two sites were chosen for this study because of their high traffic density: Akpakpa PK3 and Vèdokô Cica-Toyota roundabouts. These are key crossing points linking three major cities in Benin: Porto-Novo, Cotonou and Abomey-Calavi. People have to go through them to reach their workplaces in Cotonou, the economic capital. Furthermore, Akpakpa PK3 roundabout is located in an industrial area where there are brewing, gas production, paint manufacturing factories, and a power station nearby. The roundabout of Vèdokô Cica-Toyota roundabout, on the other hand, is surrounded by a cluster of houses, stores and shops. Their geographic coordinates are 6°22’01″N 2°27’52″E for the Akpakpa PK3 roundabout and 6°22’37”N 2°23’23”E for the roundabout of Vèdokô Cica- Toyota roundabout (Figure 1).

Map of the city of Cotonou with the roundabouts Akpakpa PK3 and Vèdokô Cica-Toyota. Geographical coordinates (roundabout A: 6°22′01″N 2°27′52″E; roundabout B: 6°22′37″N 2°23′23″E).
Materials and data collection
Two “CairPol” solar-powered sensors were used to monitor air pollutants in the city of Cotonou. Each station consisted of a fixed metallic pole, a solar panel mounted 1.5 m off the ground, and a box housing three sensors: one ozone/nitrogen dioxide (O3/NO2) sensor; one sulphur dioxide (SO2) sensor; and one carbon monoxide (CO) sensor. These 3 sensors are electrochemical. After one month of recording, the SO2 sensor at the Akpakpa PK3 roundabout became defective and was replaced with a nonmethane volatile organic compound (NMVOC) sensor. The latter is not electrochemical but is rather a photoionization detector (PID). The solar panels provided a continuous power supply to the sensors, thus allowing the automatic recording of pollutant concentrations every 15 mins. These data were then retrieved using a microcomputer. During this study, the monitoring lasted from June 2019 to March 2020 (except for the month of December 2019). It should be noted that the SO2 data from the site of Akpakpa PK3 were only available for June 2019.
Data processing and analysis
Data processing and analysis were performed using the Microsoft Excel spreadsheet programme and RStudio data analysis software (ver. 4.0.2 and 1.1.463). The latter permitted descriptive statistics, Pearson's correlation tests (α=0.05), Wilcoxon tests (α=0.05) and ANOVA (analysis of variance).
Results
Full description of the data collected
It has been made a comparative analysis of the pollutant concentration data recorded at the two sites in terms of time parameters (hour and day). Then, the data have been compared to specific standards.
A general description of the monitored air pollutants concentrations is presented in Table 1. This table shows CO concentration levels on the two roundabouts. The minimum level on the roundabouts were “0”, whereas the maximums were 1734x104 μg/m3 and 2340x104 μg/m3 on Akpakpa PK3 roundabout and Vèdokô Cica-Toyota roundabout, respectively.
The means values were 3.325×10³ μg/m3 at Akpakpa PK3 roundabout and of 3.314×10³ μg/m3 at Vèdokô Cica-Toyota roundabout. For O3/NO2, the mean concentration level was higher at Akpakpa PK3 than at Vèdokô Cica-Toyota (1.151×10² μg/m3). The minimum O3/NO2 level recorded at Vèdokô Cica-Toyota (4 μg/m3) was the half the minimum level recorded at Akpakpa PK3 (8 μg/m3).
Statistical description of the variables measured at the two intersections.

COAk, CO Akpakpa PK3; COVe, CO Vèdokô Cica-Toyota; O3Ak, O3/NO2 Akpakpa PK3; O3Ve, O3/NO2 Vèdokô Cica-Toyota; SO2Ak, SO2 Akpakpa PK3; SO2Ve, SO2 Vèdokô Cica-Toyota; NMVOCAk, NMVOC Akpakpa PK3; SE mean, standard error of the mean; CI mean, 95% confidence interval of the mean; SD, standard deviation. The unit of measurement is g/m3.
Regarding SO2, the mean concentration was higher at Akpakpa PK3 roundabout. However, it is important to point out that the SO2 sensor at this site became defective after just 1 month of recording. Since NMVOC concentration levels were not monitored at the roundabout, of Vèdokô Cica-Toyota, no comparison was possible. Overall, the roundabout of Akpakpa PK3 seemed slightly more polluted than Vèdokô Cica-Toyota roundabout.
Figure 2 allowed us to take a different approach to data analysis. This figure shows that the distributions of CO gas at both roundabouts were similar. The concentrations varied between 0 and 10,000 μg/m3, with 75% of the concentration levels less than or equal to 5000 μg/m3. The recorded values at Akpakpa PK3 roundabout were slightly higher than those at Vèdokô Cica-Toyota roundabout. For O3/NO2, the distributions were also similar at both roundabouts.
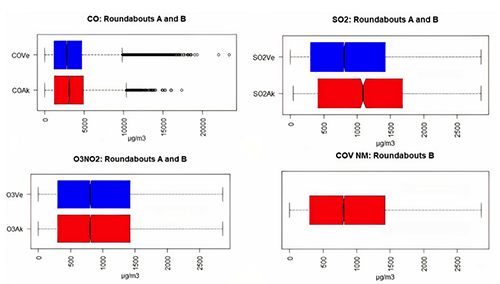
Distribution of CO, SO2, O3/NO2 and NMVOC concentrations at the Vèdokô Cica-Toyota (roundabout B) and Akpakpa PK3 (roundabout A) roundabouts (μg/m3). COVe, CO Vèdokô Cica-Toyota; COAk, CO Akpakpa PK3; SO2Ve, SO2 Vèdokô Cica-Toyota; SO2Ak, SO2 Akpakpa PK3; O3Ve, O3/NO2 Vèdokô Cica-Toyota; O3Ak, O3/NO2 Akpakpa PK3; NMVOCAk, NMVOC Akpakpa PK3.
Although the SO2 minimum and maximum values at both roundabouts were similar, there was an asymmetry in the values recorded at Vèdokô Cica-Toyota roundabout that was skewed to the right. On the other hand, the asymmetry in the Akpakpa PK3 values was skewed to the left. This asymmetry reveals higher SO2 concentrations at Akpakpa PK3 roundabout, thus confirming the observations presented in Table 1.
The NMVOC concentrations varied between 0 and 5870 μg/m3, with an asymmetry that indicates more values closer to the minimum than to the maximum. These results do not contradict those of Table 1.
Hourly variation in air pollution
The observed variations in the air pollutant concentrations (CO, SO2, O3NO2 and NMVOC) can also be analysed in terms of time parameters (hour and day). These variations are presented in Figure 3a.

Mean hourly concentrations of air pollutants at the two sites (a). Daily variations in air pollutant concentrations at the two sites (b). CO, carbon monoxide; SO2, sulfur dioxide; NMVOC, non-methane volatile organic compounds; O3/NO2, ozone/nitrogen dioxide.
The variations in CO and SO2 concentrations were generally comparable during a 24-hour period with two maximums: the first in the morning (between 6 and 8 a.m.) and the second at the end of the day (between 5 and 8 p.m.). Two minimums were recorded: one in the early afternoon (between 12 noon and 3 p.m. and in the early hours of the morning (between 1 and 5 a.m.). With regard to O3/NO2, the variation in concentrations presented a maximum at approximately 3 p.m. (at both roundabouts) and a minimum at approximately 5 a.m. On the other hand, the NMVOC concentrations showed a peak in the morning around 7:30 a.m. and a minimum between noon and 6 p.m.
The hourly variations in the maximum and minimum concentrations by site are presented in Table 2. We found that apart from O3/NO2, the maximum and minimum concentrations of the studied air pollutants were observed in the same time slots.
Time of minimum and maximum air pollutant concentrations at the two sites.

COAk, CO Akpakpa PK3; COVe, CO Vèdokô Cica-Toyota; O3Ak, O3/NO2 Akpakpa PK3; O3Ve, O3/NO2 Vèdokô Cica-Toyota; SO2Ak, SO2 Akpakpa PK3; SO2Ve, SO2 Vèdokô Cica-Toyota; NMVOCAk, NMVOC Akpakpa PK3.
ANOVA test
This test carried out between the different time variables (hours and days) showed that hour and day are associated with significant differences in pollutant concentrations (p<2e-16, with alpha=5%). Time variables therefore have a significant impact on the variation in pollutant concentrations.
Daily variations in air pollution
Figure 3b shows the daily variations in the concentrations of air pollutants at the two sites in Cotonou. In general, the concentrations of air pollutants are high on Mondays and remain constant on Tuesdays. These concentrations decrease slightly on Wednesdays and Thursdays then increase to reach their maximum values on Fridays. On weekends, they decrease again to reach their minimum values on Sundays, except for the NMVOC at Akpakpa PK3, which remains practically constant every day of the week. Regarding O3/NO2, the difference is only significant at the roundabout of Vèdokô Cica-Toyota between Sundays and the other weekdays. Finally, NMVOC also exhibited a significant difference between Sundays and other days of the week.
Wilcoxon test
A Wilcoxon test was carried out to detect a possible difference between working days and weekends. It appears that the concentrations of CO and SO2 differ significantly from the concentrations recorded on working days. The same observation was made between Sundays and other days of the week for NMVOC at the site of Akpakpa PK3 and for O3/NO2 at the site of Vèdokô Cica- Toyota (p<0.05, with alpha=5%).
Comparison of the air pollutant concentrations to the standards
The summary of the standards set by the Republic of Benin and the WHO, as well as the air pollutant concentrations recorded at the two sites, are presented in Table 3. It appears that the CO standards were not exceeded. Regarding SO2, the national and WHO standards were exceeded. The standards for NO2 and O3 were respected. All recorded values were lower than the standards even when considering the O3/NO2 pair instead of these gases individually, except for the WHO standard for 1 hour of exposure to O3. Regarding VOCs, no standards have been set by Beninese regulations, and WHO standards do not apply to the sum of all NM VOCs, but only to some.
Comparative table of standards and mean pollutant concentrations at the two sites

Analysis of the correlations between the pollutant concentrations and the variables day/hour
In Table 4, a strong positive correlation can be seen at the roundabout of Vèdokô Cica-Toyota between SO2 and CO. There were also moderately positive correlations between CO and O3/NO2, between CO and SO2, and between SO2 and O3/NO2. Table 4 presents their statistically significant correlation coefficients (p<0.05), with respectively values of 0.892, 0.529 and 0.473. A positive correlation was also observed between CO and O3/NO2 at the at the roundabout of Akpakpa PK3, with a correlation coefficient of 0.466.
Pearson's correlation coefficients of pollutant gases at the two sites (α=0.05).
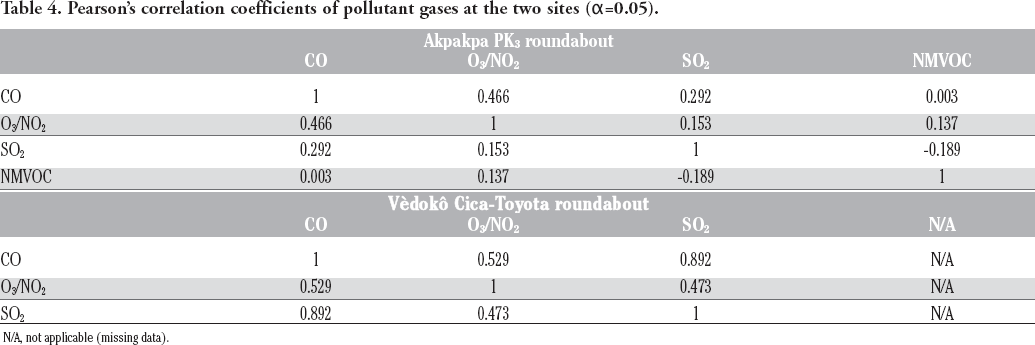
N/A, not applicable (missing data).
Discussion
Regarding the results found in the full description, it turned out that Akpakpa roundabout is more polluted than Vèdoko roundabout, but this observation does not consider the data bias for the SO2 pollutant.
Indeed, the total number of measurements carried out on this site was significantly lower than that of Vèdokô Cica-Toyota, thus creating a potential bias in the data. This gives an indication of the overall behaviour of these gases at the two sites. Further analysis is needed. It is in this context that the next step was to study this variation over a 24-hour period.
An hourly variation of these pollutants shows two maximum (between 6 and 8 h; between 5 and 8 h) and two minimum (between 12 and 15 h; between 1 and 5 h). These results are similar to those of Nigeria at Park Agbor reported by Ukpebor et al., where the highest concentrations were recorded in the morning between dawn and noon and then between 4 and 7 p.m. 19 The ANOVA test allowed them to determine that the factors responsible for these hourly variations were the traffic flow, differences in the volume of urban traffic and the weather conditions (especially the wind velocity). Our results were also similar to those of Rozante et al., who reported variations with two daily peaks (between 8 and 9 a.m. and then between 7 and 8 p.m.), which they attributed to road traffic in São Paulo. 20 With respect to SO2, similar variations were observed in New York: the recorded concentrations peaked between 9 and 10 a.m. and decreased until 2 p.m.), before rising to a new peak in the early evening hours. 21
About O3/NO2, a maximum peak was observed at approximately 3 p.m. and a minimum peak at approximately 5 a.m. at both sites, while the NMVOC concentrations showed a peak at periods inverse to those observed for O3/NO2 (a maximum peak at 7:30 a.m. and a minimum between 12 and 6 p.m.). Thus, NMVOC and O3/NO2 concentrations changed in the opposite directions.
These observations support the knowledge that ozone is a secondary pollutant resulting from a photochemical reaction of ultraviolet light with volatile organic compounds and nitrogen oxides, among others. 2 Menchaca-Torre et al. also observed a peak in VOC concentrations between 6 and 10 a.m. and then a gradual decrease to a minimum between 2 and 6 p.m. before another rise. 22 From their study of the relationship between O3, VOC and nitrogen oxides, they concluded that the low O3 concentrations in the morning were the result of their contribution to oxidation reactions at night. Indeed, O3 can react in the atmosphere in the presence of nitric oxide to produce oxygen and nitrogen dioxide. 23 Accordingly, the highest O3 concentrations were observed between 2 and 6 p.m., when the concentrations of nitrogen oxides and VOCs were the lowest. 22
The hourly variations in the maximum and minimum concentrations by site presented in Table 2 shows that apart from O3/NO2, the maximum and minimum concentrations of studied the air pollutants were observed in the same time slots. These results further validate the influence of the rush hour and, by extension, road traffic on air pollution. For the recorded values, the morning highs at the Vèdoko Cica-Toyota roundabout were higher than those at the Akpakpa PK3 roundabout. The situation was reversed in the afternoon. This observation could be the result of variations in wind direction and intensity throughout the day. This aspect remains to be investigated. In these two roundabouts, air pollution seems to be related to human activity and depend on mobile and fixed pollution sources. The daily variation will provide further information in pollutant comportment.
The daily variations Figure 3b shows the daily variations in the concentrations of air pollutants at the two sites in Cotonou. In general, the concentrations of air pollutants are high on Mondays and remain constant on Tuesdays. These concentrations decrease slightly on Wednesdays and Thursdays and then increase to reach their maximum values on Fridays. On weekends, they decrease again to reach their minimum values on Sundays, except for the NMVOC at Akpakpa PK3, which remains practically constant every day of the week.
These observations could be explained by the movements of populations, which are highest during the week (work-related activities) and decrease to a minimum throughout the weekend. Gour et al. also noticed a decrease in the concentrations of air pollutants (CO, O3, NO2 and SO2) on weekends compared to weekdays. The researchers linked these observations to the weekly cycle of human activities. 24
Indeed, the Wilcoxon test showed a significant difference (p<0.05) between the concentrations of CO and SO2 on weekends compared to those on working days.
Regarding O3/NO2, the difference was only significant at the Vèdokô Cica-Toyota roundabout between sundays and the other weekdays.
Finally, NMVOC also exhibited a significant difference between Sundays and other days of the week. Their sources would be heavy vehicles transporting goods and the many industrial companies present in the Akpakpa PK3 area. Some of these continue to operate on Saturdays or even through the entire weekend and they are stationary sources of pollution. According to the United States Environmental Protection Agency (EPA), VOCs are released mainly during the manufacture of tools and materials and pollute outdoor air. 25 In addition, VOC pollution can originate from sources such as paints, paint strippers and other solvents. 26 Well, in Akpakpa PK3 area, there are no fewer than four paint manufacturing factories: the SOBEPEC: “Société Béninoise de Peintures et de Colorants”; the SIBIC: “Société Italo-Béninoise d'Industrie et de Commerce”; the SCIL Peinture Bénin, which also manufactures paints and varnishes and the SBIP: “Société Bénino-Italienne de peinture”). Large amounts of NMVOCs are released by the numerous factories in this zone (by their chimneys), and these NMVOCs contribute to local air pollution both indoors and outdoors. Furthermore, the area surrounding the Akpakpa PK3 roundabout is a central transit and parking area for heavy goods vehicles, especially on weekends. In this context, the State issued an interdepartmental decree (n. 051 of May 26, 2008) to improve the flow of traffic at peak hours during working days, prohibiting the circulation of all heavy weights trucks between 6.30 a.m. and 9.30 a.m. and between 6 p.m. and 8 p.m. on the main roads of Cotonou and the Akassato-Cotonou, Cococodji-Cotonou and Porto-Novo- Cotonou sections. 27 Another prefectural decree authorizes the circulation of heavy weights trucks outside peak hours, from 9 a.m. to 12 noon, from 4 to 6 p.m. and from 10 p.m. to 6 a.m., but only on the section going from the Cica-Toyota roundabout to the “Three banks” roundabout. 27 Consequently, heavy goods vehicles have more freedom to circulate on weekends, and conduct loading and unloading, which would explain the NMVOC observations at this roundabout.
Considering these observations, the question of compliance with standards set out in the two decrees arises. The summary of the standards set by the Republic of Benin and the WHO, as well as the air pollutant concentrations recorded at the two sites, are presented in Table 3.
It appears that the CO standards have been respected, and the national and WHO standards of SO2, were exceeded. Although short-term exposure to this gas causes respiratory difficulties, this gas can also interact with other pollutants, such as particulate matter (PM), combining with them and then migrating into the lungs generating health problems 28 . The recorded SO2 concentrations could be due to the quality of the fuel generally used in Africa. Indeed, in Benin, most of the population uses gasoline sold in the informal sector, the quality of which is not controlled. For example, a study by the Directorate-General for Domestic Trade revealed the sale of 48×106 litres of gasoline at the pump versus 26.18×10⁷ litres in the informal sector in 2006, i.e., five times more. 29 In addition, a 2016 Swiss study highlighted that the sulphur content of fuels sold in Africa (even at service stations) reaches 7780 ppm, a concentration 378 times higher than the health standards in Malta. However, samples taken at service stations in Benin revealed sulphur levels of approximately 2700 ppm.30-32 This pollution is amplified by the large-scale use of second-hand vehicles that consume large amounts of fuel. Concerning the standards for NO2 and O3, they were respected for national and WHO standards.
There are not VOCs, but toluene, xylene and benzene WHO standards, so it is not possible to concluded. In fact, the photoionization detectors used in the present study did not provide measurements for specific VOCs (benzene, xylene, toluene and others). It seems wise, however, not to lose sight of the fact that certain VOCs, such as benzene, are declared very toxic by the WHO regardless of the concentration level considered. Indeed, they are associated with ocular and respiratory symptoms and are also implicated in cancers. 25 For their potential sources, VOCs can come from exhaust gases, factory chimneys, solvents, paints and others. 33 There are many of these potential sources in the vicinity of the Akpakpa PK3 roundabout.
Overall, regardless of whether the national and international standards were met, it appeared from the above observations that the concentrations of some pollutants evolved in a similar way (CO and SO2) or could be linked (O3NO2 and NMVOC). It was therefore necessary to analyse the potential correlations between these concentrations and the time parameters (hour and day).
In general, regardless of whether the national and international standards were met, it appeared from the above observations that the concentrations of some pollutants evolved in a similar way (CO and SO2) or could be linked (O3NO2 and NMVOC). It was therefore necessary to analyse the potential correlations between these concentrations and the time parameters (hour and day).
In Table 4, a strong positive correlation can be seen at the Vèdokô Cica-Toyota roundabout between SO2 and CO. Lee et al. had previously found such a correlation. 34 These two gases could be emitted at the same time through the incomplete combustion of fuels during traffic.
Between CO and O3/NO2, there were also moderately positive correlations, same for CO and SO2, and between SO2 and O3/NO2. Table 4 presents their statistically significant correlation coefficients (p<0.05), with values of 0.892, 0.529 and 0.473, respectively. A positive correlation was also observed between CO and O3/NO2 at the Akpakpa PK3 roundabout, with a correlation coefficient of 0.466. This difference between the two intersections can be explained by the different sources of fixed and mobile pollution present at these two roundabouts, but also by the difference in the quantity of data for SO2.
Conclusion
The present characterization study of the air pollution in Cotonou, the economic capital of Benin, showed variations in the concentrations of the air pollutants monitored (CO, SO2, O3/NO2 and NMVOC) as a function of the hour, the day of the week and thus of road traffic. Indeed, the pollution levels, though similar, varied from one site to the other, with peaks during rush hours. These suggested sources of pollution that were both mobile (such as automobiles and vehicles with two or more wheels) and fixed (such as factories, especially in the area surrounding the Akpakpa PK3 roundabout).
The study further indicated that national and international SO2 standards were exceeded in the city of Cotonou. As a result, there is a need to pay particular attention to both the concentrations and to the possible sources of these pollutants in Cotonou.
The results presented could have been refined with the addition of meteorological data (temperature, humidity, pressure, radiation index, wind direction and speed) if these data had been jointly collected during the monitoring period. Nevertheless, this study is of interest because it allowed a better understanding of the variations in air pollution in the city of Cotonou. The excess pollution could turn out to be much larger with the inclusion of a wider range of air pollutants in future studies. Thus, it would be wise to set up a more refined surveillance system and extend it to other cities in Benin.
Footnotes
Acknowledgements
We thank the Minister of Living Environment and Sustainable Development of Benin, Mr. José Tonato for allowing this research to be conducted, and the Laboratory of Environmental Studies and Monitoring of Cotonou.