
Abstract
Background
Health information records in many countries, especially developing countries, are still paper based. Compared to electronic systems, paper-based systems are disadvantageous in terms of data storage and data extraction. Given the importance of health records for epidemiological studies, guidelines for effective data cleaning and sorting are essential. They are, however, largely absent from the literature. The following paper discusses the process by which an algorithm was developed for the cleaning and sorting of a database generated from emergency department records in Lebanon.
Design and methods
Demographic and health related information were extracted from the emergency department records of three hospitals in Beirut. Appropriate categories were selected for data categorization. For health information, disease categories and codes were selected according to the International Classification of Disease 10th Edition.
Results
A total of 16,537 entries were collected. Demographic information was categorized into groups for future epidemiological studies. Analysis of the health information led to the creation of a sorting algorithm which was then used to categorize and code the health data. Several counts were then performed to represent and visualize the data numerically and graphically.
Conclusions
The article describes the current state of health information records in Lebanon and the associated disadvantages of a paper-based system in terms of storage and data extraction. Furthermore, the article describes the algorithm by which health information was sorted and categorized to allow for future data analysis using paper records.
Background
Significance for public health
In our protocol, we explain the process by which health information collected from paper-based records were analyzed to develop an algorithm to allocate appropriate ICD 10 disease codes and categories to each entry. The algorithm allows for the sequential analysis of the information present and serves to overcome the issue of incomplete records. This is especially relevant in developing countries where paper-based records are highly relied upon, noting that our protocol has already been applied to a study in the Ivory Coast. The protocol allows for a health information database to be cleaned and sorted for research in environmental, social and occupational health. Furthermore, since data cleaning and sorting protocols are sparse, it is crucial to establish a standardized tool to enhance the quality of the conducted research.
The association between increased air pollutant levels and increased mortality and hospital admissions for respiratory diseases has been well established for the past 70 years. It was first observed following the historical 1952 London smog episode. 1 Moreover, it continues to be observed.1-11 Recent developments in public health have led to air pollution being declared the leading environmental cause of premature death globally, surpassing poor sanitation and the lack of drinking water. 12 According to the Health Effects Institute (HEI) State of Global Air report, 4.1 million deaths from heart disease, stroke, lung cancer, chronic lung disease and respiratory infections were due to exposure to PM2.5 in 2016. This ranks ambient particulate matter concentrations as the 6th leading cause of early death. 13 In the UK, elevated levels of PM10 were correlated with higher hospital admissions for respiratory disorders and higher mortality from respiratory disorders. 14 Similar findings were observed in France for SO2 and PM13. 15 Internationally, chronic PM2.5 exposure is linked to cardiorespiratory and neurocognitive disorders as well as diabetes12,16 and the risk of developing chronic obstructive pulmonary disease 17 and severe lower respiratory tract infections. 18 In utero and childhood exposure to particulate matter may also predispose individuals to infectious and inflammatory disorders19,20 as well as impaired lung function, 21 especially in asthmatic children. 22
Similar associations have been found in Lebanon, where increasing concentrations of PM2.5 and PM10 were found to be positively correlated with increased emergency hospital admissions for respiratory diseases among children. 23 They were also associated with increased rates of emergency hospital admissions for respiratory and cardiovascular diseases among the adult and elderly populations. 23 Moreover, one study showed that geographic residence near industrial factories led to increased exposure to industrial air pollutants and particular matter and placed children at higher risk of developing respiratory problems than those living farther away (4-7 km). 24 In another study investigating the factors associated with chronic bronchitis, the authors determined that living close to busy roads or local powerplants were among the factors associated with the development of chronic bronchitis. 25
Understanding the dynamics of pollutant levels and their relationship to health events is essential to provide sound evidence for policies to prevent and mitigate further deleterious health outcomes. In Lebanon, where socio-political circumstances do not always permit new research, the existing abundance of data can lead to substantive evidence for preventive policies.
Many studies have suggested using a Big Data approach to generate evidence for policy making. The earliest application of Big Data analysis was performed by John Snow in the London cholera outbreak of 1854. This example was used by Khoury and Ionnides to argue that, despite numerous challenges, sifting through data to isolate true signals from massive amounts of noise must be performed to translate information into means by which societal health can be improved. 26 Pollutant levels are measured by real-time or continuous monitoring. Novel techniques for predicting air pollution information involves monitoring data obtained from meteorological monitoring, traffic flow, human mobility and road networks.27,28 Moreover, asthma related emergency department (ED) visits could be predicted from pollutant monitoring, social media posts and search engine queries with 70% precision. 29
To perform such searches, one would first require that the available data be properly handled to ensure its quality and reliability. As Huang et al. coin it, “the quality [of the dataset] determines the upper bound of the data product, i.e. garbage in garbage out”. 30 Though the integrity of the dataset is essential, little exists regarding the management of data. Data sorting and handling protocols and articles discussing data cleaning and handling have largely been subjects of grey literature. 31 Instead, the literature is saturated with discussions focusing on the role of study design, protocol adherence and investigator experience in determining study validity. 31 Several protocols have been described32-34 and recommendations have been outlined for database selection 34 and data management, 35 but none have established guidelines for efficient and ethical data cleaning.
In this article, the process of data collection, handling and sorting is outlined. We hope to contribute to the development of a standardized data cleaning and coding protocol that serves to improve the quality of a database generated from paper-based medical records.
Design and methods
Sample selection
Three hospitals with emergency departments located in densely populated areas in the city of Beirut were selected. The city of Beirut was chosen because of the availability of air pollution data. 36 The selected hospitals were chosen due to their proximity to pollutant measuring stations, the presence of an ED and their reception of large volumes of patients. The data sample was selected from a larger database collected for the Beirut Air Pollution and Health Effects (BAPHE) study performed by Nakhlé et al. 36
Data collection
The data was collected from January 1, 2012 till December 31, 2014. The protocol, however, was developed in June 2016. At the time of data collection, Lebanese health institutions relied primarily on paper-based records. ED records for the years 2012, 2013 and 2014 were obtained from the hospitals’ archives. IRB to access patient records was obtained from the respective institutions. From each record, the following information was collected by a trained professional: patient's age, sex, date of presentation, chief complaint, differential diagnosis, final diagnosis, medications, and the name of the treating physician. The data collection process is described in detail by Nakhlé et al. in another study. 36 The data was collected using Microsoft Excel, inspected by the principal investigator, and validated by two senior physicians/ epidemiologists.
Description of the database
The information was sorted into three major categories. Logistic information included the patient's file number, the date of presentation to the ED and the hospital from which the record was obtained. Demographic information included the patient's age and sex. Lastly, health information included the initial complaint, the differential diagnosis, the final diagnosis, admission/discharge status and the administered medications.
The variables chosen for this study are summarized in Table 1.
Description of date of presentation
A patient's date of presentation was entered using a DD/MM/YYYY format, given its versatility in time-series analyses. Sorting of the dates revealed benign clerical errors that were easily corrected. For this study, the dates ranged between 1st January 2012 and 31st December 2014. Patients who presented prior to 1st January 2012 or after 31st December 2014 were excluded from the study. For entries with missing dates, “NA” was entered. Given that the purpose of the study is to code and categorize entries based on health information, entries with missing dates of presentation were not excluded. The remaining information was studied and used to develop the coding and categorization algorithm.
Counts were then performed on a daily, monthly, seasonally, and yearly basis. For seasons, the following definitions were used:
Winter: 1/1/201X - 20/3/201X
Spring: 21/3/201X - 20/6/201X
Summer: 21/6/201X - 20/9/201X
Autumn: 21/9/201X - 31/12/201X
Categorization by age
Age groups were defined according to the United Nations recommended age groups for studying health, health services and nutrition. 37 When age was not available in the database, the code “NA” was entered.
Variables chosen for the study.

Categorization by gender
Two genders were described and given appropriate codes for this study. Males were given the code “M” whereas females were given the code “F”. Missing values were coded as “NA”.
Categorization by disease
Health information in each medical record includes the chief complaint, the differential diagnosis, the final diagnosis and finally management plan. The collected health information was segregated into several categories. First, the chief complaint at presentation was recorded. Second, the differential diagnosis was recorded. When available, the final diagnosis was recorded as well as the medications used to manage the patient and the name of the treating physician. Several disease categories were described based on the WHO International Classification of Diseases 10th edition (ICD10). 38 Furthermore, to better demonstrate the data, disease codes were described for various disease categories. Respiratory diseases, for example, are represented by their ICD10 code range of J00-J99. Based on the literature, general disease categories with their corresponding code ranges as well as specific diseases with their specific ICD 10 codes were described. This was done to better represent these pathologies. For example, bronchitis, asthma and emphysema represent obstructive respiratory diseases, a subset of the general respiratory disease category. To represent obstructive pathologies, the code range J40 - J47 was described and used instead of the code range J00 – J99 which corresponds to the general respiratory disease category.
Entries were initially included based on chief complaints. Chief complaints, however, are nonspecific and may not be reflective of a final diagnosis. Furthermore, since various pathologies may have common presentations, the same chief complaint may be reflective of more than one distinct disorder. Chest pain, for example, is a nonspecific complaint that may be present in cardiac, respiratory, gastrointestinal, musculoskeletal or psychiatric disorders. Thus, entries that initially met the inclusion criteria may ultimately not fit the study objectives and would require reclassification or even exclusion. To represent these entries, the algorithm was developed to include error codes and categories.
Statistical analysis
Descriptive analysis of the data was performed using Microsoft Excel. Counts were established for each variable. Bar graphs were plotted as well. Lastly, code and category counts were performed by day, month, season and year to demonstrate the data over time for future analysis.
Results
Code and category allocation
An ED visit is a brief interview to address a specific complaint. Often, a final diagnosis is not reached. Paper-based medical records suffer from incomplete or missing data. This issue is especially prevalent in Lebanon. Furthermore, due to institutional preferences, classification using ICD10 codes and categories is not universally performed. To address this issue, the collected health information was sequentially analyzed to allocate an appropriate disease code and category for each entry. First, an entry was inspected to determine the completeness of the health information. If a final diagnosis was present, an appropriate code and category was then allocated.
During the initial phases of the study, codes and categories were allocated based on chief complaint. These served as preliminary set of codes and categories. To best represent the entry, the information present per entry was analyzed in its entirety to allocate the most appropriate code and category. This subsequently minimizes errors that may lead to over or underrepresentation or certain categories or codes.
Code and category allocation begin by first determining if a chief complaint is documented. If one were present, then preliminary codes and categories were allocated during the data collection. To ensure the preliminary code and category adequately represents the entry, the remainder of the health information is analyzed beginning with the final diagnosis. If a single diagnosis is present and has been selected for the study, an appropriate code and category are allocated. If these match the preliminary set, no change is made. However, if a mismatch is present, the code and category allocated to the final diagnosis is favored. Error codes and categories are allocated when the final diagnosis is not selected for the study. When multiple diagnoses are present, each diagnosis is addressed individually. Often, the diagnoses belong to the same system, category and code range, thus a single pair is chosen for the entry and compared to the preliminary set as before. If, however, diagnoses belong to the same category but to different code ranges, the code range corresponding to the entire category is selected rather than that of a single diagnosis. If the diagnoses belong to different categories, then a single category or code range cannot represent the entry and so an error code and error category are allocated instead. When a chief complaint is absent, the analysis of the health data proceeds in a similar fashion. The difference is that a preliminary code and category are not present and so no validation is necessary. The diagnosis was assessed, and when a diagnosis was absent, the medications administered were assessed. The algorithm to sequentially assess the information present per entry is demonstrated in Figure 1.
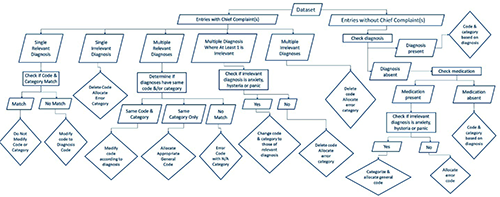
Code and category allocation algorithm.
Counts
After applying the appropriate formats and performing the code and category allocation, counts were performed for the various data categories present in the database. Of the 16,537 entries, 14,940 were found to have relevant codes and categories, 240 entries were marked for revision and 1357 belonged to error categories. However, all entries were allocated a disease category.
Several relative counts were performed and plotted to better visualize the data. Figure 2, which represents the disease category distribution by patient age and sex, shows that pulmonary diseases are the most common pathology encountered except in adult males where cardiac diseases are most common. Cardiac diseases are the second most common pathology, followed by cardiorespiratory diseases in general. These results are consistent with the general count performed for disease category and code (Tables 2 and 3).
Discussion
From the ED registers of the three participating hospitals 16,537 entries were gathered. The records had missing information to varying degrees which posed an initial challenge for proper code and category allocation. The sequential analysis of the available information with a similar framework to that of the ICD10 allowed for the creation of a code and category allocation protocol. Furthermore, inclusion of error values and missing data allowed the identification of issues that might have been encountered during the data collection process. By following the steps outlined in the algorithm, researchers can allocate categories and codes to health information obtained from paper records. This is particularly useful in settings where disease category and code allocation is not performed routinely or automatically.
Pulmonary diseases followed by cardiac diseases were the most encountered disorders in an ED between the years 2012 and 2014. Furthermore, the most prevalent age group was that of persons older than 75 years of age, accounting for 14.87% of the sample population. Pulmonary and cardiac diseases were more prevalent among males than females. Age group 2 which corresponds to ages 1 through 4, showed the highest prevalence of pulmonary diseases. The prevalence of cardiac diseases was found to progressively increase with age, which is well-established finding. Progressively, both cardiac and pulmonary disorders become more prevalent with age, with cardiac diseases more so among men than women. The significance of these trends, however, will be explored in future research.
Disease and error category counts.
Disease and error code counts.


Category distribution by age group and sex.
The potential weaknesses of this study chiefly stem from the integrity and completeness of the health records. The more incomplete the records, the less representative the code and category and the less reliable the allocation process becomes. Furthermore, the allocation was performed manually after entries were individually analyzed. The large sample size, however, serves to reduce bias and minimize the impact of errors. The algorithm should also be validated prior to being used for future research. The process of data cleaning was influenced by the general guidelines proposed by Van der Broeck et al. 31 Besides this, no guidelines or algorithms for cleaning and sorting health data has been described in the literature. However, various tools that use pattern recognition and machine learning have been devised to automatically allocate ICD codes and categories. 39 When compared to the electronic protocol described by Crammer et al., our protocol is particularly similar to theirs with regards to the sequence of data analysis. 40
Conclusion
Data handling is crucial in any research study. Few guidelines exist on how a database should be created and how the data should be handled prior to data analysis. Proper sorting of collected information increases the validity and reliability of the data and, subsequently, the data analysis. By describing the steps followed to generate a database from ED records, as well as the algorithm used to sort the collected data, we hope to contribute to the development of heath data sorting guidelines. Furthermore, given the increasing influence of air pollution on health, the rising popularity of big data research and the efficacy of big data research in public health and air pollution studies, proper care should be given to data handling and database creation to increase the validity and reliability of the data analysis, thus leading to better evidence-based public health policies concerning air pollution.