
Abstract
Background
One of modifiable risk factors of diabetes is unhealthy diet which is related to obesity. Individuals with childhood obesity are at higher risk of adulthood obesity. School-based diabetes prevention programs are important to reduce childhood obesity. When resources are limited, evidence-based priority need to be undertaken. However, data related to childhood obesity was not widely available, the study used diabetes-related death records as the proxy of diabetes burden. This study aimed to map and identify geographic variation of diabetes-related mortality rate by school district level in Michigan to be used for policy-relevant information.
Design and methods
This study used death records in Michigan. Diabetes-related mortality rate and years potential life lost (YPLL) was calculated at the school district level. Spatial autocorrelation local Moran's I and geographically weighted regression were used to evaluate spatial pattern of age-adjusted diabetes-related mortality rate by school districts.
Results
The age-adjusted diabetes-related mortality rate ranged from 17.0 (95% CI, 8.6-25.5) to 171.3 (95% CI, 135.9-206.7) deaths per 100,000 population. The YPLL per person ranged from 0 to 19.3 years (95% CI, 15.5-23.1). High rates of diabetes-related mortality rate and YPLL clustered in East central and Southeastern region of Lower Peninsula Michigan including Flint, Kearsley, Beecher, Westwood Heights, Detroit, Ecorse, River Rouge, Taylor, Allen Park and Lincoln Consolidated school districts.
Conclusions
There was variation in diabetes burden examined by diabetes-related mortality rate and YPLL at the school district level within Michigan State. The high cluster can be prioritized for the intervention programs.
Significance for public health
Children with obesity are at higher risk of having obesity during their adulthood. Because obesity is related to diabetes, having diabetes school-based prevention program that focused on reducing childhood obesity as well as diabetes is very beneficial. With limited resources, priority has to be made by the government based on diabetes burden in the area. To evaluate diabetes burden, the study used diabetes death records as the proxy because data related to diabetes risk factors among school children are not available at the school district level, and limited data of diabetes prevalence among youth at sub-county level. Our finding suggests the potential of using diabetes death record as the proxy to describe diabetes burden at the school district level. The results indicated the variation and clusters of diabetes in Michigan, which can be used for priority of the program. This approach also can be used in other public health program using available secondary data to provide policy-relevant information.
Introduction
Childhood obesity remains an important health problem in the U.S. According to the Centers for Disease Control and Prevention (CDC), the prevalence of children age 9-12 years old who were obese increased from 10.5% in 2001 to 14.8% in 2017. 1 Similarly, the prevalence of overweight children in the same age range also increased from 13.6% to 15.6% in 2001 to 2017. 1 Childhood obesity is associated with acquisition of other diseases in children such as asthma, early onset diabetes, and childhood hypertension. 2 The growing epidemic of overweight/obese children has led to a higher prevalence of adolescents being diagnosed with diabetes, particularly type 2 diabetes. 3 The overall unadjusted incidence rates of type 2 diabetes for children ages 10-19 years old increased from 9.0 cases per 100,000 youths per year in 2002-2003 to 12.5 cases per 100,000 youths per year in 2011-2012, representing an increase of 7.1% annually. 4 It seems possible that type 2 diabetes in children will likely be a predominant type of diabetes within the next 10 to 20 years surpassing type 1. 5 A study indicated that being overweight between ages 14 and 19 years is related to the increased mortality after age 30 years from systemic diseases including diabetes. 6 Therefore, it is important to decrease overweight and obesity trends in children in order to reduce the risk of them develop type 2 diabetes.
Schools provide opportunities for interventions to reduce the risk of diabetes because there is no other institution that has as much as interaction time with children. 7 In addition, schools can implement environmental modifications such as diet and physical activity changes, class curricula modification and the acceptability of healthy behaviors. 8 Many school-based interventions for diabetes risk reduction have been developed and implemented which involve children, parents, teachers and communities, and found to have positive outcome in reducing the risk of diabetes among school children.8-11
Due to limitations of resources in preventing diabetes, 12 prioritizing programs is important to ensure that they efficiently target interventions to those most in need. Understanding the geography of diabetes burden can support the spatial prioritization of the interventions. 13 To do this, a spatial analysis using GIS, a tool for analyzing and managing spatial data, 14 was conducted to map diabetes burden by school districts to determine targets for schoolbased diabetes prevention programs. Data related to diabetes risk factors among school children are not available at the school district level, 15 and limited data of diabetes prevalence, either among youth or adults, at sub-county level. 16 The study used diabetes death record to describe diabetes burden because data related to diabetes was not widely available at the school district level. Mortality statistics are an essential source of health information for evaluating the burden of diseases and are often used to assign priorities in health policy planning. 17
Additionally, previous studies showed that diabetes-related mortality rate demonstrates a spatial structure that it has spatial variation, pattern, and dependence. 18 This spatial structure in diabetes- related mortality rate may manifest in the form of spatial dependence due spatial interactions between ecological factors such as social, cultural, economic and political between populations in adjacent geographic areas. 18 The study of diabetes-related mortality rate using spatial analysis has been conducted at the county level, 19 but the differences have not been previously explored at the sub-county level and not for the geographic level of school district. Understanding the clusters of school district's diabetes- related mortality rate and YPLL is potentially beneficial in planning policy interventions and allocating resources for schoolbased diabetes prevention interventions. The purpose of the study was to demonstrate the utility of death records and GIS in identifying the variation of diabetes-related mortality rates by school district within the State of Michigan and to determine if clusters of high or low rate exist. This information could allow diabetes school-based prevention programs to better target populations.
Design and Methods
This study used a retrospective observational design to analyze death records from deaths due to diabetes in Michigan, by school district, from 2007 to 2014. The study was conducted in 2016-2018 and was approved by Western Michigan University Human Subject Institutional Research Board.
Study area
The study covered all school districts in the State of Michigan which include elementary and unified school districts. Unified school districts provide education to all school age children in their coverage areas, while the elementary school districts provide education for grade less than the full kindergarten through 12th or prekindergarten through 12th grade, for example, from K to 6th grade or pre-K to 8th grade. 20 Using the data from the U.S. Census TIGER/Line® Shapefiles of the American Community Survey (ACS) 5-year estimates for the year 2009-2013, there were 522 unified and 29 elementary school districts in Michigan. 21
Data sources
Deaths records were obtained for the years 2007-2014 through data sharing agreement between the Kalamazoo County Health and Community Services Department (KHCS), and the Health Data Research, Analysis and Mapping (HDReAM) Center at WMU. All death records with diabetes as cause of death either as underlying or associated causes were included in the study. According to WHO, underlying cause of death is defined as disease (s) or injury(s) that directly leads to death. 22 While associated cause of death is any disease(s) that may have contributed to the death but is not part of the main causal sequence. 23 In the ICD-10, diabetes was coded as E10 to E14. 24 To avoid duplication, any records mention both diabetes as the underlying and associated was considered as the underlying cause. By combining all causes of diabetes death, this study was able to capture the higher number of diabetes deaths than using the underlying cause only. As the focus of the study to examine diabetes burden by school district, the age-adjusted diabetes-related mortality rate, which is the combined, both underlying and associated cause, was used in the study.
School district map boundaries were retrieved from the U.S. Census TIGER/Line® Shapefile 21 and the Michigan Center for Geographic Information website. 25 The U.S. Census Bureau provides the attribute dataset for unified and elementary school district separately. Both shapefiles were merged to be able to present them in one map for the entire school districts in Michigan. There was a total of 551 school districts in Michigan; 61 school districts in the Upper Peninsula and 490 school districts in the Lower Peninsula. 25
Data of population demographics were collected to calculate age-adjusted mortality rate and YPLL. Although, the study used the death records from 2007 to 2014, the population demographics estimates from the American Community Survey (ACS) 2009-2013 was used for the entire period of study to avoid the instability of the study results. The population demographics estimates were obtained online from the (ACS) conducted by the U.S. Census Bureau and retrieved from U.S. Census TIGER/Line® Shapefiles 21 and the American FactFinder website. 26 In order to calculate the age-adjusted mortality rate, the number population was calculated using 10-year age categories (with exceptions of groups for less than 5 years old, and 85 years and older) of each school district in Michigan.
Address matching
All records with diabetes-related deaths from 2007-2014 were address matched in ArcGIS® version 10.3.1. 27 All analysis was conducted in the encrypted password-protected server to ensure the confidentiality as approved in the data sharing agreement between the KHCS Department and HDReAM at WMU. The 2007-2014 death records contain a total of 68,960 diabetes-related deaths. The initial address matching found that 51,743 (75.1%) records matched and 17,271 (25.9%) were unmatched. The unmatched addresses were reviewed, corrected if possible, and rematched manually, leading to an additional of 6,466 matched addresses. It made the total of 58,209 matched addresses (84.4%). During the re-matching process, various errors were found such as, misspellings of road names, abbreviated road names, and spacing between words or numbers. The resulting matched point features were then spatially joined to school district boundaries. Following the CDC guidelines, any school district that has less than 10 deaths was excluded from the analysis to ensure the confidentiality. 28 After the spatial joint to school district data layer, there were 56 school districts that had less than 10 deaths related to diabetes from 2007 to 2014. Thus, these school districts were excluded from the analysis, resulting in 495 school districts with 58,072 records for final analysis.
Spatial and statistical analyses
Age-adjusted rates were used to control for the effect of age distribution variations in the study period and among school districts. Mortality rates were directly standardized using the references of the U.S. population age distribution in the 2000 demographic census per CDC recommendation.28,29 The average of ageadjusted mortality rate was analyzed for each school district for the eight years of study period and presented as deaths per 100,000 population. Age-adjusted mortality rate was also calculated separately for diabetes as underlying cause, associated cause and combined. The years potential life lost (YPLL) measure is used to estimate premature death due to diabetes. YPLL was calculated as the sum of the differences between a predetermined standard age which was 75 years old (per CDC recommendation) and the ages of death for those who died before 75 years old. 29 YPLL can be presented as total YPLL, rate of YPLL per 100,000 population or average YPLL per person. 30 In this study, the average YPLL per person was presented to provide information about how prematurely individuals died. The greater the average number of YPLL per person, the younger the age at which the average person died. Both mortality rate and YPLL were processed and analyzed by SPSS v. 22 and Microsoft Excel 2013.
Additionally, choropleth maps of mortality rate and YPLL were created at the school district level. Study maps were created using ArcGIS® version 10.3.1. A shapefile for the state of Michigan containing school district was retrieved from the Michigan Center for Geographic Information website. 25 The state map layer was then joined to the school district attribute dataset using Federal the five-digit Federal Information Processing Standard (FIPS) number for school district which is unique for each school district within a state.
To find out whether mortality rate and YPLL at nearer school districts are more related than the rate at school districts that are farther apart, we evaluated spatial autocorrelation using Local Moran's I statistic. First order queen contiguity weights were used for all spatial analyses. The queen contiguity weights define neighbors as school district areas that share a boundary or a corner. 31 The p value and z-score were obtained using the 999 permutation. The analysis was conducted using Geoda. 32
Results
Demographics
Of the total included records (58,072), 32.2% (n=18,693) of deaths had diabetes as an underlying cause and the rest (67.8%) had it as an associated cause. The frequencies of diabetes as an associated cause appeared in part II of death certificates were 67.3%, 68.4%, 68.8%, 67.8%, 68.3%, 68.1%, 67.6% and 66% in 2007 to 2014, respectively. The proportion between male (51.4%) and female (48.8%) were nearly similar. The overall mean age at death was 74.1 years. Most of the study population was white (80.5%).
Age-adjusted diabetes mortality rate and YPLL
The map displayed in Figure 1 of age-adjusted rate for diabetes- related mortality rates demonstrate some variations of mortality rates by school district across the state. The age-adjusted diabetes- related mortality rate ranged from 17.03 (95% Confidence Interval [CI], 8.6, 25.5) deaths per 100,000 population in Glen Lake Community Schools to 171.3 (95% CI, 135.9, 206.7) deaths per 100,000 population in Westwood Heights Schools. Figure 1 shows that 123 school districts were in the highest state quartile with the rate above 80.26 deaths per 100,000 population. Figure 2 shows average YPLL per person among individuals who died of cause related to diabetes by school district. The average YPLL per person ranged from 0 in Sutton Bay Public Schools to 19.3 years (95% CI, 15.5, 23.1) in Muskegon Heights School District. The result shows that only one school district had zero year of YPLL indicating that no individuals died before the age of 75 years old in that school district area due to diabetes. Twenty-five percent of the school districts had the YPLL level above 12.8 years.

Age-adjusted mortality rate of diabetes as combined associated and underlying cause of death by school district, 2007-2014, in Michigan.

Years of potential life lost per person of diabetes-related death by school district, 2007-2014, in Michigan.
Spatial autocorrelation
Local Moran's I index was applied at the school district level to identify local clusters or spatial outliers of diabetes-related mortality rate within the State of Michigan. The result shows that Moran's I statistic was 0.33 with a p-value of 0.001 and z-score of 11.9 (Figure 3A). Moran's I above 0 indicates that the observed pattern was clustered and it was significant, meaning that the mortality rates were not randomly distributed. That is, the mortality rate in school districts was more similar among school districts that were geographically close together than those farther apart, with high school districts where mortality rates were high being generally nearby school districts with similar high rates and school districts with low rates being generally nearby school districts with rates that were similarly low.
The spatial outliers are the opposite pattern that high school districts where mortality rates were high surrounding with school districts with low mortality rates and vice versa. Figure 4A provides a better visual analysis of the specific pockets across the state where school districts and their neighbors had rates of diabetesrelated death that were similarly high or low. The high-high clusters were found in the East and West Central, Southwestern and Southeastern part of Lower Peninsula as well as some parts in the east, mid and west of Upper Peninsula.
For the YPLL, the Moran's I statistic was 0.21 with a p-value of 0.001 and z-score of 7.43 (Figure 3B). It indicates that the YPLL was also clustered. The high-high cluster areas are mostly in the East central and Southeastern part of Lower Peninsula (Figure 4B). Visual analysis of the maps in Figure 4 indicates that school districts in the East central region such as Flint, Kearsley, Beecher and Westwood Heights as well as school districts in the Southeastern region such as Detroit, Ecorse, River Rouge, Taylor, Allen Park and Lincoln Consolidated were all in the high-high cluster for both diabetes-related mortality rate and YPLL (marked with black circle on the maps). When we examine diabetes-related mortality rate against YPLL for these 10 school districts, the result shows that all school districts were in the highest quartile for both mortality rate and YPLL except for Allen Park, Kearsley and Taylor school districts.
Discussion
One objective of the paper was to examine the spatial pattern to the distribution of diabetes-related death rate and YPLL by school district. The study findings indicate that there were variations of diabetes-related mortality rate as the combined of underlying and associated cause of death. By combining both diabetes cause of death, we would not underestimate the burden of diabetes in a community compared to only examine diabetes as the underlying cause of death.33,34 Besides the mortality rate, we also analyzed YPLL per person to describe the premature death due to diabetes. Examining the two measures, the study was able to show the burden of diabetes both from the number of death and how early people die due to diabetes. The result indicates geographic variations in premature death due to diabetes by school districts within the state of Michigan. The study also shows that diabetes-related mortality rate and YPLL in Michigan school districts are spatially correlated and identified clusters of school districts where diabetes- related mortality rate is high or low. Geographically, all hotspots for both diabetes-related mortality rate and YPLL were found in the lower peninsula.
The second purpose of this paper presented the utility of deaths records and GIS to identify the school district with high burden of diabetes to be prioritized for targeted school-based diabetes prevention interventions. The study identified hotspots school districts were located in the East central and Southeastern part of Lower Peninsula of Michigan where high mortality rate and YPLL are clustered including Flint, Kearsley, Beecher, Westwood Heights, Detroit, Ecorse, River Rouge, Taylor, Allen Park and Lincoln Consolidated school districts. To target school-based diabetes prevention interventions, those seven school districts in the highest quintile may be prioritized for the interventions, followed by the remaining three school districts which were in the second highest quartile. Identifying the regional clustering of diabetes-related mortality rate and YPLL are important and in this study the information can be used to make priority in planning diabetes schoolbased prevention programs. Understanding the geography of diabetes burden using mapping technology can support the spatial prioritization of intervention or health care access. 13 Analyzing data at the subcounty level, especially school district like in this study, has implications for intervention and public health policy at the local level.
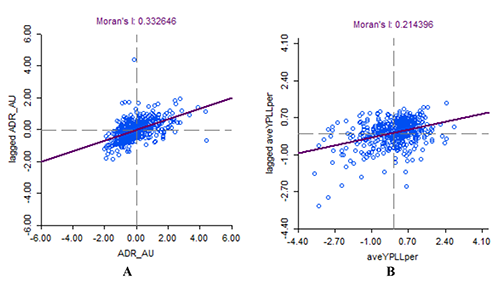
Scatter plot Moran's I statistic. A) Age-adjusted diabetes- related mortality rate. B) Years of potential life lost per person.

The cluster map of Moran's I statistic. A) Age-adjusted diabetes-related mortality rate. B) Years of potential life lost per person.
Strengths and limitations
This study has several limitations. First, the migration of people in or out of school district was not accounted for in this study. Second, there were school districts with small death counts that were excluded from the analysis for privacy purposes. Third, the effect of under reporting of diabetes as cause of death is also another limitation. Lastly, the study did not analyze the relationship between diabetes death and YPLL with school district social determinant and health care access, which can be recommended for a follow-up study. Despite the inherent limitation of the ecological study, the results from this study have strengths. First, the study was able to map diabetes-related mortality rate at the sub-county level especially at the school district level which to the author's knowledge has not been used for diabetes deaths. Second, the study also shows the clusters of diabetes mortality rate by school district in the State of Michigan. The clusters may be helpful in health resource allocation and management, and local governments could target resources to areas identified as high diabetes mortality rate clusters. Using the school district as the geographic analysis is very useful to inform local government for public health planning and implementation. Finally, the method used in this study can be duplicated for other health problems at the school district level.
Conclusions
This study showed that there was variation in diabetes burden examined by diabetes-related mortality rate and YPLL at the school district level within Michigan State. Further, the variation of the mortality rates and YPLL is not geographically random but is systematically high or low in many school districts in Michigan. The study was able to identify high clusters of mortality rate and YPLL that can be used to inform local officials in targeting diabetes school-based prevention programs.
Footnotes
Acknowledgments
The authors would like to thank Kalamazoo Health and Community Services (KHCS) and Center for Health Data Research Analysis and Mapping (HDReAM) at the Western Michigan University for providing access to the records used in this study.
![]() ). The mortality datasets that support the findings of this study are available from the collaboration between Kalamazoo Health and Community Services (KHCS) Department and Center for Health Data Research Analysis and Mapping (HDReAM) Western Michigan University, but restrictions apply to the availability of these data, which were used under license for the current study, and so are not publicly available.
). The mortality datasets that support the findings of this study are available from the collaboration between Kalamazoo Health and Community Services (KHCS) Department and Center for Health Data Research Analysis and Mapping (HDReAM) Western Michigan University, but restrictions apply to the availability of these data, which were used under license for the current study, and so are not publicly available.