
Abstract
Background
This ecological study examines the relationship between food desert prevalence and academic achievement at the school district level.
Design and methods
Sample included 232 suburban and urban school districts in New York State. Multiple open-source databases were merged to obtain: 4th grade science, English and math scores, school district demographic composition (NYS Report Card), regional socioeconomic indicators (American Community Survey), school district quality (US Common Core of Data), and food desert data (USDA Food Desert Atlas). Multiple regression models assessed the percentage of variation in achievement scores explained by food desert variables, after controlling for additional predictors.
Results
The proportion of individuals living in food deserts significantly explained 4th grade achievement scores, after accounting for additional predictors. School districts with higher proportions of individuals living in food desert regions demonstrated lower 4th grade achievement across science, English and math.
Conclusions
Food deserts appear to be related to academic achievement at the school district level among urban and suburban regions. Further research is needed to better understand how food access is associated with academic achievement at the individual level.
Significance for public health
The prevalence of food deserts in the United States is of national concern. As poor nutrition in United States children continues to spark debate, food deserts are being evaluated as potential sources of low fruit and vegetable intake and high obesity rates. Cognitive development and IQ have been linked to nutrition patterns, suggesting that children in food desert regions may have a disadvantage academically. This research evaluates if an ecological relationship between food desert prevalence and academic achievement at the school district level can be demonstrated. Results suggest that food desert prevalence may relate to poor academic performance at the school district level. Significant variation in academic achievement among urban and suburban school districts is explained by food desert prevalence, above additional predictors. This research lays the groundwork for future studies at the individual level, with possible implications for community interventions in school districts containing food desert regions.
Introduction
Many Americans have never seen amber waves of grain, as access to America's plenty is less than adequate. Multiple studies have demonstrated that poor nutrition throughout life coexists with stunted cognitive development, obesity and poor social skills.1-3 Although specific nutrients have not been found to impact IQ or achievement, children who have better overall diet quality demonstrate higher achievement scores and better cognitive functioning.2-9 More important to the case of nutritional deprivation over time, children in households that suffer from food insecurity demonstrate lower achievement scores than their peers. 10 Longitudinal analysis of toddlers has demonstrated an association of nutritional intake patterns on later cognitive IQ testing at 8 years old. 11 Increased consumption of processed foods in childhood has also been shown to negatively impact IQ scores later in life. 12 One method of targeting individuals with insufficient food access is through identification of food deserts. A food desert region has traditionally been defined by using distances to a supermarket. 13 The supermarket is used because it provides healthy food options at prices that are accessible to the general population. Various scientific methods are used to assess and operationally define food desert regions. Some typical examples are: economic analyses of regional food supply and demand, road network distances to fast food restaurants and supermarkets, geographic density of supermarkets, as well as disparities in prices of healthy foods.14-17 The USDA uses a geographic definition, categorizing food deserts as regions greater than one mile from a supermarket in urban and suburban areas, and greater than ten miles in rural regions. A supermarket is defined as a business that sells each major food group and has annual sales of at least two million. 12 This paper follows the definition of food deserts set down by the USDA. 13 The USDA reports that 23.5 million low-income Americans live more than one mile from a supermarket. 13 Food deserts are characterized by increased amounts of processed foods, less variety in food choice and poor nutrient intake among individuals who live there.1,18,19 Persons living within a food desert area, who are of low income, or do not have access to a vehicle, are at an even greater risk for poor nutrition.2,20 Studies of student dietary patterns have shown that students in areas with a higher number of unhealthy food establishments scored worse on dietary measures. 16 A study of rural Pennsylvania demonstrated that the percentage of overweight students within a school district was related to the percentage of the school district population that lived in a food desert region, after controlling for socioeconomic status. 20
The direct relationship of food deserts on academic achievement has not yet been studied. If poor nutrition negatively impacts student achievement scores, then children living within a food desert area are at a distinct disadvantage academically. The purpose of this study is to determine if the proportion of individuals living within a food desert area negatively relates to achievement scores in school districts, after accounting for additional predictors.
Design and methods
Study design
All research and analysis was carried out in February of 2014. Four large-scale databases were connected at the school district level in the state of New York, each containing important covariates of academic achievement. Dependent variables were average 4th grade science, English and math scores from urban and suburban school districts during the 2010-2011 school year. Analysis could not be conducted at the school level because of the difficulty determining where students live relative to their school. Study design was similar to other studies using school district level data and ArcGIS.20,21 New York City school districts were excluded, in accordance with previous research on New York State school districts.22-25
Rural school districts were not included in analysis for two reasons. First, issues concerning food access in rural areas are much different than in urban or suburban regions. 26 Public transportation in urban and suburban regions, for example, is often utilized when vehicle access is unavailable. Furthermore, issues of access to nutritious foods can be hampered through zoning and costs of transportation in ways that rural areas are not affected. 27 Second, the spatial aggregation process in ArcGIS did not allow for the inclusion of rural school districts. Because census tract boundaries are based on regional population size, rural census tracts cover a larger geographic area than urban and suburban census tracts. Thus, census tract polygons do not fit neatly inside rural school district boundaries. Future studies should utilize a different classification and aggregation process to study rural regions.
Databases
New York State Report Card
This dataset contains demographic and achievement data for each school district in New York State. Primary dependent variables used in regression analysis were academic achievement scores for 4th grade science, English and math at the school district level. Sampling weights were not necessary as the New York State Report Card uses census based data collection. 28 Additional covariates of academic achievement obtained from this dataset included: percent Hispanic, percent Black, percent free lunch and percent reduced lunch. 29 Alongside socioeconomic indicators, ethnic composition of school districts is included in the analysis to account for additional variance in achievement explained by ethnicity.30,31
Common core of data: United States Department of Education
The Common Core of Data from the United States Department of Education classifies school districts into rural, urban and suburban areas. 32 This study only included suburban and urban school districts as classified by the Department of Education. NYS Common Core of Data also includes school district quality indicators. School district quality variables were added as covariates of academic achievement in analyses. 33 These covariates included: total school district enrollment, 34 proportion of students per teacher, 35 expenditures per student, 36 and classification of urban, large suburban and small suburban. 37
American Community Survey
The American Community Survey 38 and American Census data were used to define, characterize and locate school districts and census tracts throughout New York State. This dataset also includes the proportion of individuals with a bachelor's degree or above, within each school district area.39,40 This measurement of community educational attainment was applied to the regression model as a further covariate of school district academic achievement. The American Community Survey also contains the total number of individuals living within each census tract. Population totals were used to calculate proportions used for standardization purposes. Estimates provided for each census tract were aggregated to the school district level using ArcGIS.
USDA Food Access Research Atlas
Food deserts were identified geographically using USDA Food Access Research Atlas. 41 The Food Access Research Atlas contains information on food deserts throughout the United States. The food desert variables of interest included i) the number of individuals who live more than one mile from a supermarket within each census tract, ii) the total number of individuals at low access who are also of low income, and iii) the total number of households at low access, without access to a vehicle. Low income was defined as persons with an annual income below or equal to 200 percent of the federal poverty line. 13
Each food desert variable was aggregated from the census tract level to the school district level using ArcGIS. The food desert variables were normalized by dividing the total number of individuals at low access by the total population size for the school district. Final food desert variables used in analyses included i) the proportion of individuals at low access within a school district (LA), ii) the proportion of individuals at low access and of low income within a school district (LALO), iii) and the proportion of households at low access without a vehicle (LAVEH).
Analysis
Spatial analysis and aggregation using ArcGIS
New York State school districts and census tracts from 2010 were spatially joined using ArcGIS. Shape files were obtained from the United States Census Tiger files. 30 A join function was used to aggregate each census tract whose geometric centroid fell within the school district polygon. Data associated with census tracts whose geometric centre fell within the boundaries of the school district were summed to obtain total scores for each school district. For example, total population size, total individuals with a bachelor's degree, and total number of individuals living at low access were aggregated from census tracts that lay within the school district geographic boundaries to obtain a school district total. For a visual example of this process please see Figure 1. After the aggregation in ArcGIS, the database was exported and merged with school district achievement data.

Food desert prevalence by census tract in two city school districts.
Statistical analysis
All analysis was performed with SPSS 21. School districts with missing data were eliminated, resulting in 4 school districts being removed from the analysis. The final sample of 232 school districts contained 22 urban school districts, 190 large suburban school districts and 20 small suburban school districts. It was hypothesized that the proportion of individuals living within a food desert has a significant negative relationship with academic achievement, after controlling for school quality and socioeconomic indicators.
Means for each community type (urban, suburban large and suburban small) are reported in Table 1. Correlations between predictor variables are assessed, with special attention paid to correlations with food desert variables (Table 2). Regression analysis was used to assess significant changes in explained variation in academic achievement as predicted by food desert variables. Hierarchical regression analysis was performed in the following order: First, each achievement score (science, English and math) was regressed in unadjusted models using each food desert variable LA, LALO and LAVEH as individual predictors.
Means and standard deviations of variables by school district type in New York State.
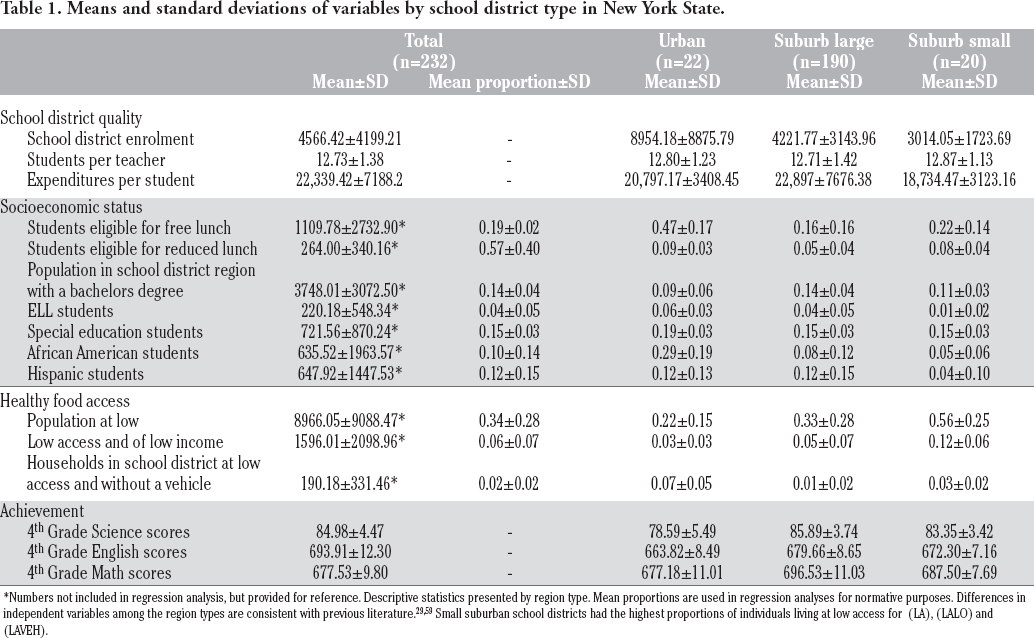
Numbers not included in regression analysis, but provided for reference. Descriptive statistics presented by region type. Mean proportions are used in regression analyses for normative purposes. Differences in independent variables among the region types are consistent with previous literature.29,59 Small suburban school districts had the highest proportions of individuals living at low access for (LA), (LALO) and (LAVEH).
Correlation coefficients between independent variables and academic achievement/food access variables.
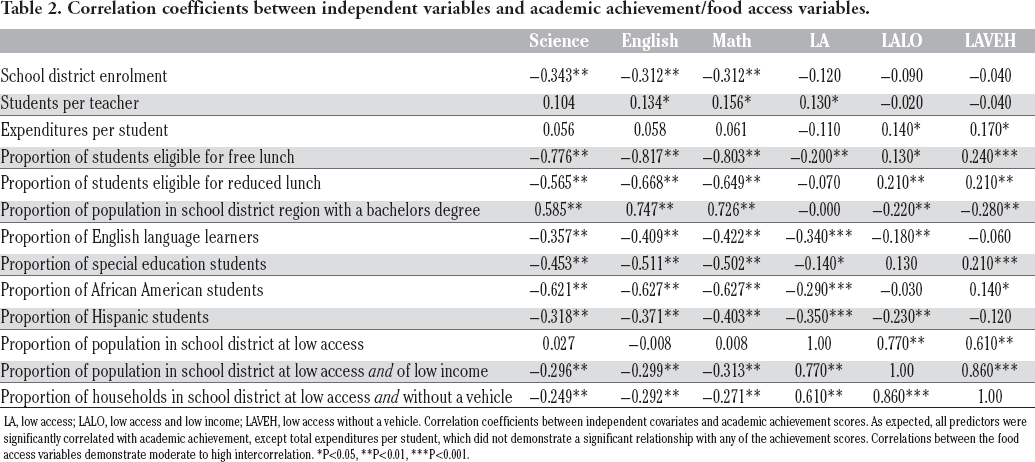
LA, low access; LALO, low access and low income; LAVEH, low access without a vehicle. Correlation coefficients between independent covariates and academic achievement scores. As expected, all predictors were significantly correlated with academic achievement, except total expenditures per student, which did not demonstrate a significant relationship with any of the achievement scores. Correlations between the food access variables demonstrate moderate to high intercorrelation.
P<0.05,
P<0.01,
P<0.001.
These models describe the effect of each food desert variable on each achievement test without any predictors. Thus, each achievement score has three unadjusted models. Second, covariates were added to the unadjusted models, with the food desert variable added as a final predictor. These adjusted models explain the relationship of each food desert variable on academic achievement, after controlling for additional predictors. Thus, each achievement score has three adjusted modes. An explanation of the models is presented below:
Regression analysis
Y1 = 4th Grade Science Scores; Y2 = 4th Grade English Scores; Y3 = 4th Grade Math Scores
Unadjusted models
Yi = α + β1[LA] + e
Yi = α + β1[LALO] + e
Yi = α + β1[LAVEH] + e
Adjusted hierarchical regression models
Yi = α + β1(×1) + β2(×2) + β3(×3) + β4(×4) + β5(×5) + β6(×6) + β7(×7) + β8(×8) + β9(×9) + β10(×10) + β11(×11) + β12(×12) + e
×1 = School District Enrolment
×2 = Total Expenditures per Student
×3 = Total Students per Teacher
×4 = Proportion of Students Eligible for Free Lunch
×5 = Proportion of Students Eligible for Reduced Lunch
×6 = Proportion of Population in School District Region with a Bachelors Degree
×7 = Categories of Urban, Large Suburb and Small Suburb
×8 = Proportion of English Language Learners (ELL)
×9 = Proportion of Special Education Students
×10 = Proportion of African American Students
×11 = Proportion of Hispanic Students
×12 = Proportion of Population in School District at Low Access [LA]
(2) Yi = α + β1(×1) + β2(×2) + β3(×3) + β4(×4) + β5(×5) + β6(×6) + β7(×7) + β8(×8) + β9(×9) + β10 (×10) + β11(×11) + β12(×12) + e
×1 = School District Enrollment
×2 = Total Expenditures per Student
×3 = Total Students per Teacher
×4 = Proportion of Students Eligible for Free Lunch
×5 = Proportion of Students Eligible for Reduced Lunch
×6 = Proportion of Population in School District Region with a Bachelors Degree or Higher
×7 = Categories of Urban, Large Suburb and Small Suburb
×8 = Proportion of English Language Learners (ELL)
×9 = Proportion of Special Education Students
×10 = Proportion of African American Students
×11 = Proportion of Hispanic Students
×12 = Proportion of Population in School District at Low Access and of Low Income [LALO]
(3) Yi = α + β1(×1) + β2(×2) + β3(×3) + β4(×4) + β5(×5) + β6(×6) + β7(×7) + β8(×8) + β9(×9) + β10 β10) + β11(×11) + β12(×12) + e
×1 = School District Enrollment
×2 = Total Expenditures per Student
×3 = Total Students per Teacher
×4 = Proportion of Students Eligible for Free Lunch
×5 = Proportion of Students Eligible for Reduced Lunch
×6 = Proportion of Population in School District Region with a Bachelors Degree or Higher
×7 = Categories of Urban, Large Suburb and Small Suburb
×8 = Proportion of English Language Learners (ELL)
×9 = Proportion of Special Education Students
×10= Proportion of African American Students
×11 = Proportion of Hispanic Students
×12 = Proportion of Households in School District at Low Access and Without a Vehicle [LAVEH]
Results
Descriptive statistics can be found in Table 1. Urban school districts had the highest average enrolment (8954) and the largest proportion of students eligible for free lunch (47%). Minority groups were most prevalent in urban school districts: African American (29%), Hispanic (12%), and English language learners (ELL) (6%). Large suburban school districts had the highest average expenditures per student ($ 22,897.470), and the smallest proportion of students eligible for free lunch (16%). Small suburban school districts had the smallest number of minority students: [African American (5%), Hispanic (4%) and ELL (1%)], and the lowest average enrolment (3014.05). Small suburban school districts had the highest proportion of individuals at low access (56%), followed by large suburban school districts (33%) and urban school districts (22%). Achievement test scores ranged from (69-94) for science, (648-701) for English and (658-724) for math, overall. Urban school districts had the lowest achievement scores across science, English and math, while large suburban school districts scored highest across all achievement scores.
In order to understand the relationship between low access and other independent variables, correlations are presented in Table 2. The proportion of individuals at LA was negatively correlated with the proportion of students eligible for free lunch (r=–0.200, P<0.01), the proportion of African American students (r=–0.290, P<0.001) and the proportion of Hispanic students (r=–0.350, P<0.001). Correlations between LA and achievement scores indicated no significant correlation between the percentage of people living at low access and academic achievement. However, there were significant negative correlations between achievement scores and the percentage of people that are at low access and are of low income LALO: (Science r=–0.313, P<0.001), (English r=–0.299, P<0.001), (Math r=–0.296, P<0.001). There was also a significant negative correlation between achievement scores and the percentage of households that do not have access to a vehicle (LAVEH): (Science r=–0.271 P<.001), (English r=–0.292, P<0.001), (Math r=–0.249, P<0.001).
Science
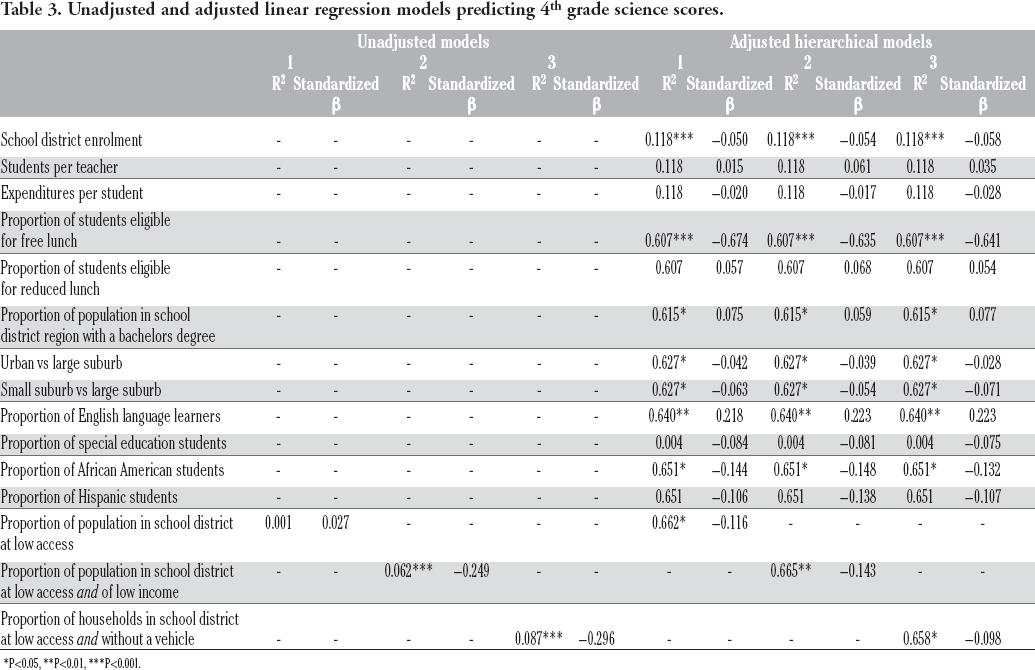
The first model set (Table 3) predicted science achievement scores using unadjusted regression models with each food desert variable as the independent variable. The proportion of individuals at low access (LA) did not significantly predict variation in science achievement scores. However, science scores were significantly explained by the proportion of individuals at low access and low income (LALO) (F1,230=15.155, β=–0.249, ΔR2=0.062, P<0.001) and the proportion of households at low access and without a vehicle (LAVEH) (F1,230=22.026, β=–0.296, ΔR2=0.087, P<0.001).
Unadjusted and adjusted linear regression models predicting 4th grade science scores.
P<0.05,
P<0.01,
P<0.001.
Adjusted models predicting science achievement added covariates to the unadjusted models, with a food desert variable as the final predictor. Results demonstrated that the proportion of individuals at low access to healthy foods within a school district (LA) was predictive of 4th grade science scores after controlling for additional predictors (F1,218=6.714, β=–0.116, ΔR2=0.011, P<0.01). Thus, one standard deviation increase in LA was associated with a 0.116 standard deviation decrease in average science scores. Individuals living at low access and of low income (LALO) also significantly explained variation in science scores (F1,218=8.760, β=–0.143, ΔR2=0.013, P<0.01). Lastly, the proportion of households at low access and without vehicle access (LAVEH) predicted science achievement (F1,218=4.529, β=–0.098, ΔR2=0.007, P<0.05).
English
The second model set (Table 4) predicts English achievement scores. Once again, LA did not significantly predict variation in English achievement scores in the unadjusted model, whereas the proportion of individuals at low access and low income (LALO) did significantly predict variation in English scores (F1,218=21.426, β=–0.292, ΔR2=0.085, P<0.001). Also, the proportion of households at low access and without a vehicle (LAVEH) was significantly predictive English scores in the unadjusted model (F1,218=22.638, β=–0.299, ΔR2=0.090, P<0.001).
Unadjusted and adjusted linear regression models predicting 4th grade English scores.

P<0.05,
P<0.01,
P<0.001.
Adjusted models predicting English achievement added covariates to the unadjusted models, with the food desert variable added last. Results demonstrated that the proportion of individuals at low access to healthy foods within a school district (LA) was predictive of 4th grade English scores after controlling for additional predictors (F1,218=20.661, β=–0.158, ΔR2=0.019, P<0.001). One standard deviation increase in LA was associated with a 0.158 standard deviation decrease in English achievement. Significant additional variation in English achievement was also explained by adding the proportion of individuals living at low access and of low income (LALO) (F1,218=16.896, β=–0.156, ΔR2=0.016, P<0.001), and the proportion of households at low access and without vehicle access (LAVEH) (F1,218=5.871, β=–0.089, ΔR2=0.006, P<0.05).
Math
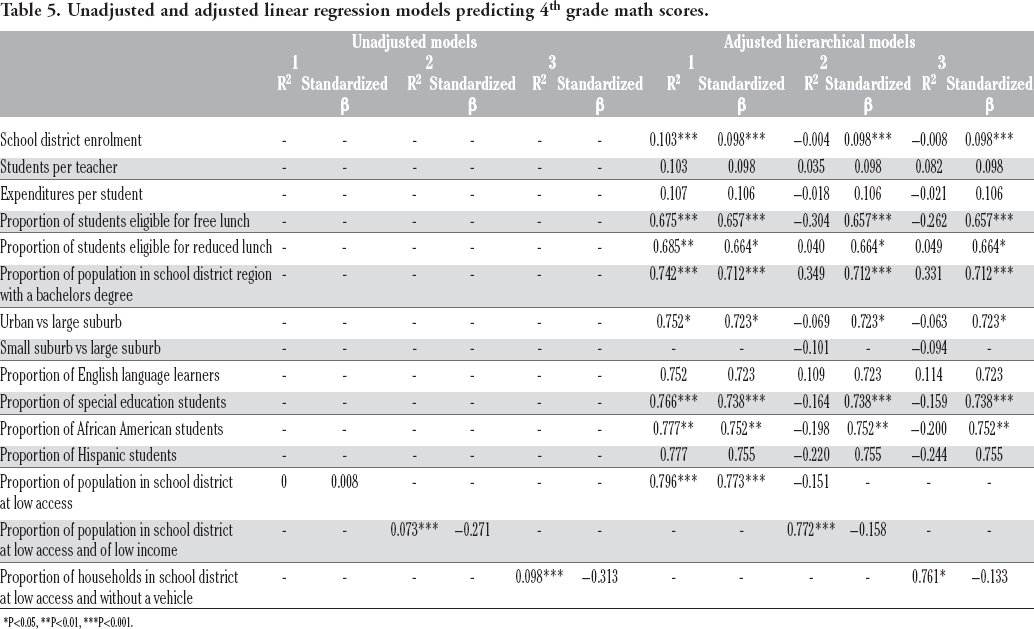
The third model set (Table 5) predicts Math achievement scores using unadjusted regression models including each food desert variable. Once again, LA did not significantly predict variation in Math achievement scores, while the proportion of individuals at low access and low income (LALO) (F1,218=18.178, β=0.271, ΔR2=0.073, P<0.001) and the proportion of households at low access and without a vehicle (LAVEH) (F1,230= 25.00, (3=0.313, ΔR2=0.098, P<0.001) did significantly explain variation in Math scores.
Unadjusted and adjusted linear regression models predicting 4th grade math scores.
P<0.05,
P<0.01,
P<0.001.
Adjusted models predicting math achievement added all covariates with the food desert variable added last. Results demonstrated, once again, that the proportion of individuals at low access to healthy foods within a school district (LA) was predictive of 4th grade math scores after controlling for additional predictors (F1,218=16.930, β=–0.151, ΔR2=0.018, P<0.001), with one standard deviation increase in (LA) being associated with .151 standard deviation decrease in average Math scores. Additional variation was also explained by the proportion of individuals living at low access and of low income (LALO) (F1218=15.824 β=–0.158, ΔR2=0.017, P<0.001), and the proportion of households at low access and without vehicle access (LAVEH) (F1,218=12.388 β=–0.133, ΔR2=0.013, P<0.001).
Discussion
This ecological study examines the relationship of food desert prevalence and 4th grade academic achievement at the school district level. Initial analyses of correlation between academic achievement and the proportion of people at low access (LA) were not significant. However, there were significant correlations for the proportion of people low access and low income (LALO) and the proportion of households at low access and without a vehicle (LAVEH). Unadjusted regression models reported similar results, with the proportion of individuals at low access (LA) not significantly predicting variation in any of the achievement scores. When covariates were added to the model, the proportion of individuals at low access (LA) did explain significant, additional variation across all achievement scores. As hypothesized, food desert measures (LA), (LALO) and (LAVEH) significantly explained academic achievement at the school district level after controlling for additional predictors of academic achievement. This relationship was negative, such that as the prevalence of individuals living at low access increased, academic achievement decreased.
Comparisons of the unadjusted and adjusted regression models demonstrate a moderating effect of socioeconomic indicators on the relationship between percentage of people at low access within a school district (LA) and academic achievement scores. Food desert prevalence is only associated with academic achievement when additional predictors of achievement are taken into account. Similar findings are found with (LALO) and (LAVEH) food desert variables, which maintain a negative relationship with academic achievement, even after controlling for covariates. Literature supports the claim that low access to healthy foods is not a phenomenon universally present in low socioeconomic regions, nor universally absent in high socioeconomic regions.42-44 Reported differences in the proportions of individuals at low access between urban, and suburban school districts are primarily a result of the operational definition of low access used in spatial analysis. Because suburbs have large amounts of sprawl (distance between houses or businesses) 45 it is understandable that a larger proportion of a suburban school district population would live more than one mile from a supermarket. This interpretation is further supported by the significant negative correlations between the proportions of individuals at low access (LA) and the proportion of students eligible for free lunch, African American students and Hispanic students, as these populations are less prevalent in suburban regions. The presence of a food desert in wealthy areas may not have any impact on the nutritional intake of the children residing within these areas. Assets including better health education, increased ability to spend more on high quality food and better transportation options may negate the influence of a food desert. 46 Specific kinds of disadvantage may not create poverty, but poverty is amplified when certain kinds of deprivation are present. Thus, it can be concluded that school districts containing a high prevalence of food deserts that also have a greater number of residents of low income or without vehicles may have lower academic achievement.
There are some limitations to this study. First, this is an ecological study at the school district level. Aggregated scores cannot be directly applied at the individual level, and further research is needed to assess the impact of food deserts on academic achievement. A hierarchical linear modelling analysis might aid in understanding the impact of food deserts on achievement at the individual, school and school district levels. Second, additional predictors of school quality, teacher quality and neighbourhood characteristics could have improved the regression models. This is especially true for science achievement scores, which demonstrated the lowest total explained variance (R2=0.662). Third, rural regions were not included in analyses. An additional study of rural regions would be very useful in understanding the relationship of food deserts and achievement in the rural context. Lastly, this study was cross-sectional in nature and therefore is unable to give any kind of causal inference of food desert prevalence on academic achievement. Longitudinal analysis using similar techniques would be able to ascertain if residing in a food desert region during childhood and adolescence negatively impacts cognitive functioning or achievement scores later in life. This study demonstrates the importance of healthy food access both at the school district level and within communities. The findings in this study are consistent with nutritional research demonstrating that general nutritional intake impacts cognitive functioning and academic achievement.47,48 Targeting low income and low access neighbourhoods for intervention-based programming may enhance educational achievement throughout the community. Intervention strategies range from macro-level changes to the environment to behavioural based education programs. 49 Some initiatives to fight food deserts focus on starting new supermarkets in food desert regions,50-52 or supplying local smaller-scale grocery stores. 53 Educational programs at the community level promote fresh produce from local farmers through food distribution and cooking classes. 54 School based interventions advocate for structural changes to class periods to allow more time for recess, 55 and changes to school lunch menus.56,57 Nutritional education textbooks have also been created to address behavioural intervention needs at the individual level for elementary students. 58
School districts will continue to underperform if community wide low access to healthy foods continues. Food advocacy is not merely an issue for nutritionists; it is a cause that school administrators, school district superintendents and teachers can all rally behind to help improve lives of students under their care.
Footnotes
Conflict of interests: the author declares no potential conflict of interests.
Acknowledgements
The author would acknowledge Dr. Seong Han and Dr. Jaekyung Lee for their academic advice and support.