
Abstract
Background
Methods
Results
Conclusions
Introduction
With expanded access to antiretroviral therapy (ART), increase in viral load (VL) monitoring and longer duration of ART exposure in people living with HIV (PLHIV), it is expected that first- and second-line treatment failure will subsequently increase due to the emergence of drug resistance and suboptimal ART adherence [1–3]. The mortality rate after second-line failure is high [4], which raises concerns regarding access and availability to third-line therapy.
The World Health Organization (WHO) estimates that less than 1% of PLHIV on ART are currently taking third-line regimen. It recommends that third-line regimens should include new drugs such as integrase inhibitors (raltegravir) or second-generation non-nucleotide reverse transcriptase inhibitors (NNRTIs) and protease inhibitors (PIs) such as darunavir and etravirine. If there are no new ART options, patients are recommended to continue with a tolerated regimen [5]. The cost of third-line regimens are higher than first- or second-line, limiting their availability in resource-limited countries [6,7].
At the time when the WHO began recommending PI combinations as treatment options for second-line therapy [8,9], the drug combination was not readily accessible in low-income settings due to the high cost of PIs. In the Asia-Pacific region, a previous study of the TREAT Asia HIV Observational Database (TAHOD) reported half of PLHIV enrolled in the cohort who had failed first-line ART remained on the failing regimen for the first year following treatment failure. Those from low income sites were less likely to switch soon after failure due to limited access to the newer PI-based second-line combination [10]. Once second-line ART became more widely available in Asia-Pacific, the high cost of switching to third-line ART became the next barrier in the long-term management of HIV. In Myanmar, where routine VL testing is not readily available, of the 824 PLHIV receiving second-line regimen, 6% had VL testing and 37% of those tested had VL failure. None of the PLHIV with VL failure were switched to third-line ART [11]. However, an Indian cohort study of PLHIV failing second-line ART found that 62% of those who had failed had been able to achieve undetectable VL after enhanced adherence support whilst remaining on second-line regimen, and therefore avoided the unnecessary switch to a more expensive third-line ART regimen [3].
As the number of PLHIV failing second-line ART is expected to increase, we aimed to investigate treatment modifications after second-line failure among PLHIV in Asia, and treatment outcomes among those who remained on the failing second-line regimen compared with those who had a treatment modification.
Methods
Study population
PLHIV enrolled in two Asia-Pacific adult HIV observational cohorts: (i) TAHOD, and (ii) TAHOD - Low Intensity Transfer (TAHOD-LITE), who failed second-line ART were included. We included TAHOD patients enrolled between 2003 to 2018, and TAHOD-LITE patients from the 2017 cohort. Cohort profiles have been described elsewhere [12,13], but briefly TAHOD enrolment began in 2003 and currently recruits PLHIV from 21 sites in 12 countries in Asia. TAHOD-LITE was initiated in 2014 and is a sub-study of TAHOD that collects more limited HIV clinical data on all patients at participating sites. The most recent TAHOD-LITE cohort (2017 cohort) included 10 of the 21 TAHOD sites.
Definitions
Second-line ART was defined as a change of two drugs or a drug class change from the initial first-line combination, within 6 months of first virological, immunological or clinical failure. Delayed ART switches after 6 months were excluded to avoid including switches due to other reasons such as adverse events. Treatment failures were defined according to WHO 2016 guidelines [5] and adapted to our cohort settings where VL is performed annually at most sites. Virological failure in this study was defined as a single measurement of VL ≥1,000 copies/ml after 6 months on ART. A secondary VL confirmation was not required to define VL failure as many of our sites do not perform repeat VL testing after the first evidence of VL ≥1,000 copies/ml. Immunological failure was defined as persistent (two consecutive measurements within 6 months) CD4 cell count <100 cells/μl after 6 months on ART. As our cohort collected Centre for Disease Control (CDC) disease grading rather than WHO staging, clinical failure in this study was defined as having a CDC grade C diagnosis after 6 months on ART. If multiple failure events occurred, the first failure event was used.
Second-line ART failure was defined as having a virological, immunological or clinical failure event after having been on second-line therapy for at least 6 months. Treatment modification after second-line failure was defined as a change of two drugs or a drug class change, including treatment interruption. Treatment modification of less than 14 days was not included. Those with treatment modification were further categorized according to their treatment interruption status in each analysis.
Statistical analyses
Factors associated with CD4 changes and undetectable VL at 1 year after second-line ART failure (within +6 months window period) were analysed using linear regression and logistic regression, respectively. CD4 change was defined as a difference between CD4 count at 1 year after second-line failure and the CD4 measurement taken at the time of second-line failure. Undetectable VL was defined as VL<1,000 copies/ml. PLHIV without CD4 or VL measurement at 1 year (±6 months) were not included in the CD4 or the VL analysis. Treatment modification variable was categorized as no, yes, without treatment interruption and at least 1 treatment interruption, within the first year after second-line failure. Other variables included were age at second-line ART failure, sex, mode of HIV exposure, VL and CD4 at time of second-line failure, ART duration, ART regimen at second-line failure, hepatitis B/C coinfection defined as positive hepatitis B surface antigen and positive hepatitis C antibody, respectively, prior AIDS diagnosis defined as a CDC grade C disease category, and World Bank country income level group [14].
Survival time from second-line failure was analysed using Fine and Gray's competing risk regression, with loss to follow-up (LTFU) included as a competing risk. Risk time for mortality began on the date of second-line failure and ended on the date of death or date of last follow-up. Time updated variables included were treatment modification, VL, CD4 and ART duration. Treatment modification was coded as a time-updated variable to account for variation in ART combinations, for example, a patient could have treatment interruption then resume with the same regimen taken at time of second-line failure. Other variables were analysed as time-fixed covariates. World Bank country income was adjusted as a priori to account for differences in third-line ART availability.
Regression models were fitted using backward stepwise procedures. Factors significant in univariate analyses with P<0.10 were included in the multivariate analyses. Factors with P<0.05 in the final multivariate model were considered statistically significant. The effects of other non-significant factors were presented adjusting for the significant predictors, however, they did not form part the final multivariate model. Ethics approvals were obtained from the local ethics committees of all participating sites, the data management and biostatistical centre (The Kirby Institute, UNSW Sydney) and the coordinating centre (TREAT Asia/amfAR). Data management and statistical analyses were performed using SAS software version 9.4 (SAS Institute Inc., Cary, NC, USA) and Stata software version 14.2 (Stata Corp., College Station, TX, USA).
Results
There were 328 patients from Cambodia, China, Hong Kong SAR, India, Indonesia, Japan, South Korea, Malaysia, the Philippines, Singapore, Taiwan, Thailand and Vietnam, who failed second-line ART according to our definition of treatment failure. There were 146 patients who had more than one type of failure resulting in 295 virological failures, 140 immunological failures and 57 clinical failures, from our cohort of 328 patients.
The median age at second-line failure was 39.5 years (interquartile range [IQR] 34-56), with 79% being male. The median CD4 cell count was 209 cells/μl (IQR 85-359) and the median VL was 12,917 copies/ml (IQR 3,040-81,900). Of the 328 patients, the median time on second-line ART was 1.19 years (IQR 0.72-2.62) and 208 (63%) had at least one treatment modification after second-line ART failure, including treatment interruption (Table 1).
Patient characteristics

ART, antiretroviral therapy; MSM, men who have sex with men; NNRTI, non-nucleoside reverse transcriptase inhibitor; NRTI, nucleoside reverse transcriptase inhibitor; PI, protease inhibitor.
Of the 208 patients who had a treatment modification, the initial ART combinations that these patients were modified to after second-line failure were: NRTI + PI (118/208, 57%), integrase inhibitor (INSTI)-based combination (any ART combination containing INSTI; 26/208, 13%), NRTI + NNRTI (12/208, 6%) and other ART combinations (15/208, 7%). There were 37/208 patients (18%) who had treatment interruption. INSTI-based combination comprised raltegravir (22 patients, 85%) and dolutegravir (4 patients, 15%).
Changes in CD4 cell count
There were 230 patients who had a CD4 measurement available 1 year after second-line ART failure, and were included in the analysis. The mean CD4 cell increase at 1 year was 56.5 cells/μl (95% CI 37, 76). Patients who did not have a treatment modification in the first year after second-line ART failure had a mean CD4 cell increase of 31.4 cells/μl (95% CI 8, 54). Those who had a treatment modification without treatment interruption had a mean CD4 cell increase of 111.6 (95% CI 77, 147), while those who had at least one treatment interruption in the first year had an average increase of 41.1 cells/μl (95% CI -40, 122). The univariate analysis in Table 2 shows that factors associated with CD4 cell increase were treatment modification (P=0.001) and CD4 count at second-line failure (P=0.004). The multivariate analysis indicates those who had a treatment modification without interruption had a higher increase in CD4 count at 1 year after second-line failure compared with those who did not have a treatment modification (difference =77.5, 95% CI 35.3, 119.7; P<0.001), while no differences were observed among those who had at least one treatment interruption (difference =-5.3, 95% CI -67.3, 56.8; P=0.867). Those who had a CD4 cell count >500 cells/μl at time of second-line failure had a significant reduction in CD4 count at 1 year compared with those who failed at CD4 ≤200 cells/μl (difference =-121.4, 95% CI -196.2, -46.6; P=0.002). Country income was not associated with changes in CD4 cell count (P=0.060) but was adjusted in the multivariate analysis.
Factors associated with CD4 changes at 1 year after second-line ART failure

P-values in bold represent significant covariates in the final model. Other non-significant factors were presented adjusting for the significant predictors; however, they did not form part of the final multivariate model. Global P-values are test for heterogeneity excluding missing values. World Bank country income was adjusted a priori. ART, antiretroviral therapy; MSM, men who have sex with men; NNRTI, non-nucleoside reverse transcriptase inhibitor; NRTI, nucleoside reverse transcriptase inhibitor; PI, protease inhibitor.
Undetectable VL
Of the 189 patients who had a VL measurement, 115 (61%) were undetectable at 1 year after second-line ART failure (Table 3). There were 118/189 patients (62%) who did not have treatment modification in the first year after second-line ART failure, of which 71 (60%) had undetectable VL. Of the 53 patients who had treatment modification without treatment interruption, 40 (75%) achieved VL suppression. The proportion with undetectable VL was lowest for the group who had interrupted treatment at least once, 4/18 (22%).
Factors associated with undetectable viral load at 1 year after second-line ART failure
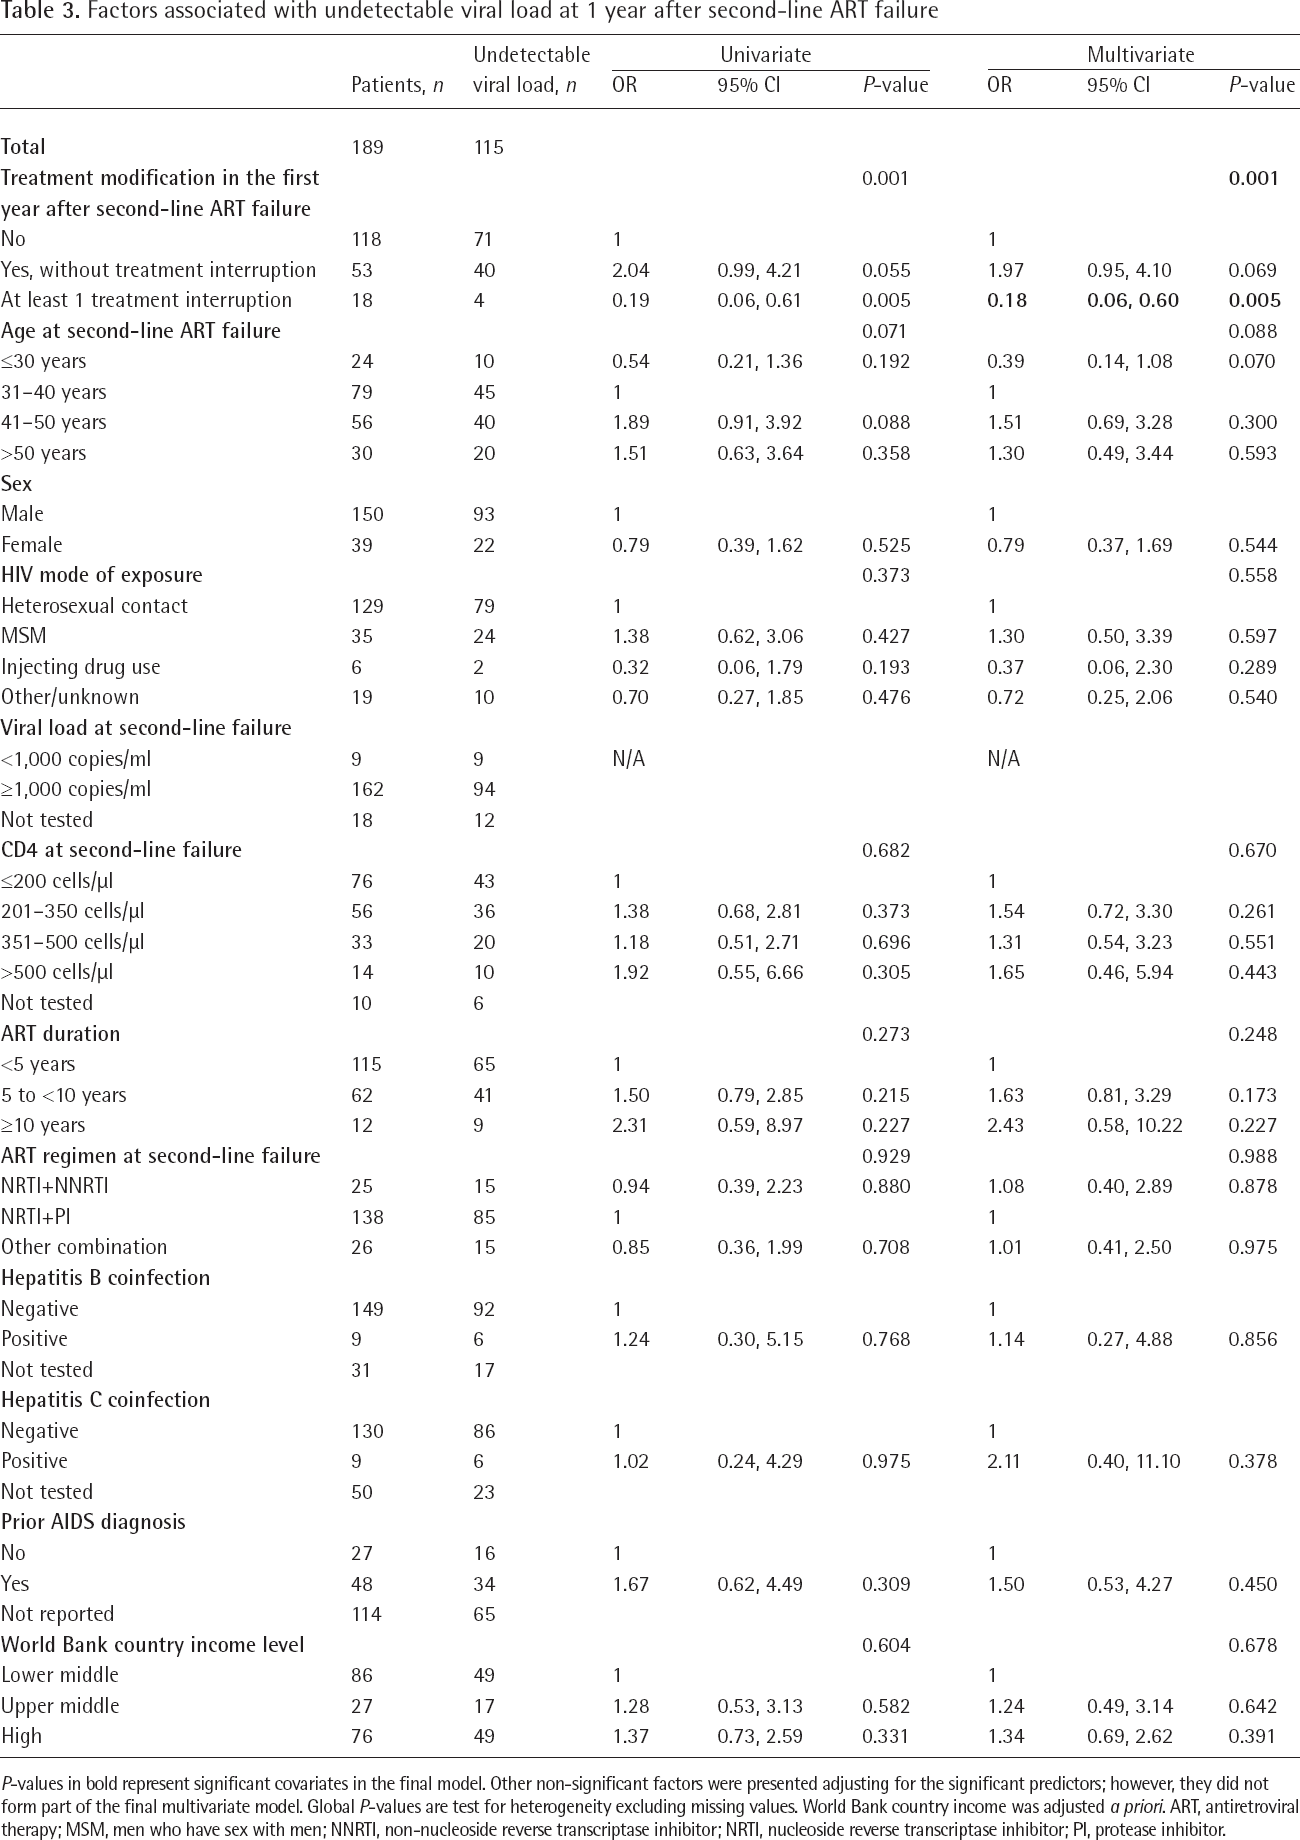
P-values in bold represent significant covariates in the final model. Other non-significant factors were presented adjusting for the significant predictors; however, they did not form part of the final multivariate model. Global P-values are test for heterogeneity excluding missing values. World Bank country income was adjusted a priori. ART, antiretroviral therapy; MSM, men who have sex with men; NNRTI, non-nucleoside reverse transcriptase inhibitor; NRTI, nucleoside reverse transcriptase inhibitor; PI, protease inhibitor.
Adjusting for country income level, patients who had treatment interruption at least once during the first year after second-line failure were less likely to achieve undetectable VL compared with those who had remained on the failing regimen (OR=0.18, 95% CI 0.06, 0.60; P=0.005). Those who had a treatment modification without an interruption showed no differences in the odds for achieving undetectable VL (OR=1.97, 95% CI 0.95, 4.10; P=0.069). No other factors were associated with undetectable VL at 1 year after second-line ART failure.
Survival
There were 39 deaths from 328 patients (12%) after second-line ART failure (Table 4). The median follow-up time from second-line failure was 2.8 years (IQR 1.2-5.2). The overall mortality rate was 3.2 per 100 person-years (/100PYS). The mortality rate among patients who did not currently have a treatment modification was 3.9/100PYS while those who had a modification but were currently on ART had a rate of 3.0/100PYS. No deaths occurred during periods of treatment interruption (P log-rank =0.182; Figure 1). There were 61 patients (19%) who became LTFU after second-line failure. These LTFU patients were included as competing risk in the analysis. In multivariate analysis, factors associated with mortality were older age >50 years (SHR=4.20, 95% CI 1.94, 9.11; P<0.001) compared with age 31-40 years, and injecting drug use as a mode of HIV exposure (SHR=5.29, 95% CI 1.73, 16.15; P=0.003). Higher CD4 counts (351-500 cells/μl: SHR=0.12, 95% CI 0.03, 0.50; P=0.004; and >500 cells/μl: SHR=0.06, 95% CI 0.01, 0.54; P=0.012) compared with CD4 ≤200 cells/μl were associated with improved survival. Treatment modification was not associated with differences in survival.
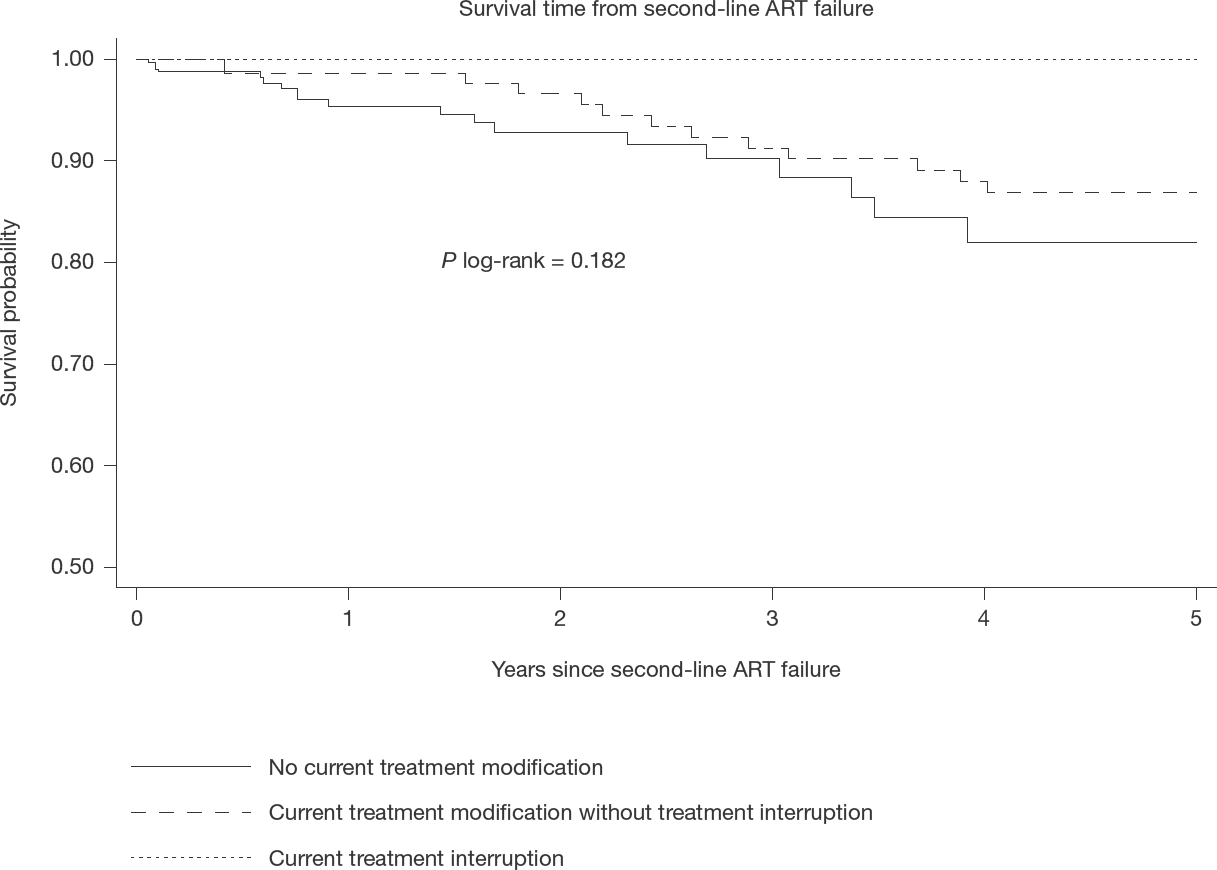
Survival time from second-line ART failure by current treatment modification status
Factors associated with survival after second-line ART failure

P-values in bold represent significant covariates in the final model. Global P-values are test for heterogeneity excluding missing values. World Bank country income was adjusted a priori.
Treatment modification, CD4, viral load and ART duration are time-updated variables. ART, antiretroviral therapy; MSM, men who have sex with men; NNRTI, non-nucleoside reverse transcriptase inhibitor; NRTI, nucleoside reverse transcriptase inhibitor; PI, protease inhibitor.
Discussion
In our cohort of PLHIV in Asia-Pacific, more than half of those who failed second-line ART had a subsequent treatment modification. Most patients received NRTI+PI regimen at time of second-line failure and a small proportion were switched to an INSTI-based regimen. The average CD4 cell increase at 1 year post second-line failure was significantly higher in those that had a treatment modification without treatment interruption, than those who did not have a modification. No significant differences in CD4 changes were observed among those who had at least one interruption. Achieving undetectable VL following second-line failure was less likely for those who had interrupted treatment at least once compared with those who remained on the failing second-line regimen. Survival was not associated with treatment modification.
Availability of different ART combinations is often limited in resource-poor settings in the Asia-Pacific region. As second-line ART options are not readily available among some of our sites, and with limited access to INSTI-containing regimens, switching to third-line ART combinations may not be a feasible option in our setting. Although more than half of our patients had a treatment modification, only a small proportion had switched to one of the WHO recommended INSTI-based dolutegravir or raltegravir- combination ART regimens [5]. A South African study reported approximately 5% of PLHIV who have failed second-line ART had switched to third-line. Of those who had switched, almost half had switched to a raltegravir-containing regimen [15].
CD4 cell increase after second-line failure was higher in those who had a treatment modification without treatment interruption, compared with those who did not have a treatment modification. This is consistent with findings where those who had a delayed switch experienced worst immunological outcomes [16]. However, no differences were observed in the proportion with undetectable VL between these two sub-groups. Overall, 60% of our study population had undetectable VL at 1 year after second-line failure. Other studies in resource-limited settings have reported varying proportions of undetectable VL ranging from 64% to 93% [1,17,18], although it is worth noting that different definitions of undetectable VL were adopted in these studies. We also found that although there was no significant difference between those on ART who had treatment modification compared with those who did not, patients who had treatment interruption in the first year after second-line failure were less likely to achieve undetectable VL compared with patients who did not have a modification. This emphasizes the importance of maintaining continuous second-line therapy when no feasible third-line options are available. Prior to the availability of current third-line regimens, patients failing second-line ART were maintained on the failing regimen, raising concerns regarding possible development of drug resistance mutations due to prolonged viral failure [19]. A Ugandan study found up to 19% of patients failing second-line had a major PI mutation and 83% had an NRTI mutation, with a median time of 29 months on second-line therapy [20]. However, it is important to differentiate between ART failure due to drug resistance and failure due to poor adherence [21] as proper adherence intervention strategies can effectively lead to VL re-suppression, thus avoiding unnecessary switch to third-line therapy [20,22,23]. Although we did not include adherence or drug resistance as risk factors due to data not being collected in one or both of our cohorts, results from these studies suggest the importance of remaining on ART to achieve optimal VL response further reinforcing our findings of poor VL outcomes in those who had treatment interruption compared with those who remained on the failing regimen.
Survival time was associated with traditional risk factors such as age, mode of HIV exposure and CD4 cell count. There was no association between treatment modification and subsequent survival. There is limited literature comparing survival outcomes after second-line treatment failure, however, studies have reported up to 26% mortality among those who have failed but remained on second-line [11] and 5–11% among those who have switched to third-line [3,15,24,25]. Our study observed a mortality rate of 3.9/100PYS for those who did not have a treatment modification, and 3.0/100PYS for those who did without ART interruption. Delayed switch from first-line to second-line ART has been shown to be associated with increased mortality in resource-limited settings [26,27]. This study observed no differences in survival outcomes after second-line ART failure, however, the benefits of treatment modification were seen with greater CD4 increase in those who had their treatment modified without interruption, while those who had treatment interruption were less likely to achieve undetectable VL compared with those who remained on the same failing second-line regimen.
There are several limitations to the study. We defined virological failure as a single VL measurement ≥1,000 copies/ml without a second confirmatory test. We adopted this approach as VL testing in many of our sites is conducted on an annual basis. Although using this definition could lead to an over estimation of virological failure, it does allow for capture of all potential virological failures and assessment of any subsequent treatment change. Although adherence has been shown to be an important predictor of treatment outcomes amongst patients who have failed second-line ART, we did not adjust for ART adherence. Our TAHOD-LITE cohort does not collect ART adherence, as such we were unable to control for the confounding effects of adherence in our analyses. Drug resistance information was not available in our two cohorts further limiting the assessment of its association with treatment failure. We defined treatment modification as a change of two drugs or a drug class change from second-line ART. This definition did not specifically include a switch to dolutegravir or raltegravir due to limited availability of integrase inhibitors in our region. Finally, the small number of patients included in this analysis does not allow us to make inference about the effects of treatment modification following second-line failure in the general PLHIV population in Asia.
In conclusion, improved immunological outcomes were observed among PLHIV who had failed second-line ART and had a subsequent treatment modification without treatment interruption. There were no differences in mortality, however, undetectable VL was less likely to be achieved if ART was interrupted compared with those who remained on the failing regimen. These findings indicate that maintaining patients on the same second-line ART combination provided better VL control than having treatment interruption, further reinforcing the WHO recommendations of continuation with the well-tolerated regimen when no other third-line treatment options are available.
Footnotes
Acknowledgements
The TREAT Asia HIV Observational Database and The TREAT Asia HIV Observational Database Low-Intensity TransfEr are initiatives of TREAT Asia, a program of amfAR, The Foundation for AIDS Research, with support from the U.S. National Institutes of Health's National Institute of Allergy and Infectious Diseases, the Eunice Kennedy Shriver National Institute of Child Health and Human Development, the National Cancer Institute, the National Institute of Mental Health, the National Institute on Drug Abuse, the National Heart, Lung, and Blood Institute, the National Institute on Alcohol Abuse and Alcoholism, the National Institute of Diabetes and Digestive and Kidney Diseases, and the Fogarty International Center, as part of the International Epidemiology Databases to Evaluate AIDS (IeDEA; U01AI069907). The Kirby Institute is funded by the Australian Government Department of Health and Ageing, and is affiliated with the Faculty of Medicine, UNSW Sydney. The content of this publication is solely the responsibility of the authors and does not necessarily represent the official views of any of the governments or institutions mentioned above.
A list of the site investigators and study teams can be found in Additional file 1.
The authors declare no competing interests.