
Abstract
Background
Methods
Results
Conclusions
Introduction
Chronic HBV (CHB) infection is a major health-care problem and affects about 248 million individuals [1], contributing to a severe disease burden worldwide [2]. The prevalence of CHB infection varies strikingly in different geographic areas, with high prevalence in areas such as Asia, sub-Saharan Africa and the Indian subcontinent [3].
The risk of developing cirrhosis and primary hepatocellular carcinoma (HCC) is substantially higher in CHB patients than in non-carriers [4]. The goal of CHB treatment is to prevent development of liver cirrhosis and cancer, which takes long-term follow-up to detect and confirm. Therefore, it is critical to select reliable clinical end points in clinical trials and medical practice to assess true treatment effects. Candidate clinical end points in CHB treatment include virology of the pathogen and biochemical histology and serology of the host [5]. The typical virology end point is HBV DNA in the circulation. The convenience of sample collection and the standardized assay development makes HBV DNA measurement a commonly used end point. However, monitoring HBV DNA cannot refect the true status of viral elimination in the liver because viruses enter hepatocytes and form very stable and hard-to-eliminate covalently closed circular DNA (cccDNA) or integrate into host genome in the nuclei. On the other hand, alanine aminotransferase (ALT), though an essential index in disease progression assessment, lacks specificity for CHB and fluctuates over time, it cannot be used as the only end point [6]. The end points that indicate a true interplay between the virus and the host immune response were explored afterwards, such as hepatitis B core antigen and core antibody, hepatitis B e antigen (HBeAg) and e antibody (anti-HBe), and hepatitis B surface antigen (HBsAg) and surface antibody (anti-HBs). HBsAg was later found to be a more reliable clinical end point among the different antigen proteins [6–8]. It is thus generally agreed that a functional cure is indicated by sustained seroclearance of HBsAg and seroconversion is established when surface antibody is observed [9]. Patients who achieved functional cure are at much reduced risk of developing cirrhosis and/or HCC, as compared with those who remained positive for HBsAg [10,11]. In addition, HBsAg and surface antibodies are becoming easier to assess via serum sampling with established tests.
There have been a few meta-analyses [12–18] that focused on efficacy comparison among two classes of therapies in monotherapy or combination. Given the importance of functional cure and HBsAg end points, there has not been a systematic effort to describe HBsAg dynamics in CHB patients following different anti-HBV treatments. Such analyses may further our understanding about this infectious disease and treatment effect. Therefore, the purpose of this research is to systematically summarize the kinetics change of HBsAg and characterize the influencing factors of HBsAg loss and seroconversion percentage through a meta-analysis of published papers in the recent 20 years.
Methods
Literature search and database building
Literature search was conducted through PubMed from January 1995 to May 2015. Relevant papers were identified using ‘Hepatitis B’ and currently marketed anti-HBV drug names (interferon, lamivudine, entecavir, adefovir, telbivudine, tenofovir) as key words and with no restriction in article types.
A flow chart of paper inclusion and exclusion criteria is shown to ensure the database quality (Figure 1). We included all full-text available and English-written papers with specific end points reported. Publications were excluded if one of the following conditions was met: participants were coinfected with other viruses; drug name and dosage regimen were not reported; results of different treatment arms were reported together; participants were under immune therapy other than interferon therapy; the disease deteriorated into liver cancer; participants were co-medicated with other antiviral drugs not listed above, such as herbal medicine; the adopted quantification assay for end point measurement was questionable.
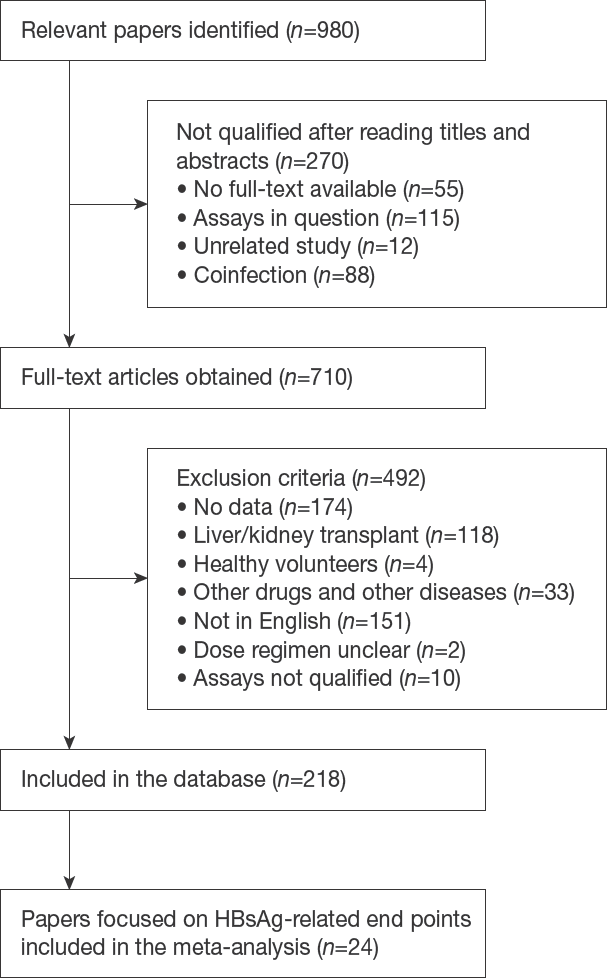
Flow chart of paper selection
Data were extracted from articles by one curator and double-checked by one reviewer afterwards. The following information was extracted from each paper: demographic information, medication history, sample size, end points and their values, treatment information (including co-medication, drug and dose regimen) and literature information. Open source online software WebPlotDigitizer [19] was used to extract data contained in figures.
There are several end points included in the database, such as HBV DNA level, HBeAg, HBsAg, liver cccDNA level and ALT level. In this meta-analysis, we only focused on a subset of studies in the database involving HBsAg-related end points in adult patients, thus there are 24 published HBsAg-related papers included in this meta-analysis. Three HBsAg-related end points were evaluated in the following analysis: mean quantitative HBsAg level, percentage of HBsAg loss and percentage of HBsAg seroconversion. These end points were reported at population level of corresponding treatment arms or subgroups in each study (Table 1). Each paper had one unique Study ID assigned. In the following analysis, a unique reference ID was assigned to each subgroup to distinguish arms in one study. Reference ID was formatted as Study ID (SID) and an index number separated by an underline.
Summary of 24 published papers involved in this meta-analysis

Each row representing one treatment arm or subpopulation was labelled by a unique reference ID. Reference ID was formatted as Study ID (SID) and an index number separated by an underline. Each paper had one unique Study ID assigned from the database. Sample size represents the number of patients initially included in this treatment arm. There are three kinds of population-level end points: quantitative hepatitis B surface antigen (HBsAg) level (I), HBsAg loss percentage (II) and HBsAg seroconversion percentage (III). End point category: I: average HBsAg quantitative level; II: HBsAg loss percentage; III: HBsAg seroconversion percentage. ADV, adefovir dipivoxil; EFP, end of follow-up time, starting from treatment initiation; EOT, end of treatment time, starting from treatment initiation; ETV, entecavir; IFN, interferon-α2b; LAM, lamivudine; LdT, telbivudine; PEG-IFN, pegylated interferon-α2b; TDF, tenofovir disoproxil fumarate. Empty entry means data not available.
Original unit is pg/ml (=2.83e5 copies/ml).
Abbott Architect assay (lU/ml) quantification method.
Calculated from individual level data, sample size is 24 for quantitative data.
QIE Laurel quantification method (mg/ml).
The weighted sum of nonresponder group and responder group; all LAM-resistant patients.
Original unit is lU/ml (=5.6 copies/ml).
Roche Elecsys HBsAg II assay quantification method (lU/ml).
Study quality and heterogeneity assessment
Two researchers independently assessed the quality of non-randomized studies with the Newcastle-Ottawa quality assessment scale from three aspects: selection process of cohorts, similarity and comparability between cohorts, and ascertainment of the outcome of interest.
To test study heterogeneity, study effects were included as a discrete covariate in weighted linear regression of maximum HBsAg loss percentage. We then performed a sensitivity test for the studies which had significant coefficients in the regression analysis (Additional file 1). In terms of subgroup analysis where pooled estimates were calculated through random-effects model, study heterogeneity was also evaluated by I-square statistics (See Statistical analysis for details).
Data preprocessing for statistical analysis
Unit conversion and logarithm transformation
The quantitative level of HBsAg was described by the unit of IU/ml in most studies. Only one study [20] adopted a different HBsAg quantification method (Laurel Immuno-electrophoresis) with μg/ml as the unit. We converted the unit into IU/ml according to the WHO standard [21] that 1 IU is equivalent of 0.43 ng. In addition, HBV DNA viral load was quantified as three different units: copies/ml, IU/ml (5.6 copies/ml) and pg/ml (2.83e5 copies/ml). We unified all DNA measurements into the unit of copies/ml [22]. For ALT level, there existed two different units: IU/l and ULN (upper limit of normal). We adopted the latest criteria to convert 1 ULN into 52 IU/l [23]. In addition, we performed logarithm transformation for HBsAg quantitative level and HBV DNA viral load.
Derived response variables
For quantitative HBsAg level, a response variable named relative maximum HBsAg change (Equation 1) was constructed to describe relative HBsAg decrease without the influence of baseline (upon treatment initiation) value. For percentage data, two response variables named maximum HBsAg loss percentage and maximum HBsAg seroconversion percentage were constructed as the maximum percentage change achieved during the recorded time period, including the follow-up period:

Covariate construction
Seven commonly considered clinical factors were included as covariates: percentage of HBeAg-positive patients, baseline HBsAg level, baseline viral DNA load, baseline ALT value, treatment information, end of treatment time (EOT) and end of follow-up time (EFP). All baseline values refer to the time point of treatment initiation. Treatment information was further simplified as a discrete variable ‘treatment’ of three levels: interferon or pegylated interferon (IFN), nucleoside analogue (NUC), and combination therapy of IFN and NUC (NUC+IFN). In addition, EFP is equal to EOT if there was no follow-up in the study design. A derived covariate, maxtime, was defined as the first time point when an end point reached its maximum value change from baseline. Note that two of the covariates: baseline HBsAg level and percentage of HBeAg+ patients were excluded from weighted linear regression but investigated separately in Figure 2B and Additional file 2 because baseline HBsAg level had too much missing data and HBeAg+ percentage was bimodally distributed. Study effect was included as a discrete covariate in regression analysis to test the heterogeneity of the studies.
Mean HBsAg quantitative level
Statistical analysis
The relationships between three response variables and covariates were first explored graphically via scatterplots and forest plots. Multivariate and univariate covariate analyses were further performed via weighted linear regression on maximum HBsAg loss percentage since that is the only response variable with sufficient data for regression analysis. Random-effect model was performed on maximum HBsAg loss percentage and maximum HBsAg seroconversion percentage to compare the pooled estimates in three treatment subgroups.
Weighted linear regression
To investigate the influencing factors on maximum HBsAg loss percentage, weighted linear regression was adopted to perform univariate and multivariate analyses considering study heteroscedasticity, that is, the difference between observed variances. Each treatment arm or subgroup annotated as a separate reference ID was weighted by the inverse of observed variance. The variance was calculated from Wilson score binomial proportional confidence interval considering studies with zero percentage and small sample sizes [24]. Equation 2 gives the calculation of Wilson score corrected variance where p is the percentage value, n is the sample size and Za/2 denotes the 1-α/2 percentile of the standard normal distribution.

Subgroup analysis
To compare therapeutic effects on maximum HBsAg loss percentage and maximum HBsAg seroconversion percentage, subgroup analysis was conducted stratified by three therapy types (NUC, IFN and NUC+IFN). The pooled subgroup estimates of maximum percentage and their 95% CI were calculated with a random-effects model. I-square statistics and P-value were also derived from the model. When evaluating study heterogeneity, we considered no heterogeneity as less than 25%, low heterogeneity as 25% to 50%, moderate heterogeneity as 50% to 75% and high heterogeneity as greater than 75% [25]. The pooled estimates were further compared using a z-test because of their infinite approximation to normal distribution.
Statistical analysis software
Statistical analysis was performed using R (v3.3.1) and RStudio (v0.99.903). All plots were generated with package ggplot2 (v2.2.1) in R.
Results
Study characteristics
The literature selection process is shown in Figure 1. A total of 218 articles were finally included in the overall HBV database according to the inclusion and exclusion criteria. This meta-analysis focused on HBsAg-related end points and thus included 24 relevant papers [7,20,26–47].
These 24 papers (Table 1) involved 6,674 adult CHB subjects in total. The sample sizes of different patient subgroups ranged from 9 to 449. The median age of subgroups ranged from 31 to 47 years and the proportion of male patients ranged from 63% to 95%. Nine out of 24 papers reported mean HBsAg quantitative level.
There are 14 randomized studies and 10 non-randomized studies. Two researchers independently assessed the non-randomized study quality with Newcastle-Ottawa quality assessment scale. Scores ranged from 4 or 5 to 7 with a median of 4.5 or 5.
Statistical analysis on HBsAg-related end points
Quantitative HBsAg Level
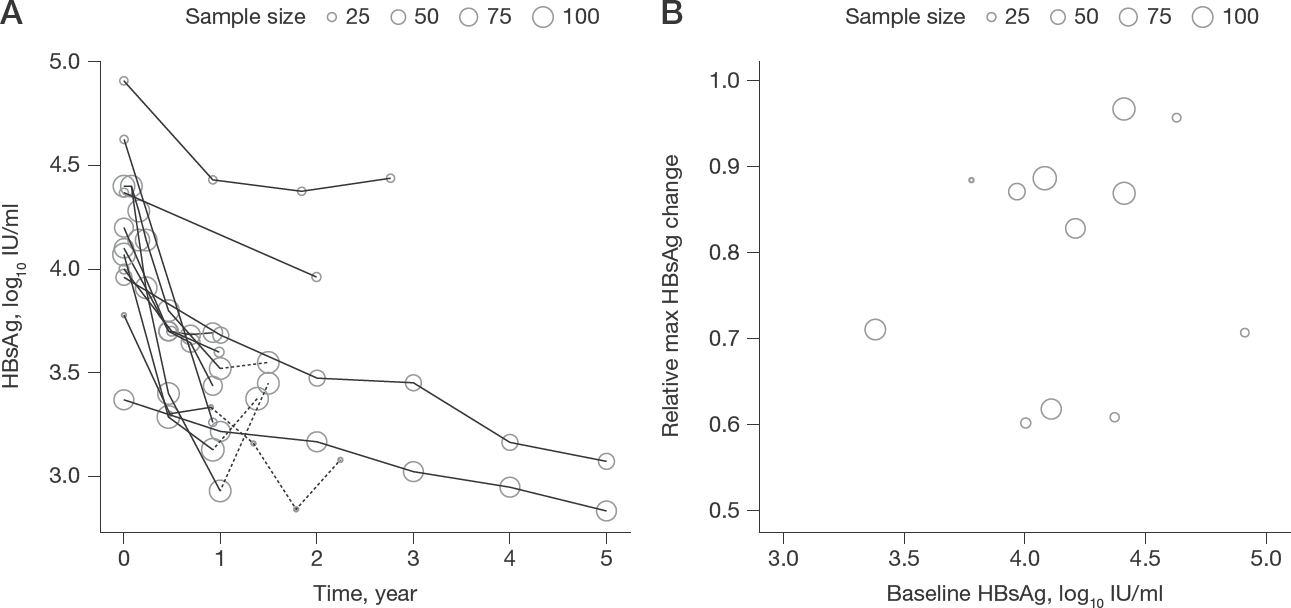
The kinetics of mean HBsAg level in nine papers reporting HBsAg quantitative values along with time was shown in Figure 2A, where mean HBsAg level in all studies decreased from the beginning of treatment, regardless of therapies. In all studies with follow-up, mean HBsAg level relapsed post-treatment, emphasizing the importance of treatment continuation. No strong relationship was observed between relative maximum HBsAg change and baseline HBsAg level (Figure 2B).
HBsAg loss percentage
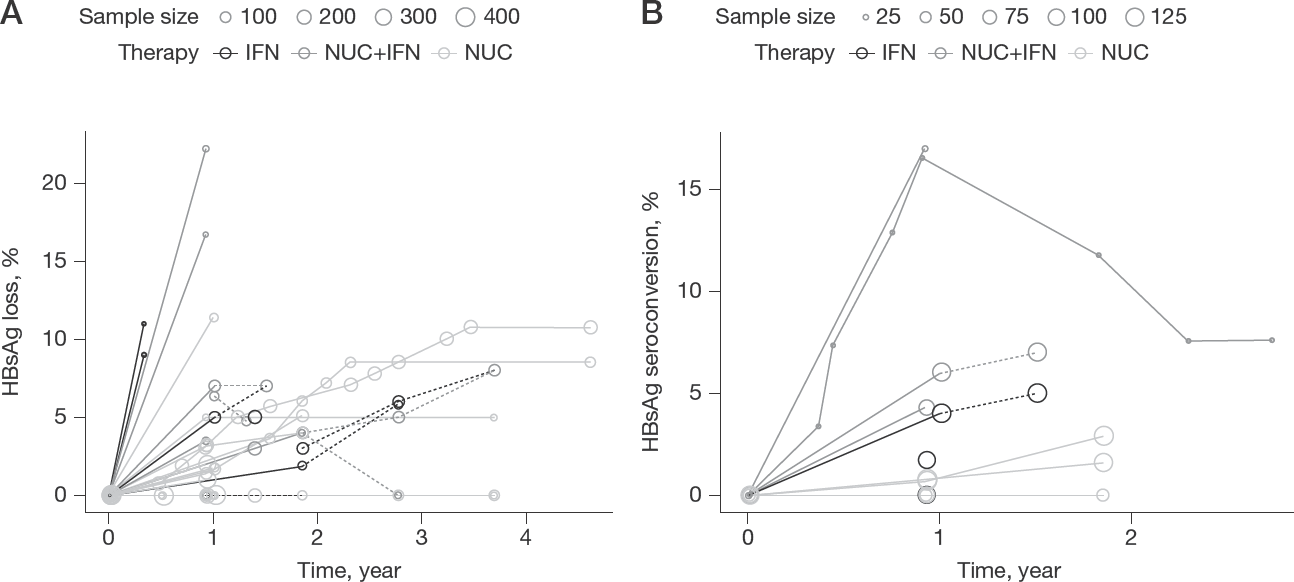
Fourteen papers provided data on the percentage of HBsAg loss, generating 41 subgroups or treatment arms with separate reference IDs. Figure 3A (Additional file 3 panel A for coloured version) described the kinetic changes of HBsAg loss percentage. Studies receiving interferon-containing treatment (IFN and NUC+IFN) appeared to have a higher percentage of HBsAg loss. Some NUC-treated arms even reported no HBsAg loss cases during the whole treatment period. In some follow-up studies, the HBsAg loss percentage dropped after the cessation of treatment.
Kinetics of HBsAg loss and seroconversion percentage
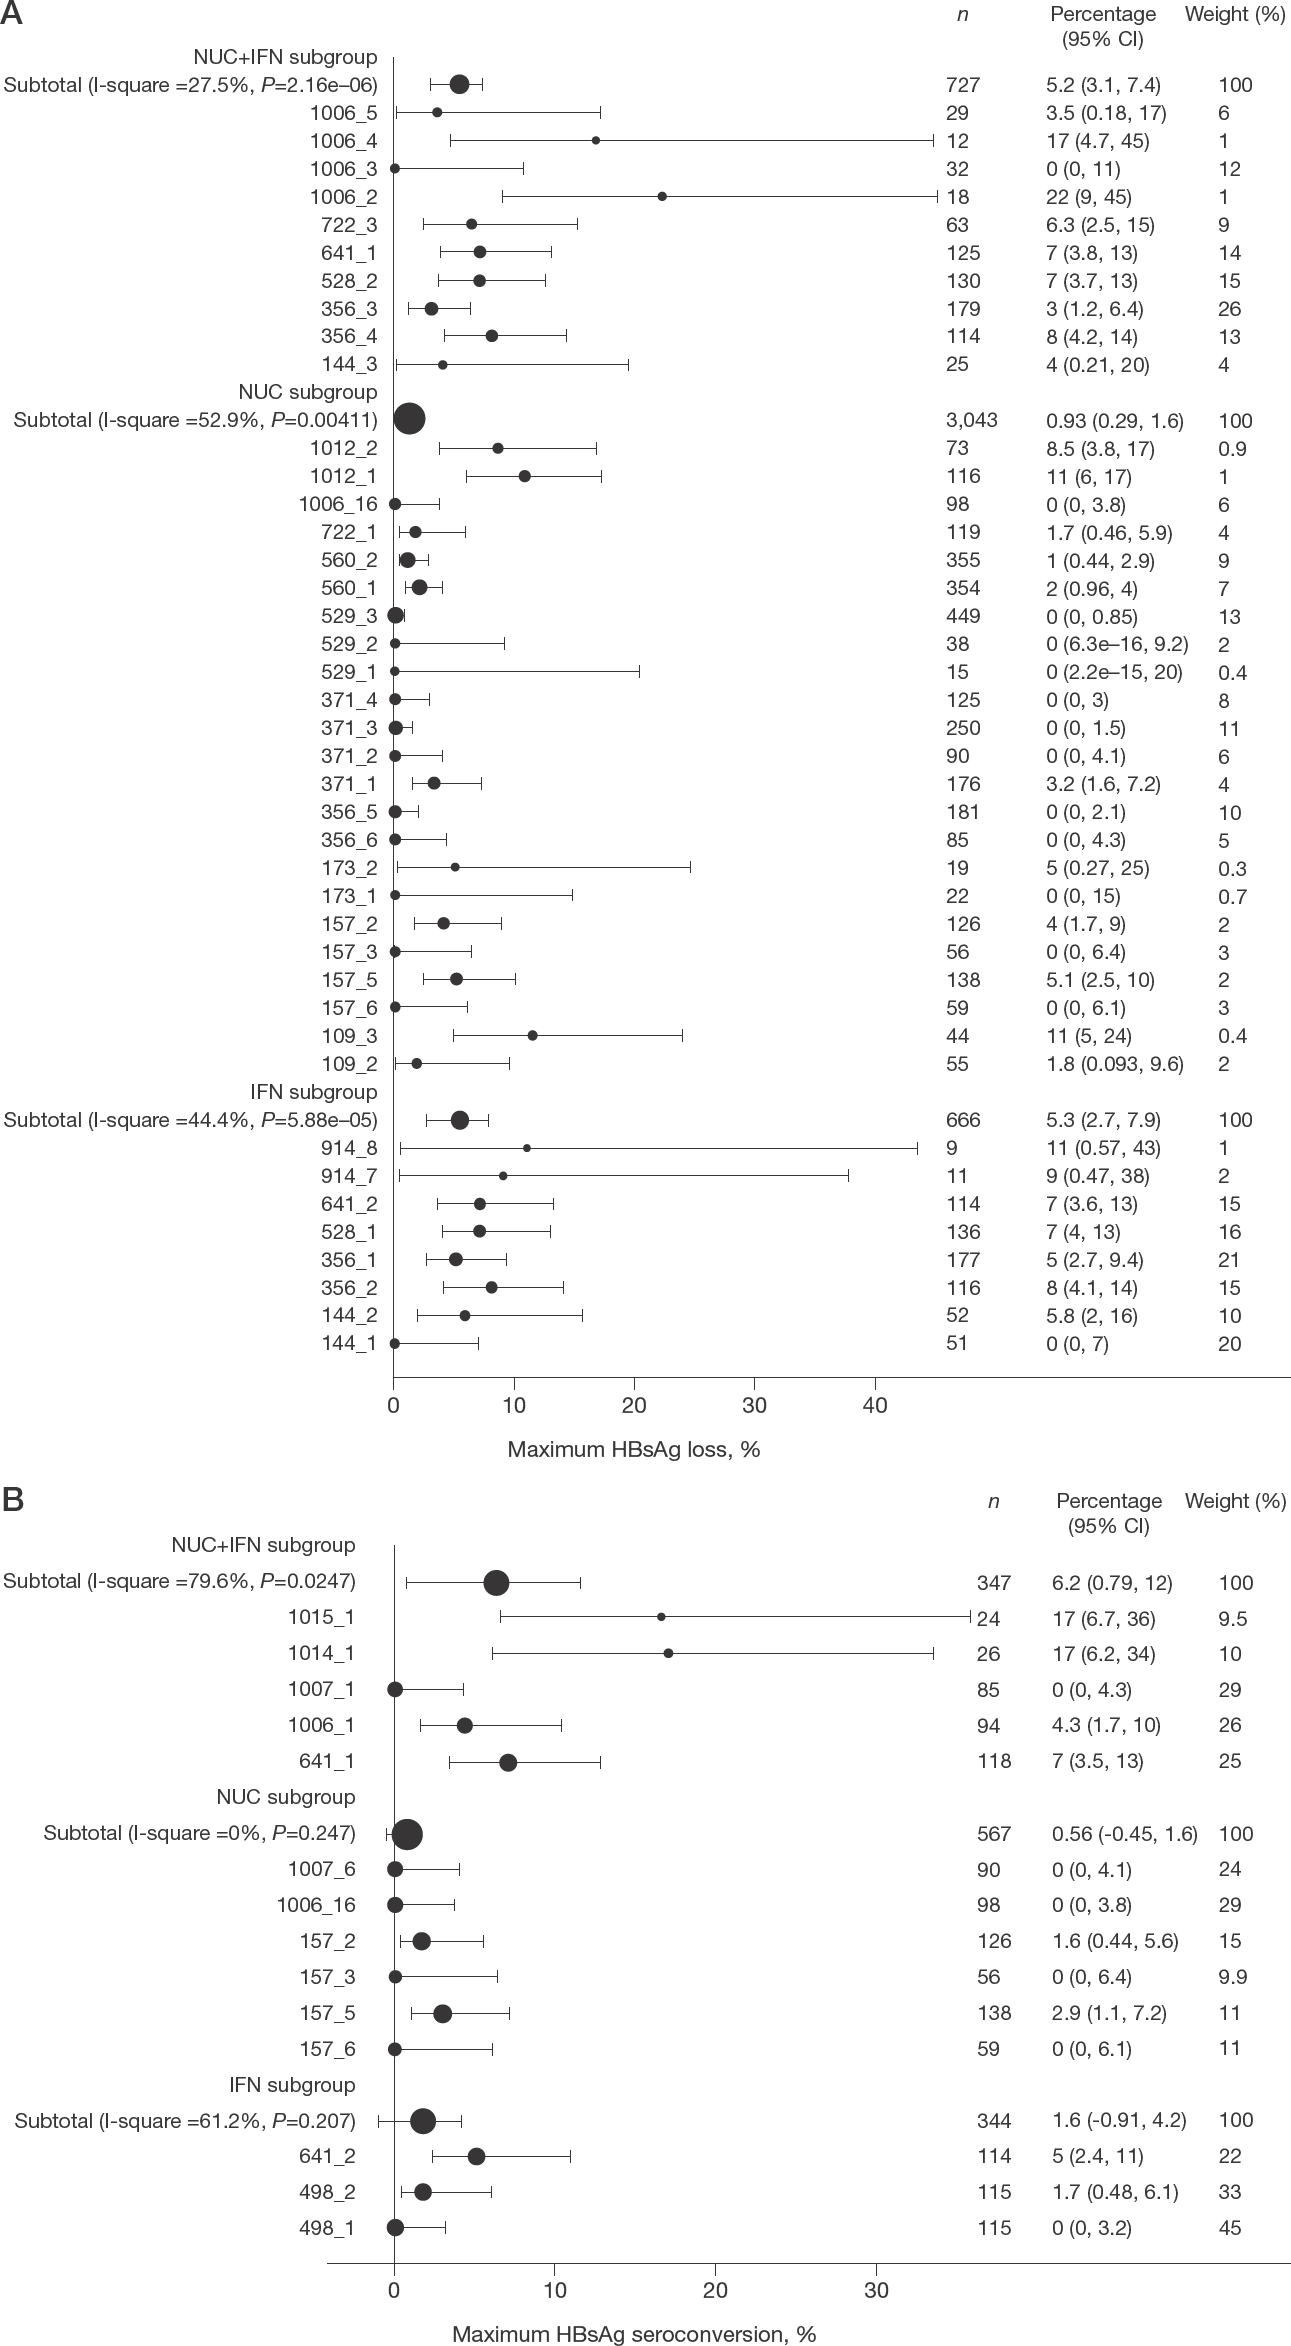
Maximum HBsAg loss percentage (Figure 4A) was derived to indicate the maximum treatment effect. The weighted mean estimates of maximum HBsAg loss percentage with 95% confidence intervals (CI) in three treatment subgroups were 5.3% (2.7%, 7.9%) for IFN, 0.93% (0.29%, 1.6%) for NUC and 5.2% (3.1%, 7.4%) for NUC+IFN. The maximum HBsAg loss percentage of IFN-treated patients (P=0.0089, z-test) or IFN+NUC-treated patients (P=0.00057, z-test) were both significantly higher than that of NUC-treated patients.
Maximum HBsAg loss and seroconversion percentage
The relationship of maximum HBsAg loss percentage and covariates was explored both graphically (Additional file 4 shown for three time covariates and Additional file 2 for percentage of HBeAg+ patients) and through weighted linear regression (Table 2). In Additional file 2, no obvious trend of HBeAg status was concluded due to limited data. In univariate weighted linear regression, maxtime had the most significant coefficient and its univariate model can best predict maximum HBsAg loss percentage (R 2 =0.75). This indicated that higher maximum HBsAg loss percentage is associated with longer time to reach the value. Other covariates including EOT, EFP, NUC usage and baseline viral load, also had significant coefficients (P<0.05) in their corresponding univariate models, which was consistent with the subgroup analysis and Figure 3A. In the multivariate analysis, maxtime (P<0.01) continued to be a significant covariate. The relationship among maxtime, EOT and EFP from each study were displayed chronologically in Additional file 5.
Weighted linear regression analysis on maximal HBsAg loss percentage

In univariate analysis, nucleoside analogue (NUC) therapy, maxtime and baseline viral DNA level have significantly non-zero coefficients, which is basically consistent with previous results (Figure 4 and Additional file 4 panel A). In multivariate analysis, maxtime (P<0.01) continued to be a significant covariate.
P<0.01;
P<0.05.
ALT, alanine aminotransferase; EFP, end of follow-up; EOT, end of treatment; HBsAg, hepatitis B surface antigen; IFN, interferon; SID, Study ID.
HBsAg seroconversion percentage
Seven independent papers revealed HBsAg seroconversion percentage. The kinetics of HBsAg seroconversion percentage was displayed in Figure 3B (Additional file 3 panel B for coloured version). Subgroup analysis of HBsAg seroconversion percentage by therapy was shown in Figure 4B. Treatment arms receiving interferon-containing (IFN and NUC+IFN) therapies generally had a higher HBsAg seroconversion percentage. The pooled estimates of maximum HBsAg seroconversion percentage in IFN, NUC and IFN+NUC treated patients were 1.6%, 0.56% and 6.2%, respectively.
The HBsAg seroconversion percentage of one reference ID (reference ID =1014_1, sample size =34) unexpectedly dropped sharply after the initial increase (Figure 3B). This subgroup of patients had received a 48-week interferon treatment and continued with a nucleoside analogue only treatment. Two patients lost their antibody after the initial 48 weeks, that is, when interferon treatment ended.
Study sensitivity and heterogeneity test
In the univariate analysis of maximum HBsAg loss percentage (Table 2), none of the study effect coefficients was significant, suggesting a weak heterogeneity among the studies. However, in the multivariate analysis, one study (SID=641, refer to Table 1) appeared to have a significant coefficient (P<0.05). Therefore, we performed a sensitivity test of regression analysis (Additional file 1) by excluding this study. Maxtime, EOT, EFP, NUC therapy and DNA baseline continued to be significant in the sensitivity test and their corresponding coefficients remained around the same value. This may further attest to the reliability of our regression results.
There is low heterogeneity in the pooled analysis of maximum HBsAg loss percentage with I-square values equal to 27.5%, 52.9% and 44.4% in three treatment groups (Figure 4A). Moderate heterogeneity was observed in the analysis of maximum HBsAg seroconversion percentage with I-square values equal to 79.6%, 0% and 61.2% (Figure 4B) because of the small number of studies included. I-square value in NUC therapy groups is 0% because there is only one study contributing to non-zero values.
Discussion
Since CHB infection has stage specific characteristics of HBsAg dynamics [48] in disease progression [49], end point dynamics could be crucial to treatment optimization and drug development. This meta-analysis is the first one to systematically review and analyse all published studies in recent 20 years on three HBsAg-related end points. We found that interferon-containing treatment could achieve a higher percentage of HBsAg seroclearance and seroconversion than that of nucleoside analogue only treatment. Maximum percentage of HBsAg loss was positively correlated with the first time point when it reached its maximum value. Surprisingly, no strong relationship was observed between relative maximum HBsAg change from baseline and baseline HBsAg level.
All included studies, except one study with small sample size, led to a decrease in HBsAg level upon treatment initiation and a relapse of HBsAg level following cessation of a treatment (Figure 2A). On the other hand, most studies showed HBsAg loss or seroconversion percentage could remain the same or even increase after the end of the treatment (Figure 3). This indicated the importance of HBsAg loss or seroconversion in preventing HBsAg relapse, that is, HBsAg level should drop below quantitative limit or even induce antibody generation to remain a sustainable functional cure. It is noticeable that the HBsAg loss or seroconversion percentage is in general lower than 20% or 15%, respectively, regardless of the treatment types. We also compared the effect of treatment type on HBsAg-related end points. Interferon therapy alone or in combination with NUC led to significantly higher HBsAg loss percentage compared with NUC alone treatment. In addition, the combination therapy of IFN and NUC also led to the highest percentage of HBsAg seroconversion. A recent review [50] also mentioned the superior efficacy of pegylated interferon over lamivudine in achieving higher HBsAg loss percentage. Long-term follow-up of therapeutic-responder (with HBeAg loss and sustained viral DNA suppression) patients treated with interferon demonstrated higher HBsAg loss percentage [35] and improved liver conditions [51,52] compared with untreated controls. It suggested that interferon-based therapies, despite poor tolerability and adverse effects, are of clinical significance in CHB treatment, and combination therapy may be a more promising trend in achieving the ultimate clinical goal.
In current clinical practice guidance for treatment of HBV infection in the United States and Europe [53,54], combination therapy of NUC and IFN is not recommended in general due to no superior responses in virological or serological end points (mainly HBV DNA, HBeAg loss and HBsAg loss) compared with IFN or NUC monotherapy, based on limited data available of a few clinical trials. In clinical practice guidelines in the Asia–Pacific region [55] it is acknowledged that combination therapy shows promising results over NUC monotherapy, however, further studies are needed to validate these results before they can be recommended. Based on our analysis, the combination of IFN and NUC showed similar HBsAg loss percentage to IFN monotherapy and much higher than NUC monotherapy. It also demonstrated higher HBsAg seroconversion percentage than IFN or NUC monotherapy. The clinical significance of HBsAg seroconversion needs more investigation, though their occurrence rate is relatively low with current therapies and therefore limited data is available. As HBsAg seroconversion analysis is based on 17 subgroups or treatment arms from 7 studies in our analysis, more data in HBsAg seroconversion following anti-HBV treatment should be reported and accumulated to further our understanding about this treatment effect.
We then conducted univariate and multivariate weighted linear regression analyses to identify potential influencing factors on HBsAg loss percentage. All three time-related variables (maxtime, EOT and EFP) have a significant positive influence in the univariate analysis. This is consistent with findings from a 25-year long-term study: higher percentage of HBsAg loss is associated with longer treatment [56]. Therefore, our meta-analysis supported the recommendation of lifelong NUC administration to most patients [50]. It suggested that sufficiently longer treatment and follow-up duration should be a factor to consider in clinical trial design or patient care. This also highlights the necessity of determining optimal treatment and follow-up duration when developing antiviral drugs with a new mechanism of action.
In our meta-analysis, baseline HBsAg level did not show a clear relationship with maximum HBsAg change from baseline during the treatment. The predictive capacity of early-stage HBsAg level is still controversial in the field. Manesis et al. [57] and Chan et al. [58] concluded that baseline HBsAg level was predictive of HBsAg seroconversion and seroclearance in HBeAg-negative patients while Rijckborst et al. [59] showed that HBsAg decline in the first 12 weeks was insufficient in predicting sustained response in HBeAg-negative patients.
Overall, our research is the first meta-analysis to thoroughly summarize HBsAg-related end points and investigate possible influencing factors based on systematic literature collection in CHB-infected patients. Although there are some limitations in our analyses such as failure to include therapeutic or disease status details or publications from other databases, this meta-analysis consolidated the importance of longer treatment duration, and the potential value of immune-based therapies. These results may assist in better understanding HBV treatment effects of existing therapy options.
Footnotes
Acknowledgements
We sincerely thank Wei Lu (School of Pharmaceutical Sciences, Peking University, Beijing, China) and his students in Peking University Health Science Center for literature selection and database construction, Ming Hua and Jingyun Li (both Clinical Pharmacology and Pharmacometrics, Janssen China R&D, Beijing, China) for paper quality assessment, and Janssen China R&D for financial support.
YC and RC received funding from Janssen China R&D. The other three authors are employees with Janssen R&D or Janssen China R&D.
YC and JJ conceptualized and designed the study; RC collected data; YC, JJ and JJL analysed data; YC, JJ and JJL drafted the manuscript; YC, JJ, JJL and GL critically revised the manuscript.
YC was an intern at Janssen China R&D when working on this research. JJL is an employee of Janssen R&D. RC received funding from Janssen China R&D as academic collaborator. GL and JJ are employees of Janssen China R&D.
Additional file 1: A table showing sensitivity test in weighted linear regression analysis on maximal HBsAg loss percentage excluding one study (SID=641) can be found at ![]()
Additional file 2: A figure showing the relationship between percentage of HBeAg+ patients and three HBsAg related clinical end points can be found at ![]()
Additional file 3: A figure showing kinetics of HBsAg loss (A) and seroconversion (B) percentage (coloured version of Figure 3) can be found at ![]()