
Abstract
Background
Vitamin D (VitD) and calcium (Ca) supplementation attenuates antiretroviral therapy (ART)-associated bone loss, but it is unclear whether this effect is mediated through immunomodulation.
Methods
In this exploratory analysis of A5280, a 48-week, randomized, double-blind, placebo-controlled study of VitD/Ca supplementation with ART initiation, we characterized lymphocyte phenotypes and receptor activator of nuclear factor kappa-B ligand (RANKL) expression by median fluorescence intensity (MFI) at baseline and 48 weeks. Changes were evaluated within and between treatment groups by Wilcoxon signed rank and rank sum tests, respectively. Spearman correlations estimated relationships between cellular phenotypes and bone mineral density (BMD).
Results
Of 165 participants enrolled, 138 had samples for cellular phenotypes (64 VitD/Ca, 74 placebo). Markers of CD4, CD8 activation (CD38+HLA-DR+) declined (all P<0.001), but did not differ between arms. There was no decline in either %T-cells (CD4 and CD8) expressing RANKL or expression of RANKL by MFI. CD4 and CD8 activation markers were not correlated with BMD at baseline (r<0.15 and P>0.09 for all), but greater declines in CD4 activation correlated with greater declines in hip and spine BMD in both arms (0.25 ≤r ≤0.37, all P <0.05). A greater decline in CD8 activation was correlated with greater declines in both hip and spine BMD in the placebo arm only (hip r=0.31, P=0.009; spine r=0.25, P=0.035).
Conclusions
Reductions in T-cell activation are characteristic of ART initiation, but only correlated modestly with bone loss. VitD/Ca supplementation does not appear to mitigate bone loss through modulation of immune activation or expression of RANKL. Trial registration number: NCT01403051.
Introduction
Antiretroviral therapy (ART) initiation is associated with a 2–6% loss of hip and spine bone mineral density (BMD) within the first 24–48 weeks, increasing the risk for osteoporosis and fragility fractures in persons with HIV (PWH). This initial bone loss is marked by an increase in serum bone resorption markers followed by a delayed compensatory increase in bone formation markers [1]. The aetiology of bone loss associated with ART initiation may be due to the direct effects of ART on bone cells or vitamin D metabolism, or due to immune reconstitution with ART initiation resulting in a surge of pro-resorptive cytokines. Activated T-cells express tumour necrosis factor (TNF)a, interleukin (IL)6 and receptor activator of nuclear factor kappa-B ligand (RANKL), which are all known inducers of osteoclastogenesis [2]. Using a mouse model of immune reconstitution, in which T-cells were reconstituted by adoptive transfer into immunodeficient T-cell receptor (TCR)β knock out mice, Ofotokun et al. [3] observed an increase in production of RANKL and TNFα associated with trabecular and cortical bone loss. Similarly, in PWH initiating tenofovir disoproxil fumarte (TDF)-containing ART, Ofotokun et al. [4] observed a rise in plasma levels of RANKL and TNFα within 2–12 weeks associated with a rise in the serum bone resorption marker, C-telopeptide (CTX).
In ACTG A5280, we reported that vitamin D and calcium (VitD/Ca) supplementation prevented bone loss associated with initiation of efavirenz/emtricitabine/tenofovir disoproxil fumarate (EFV/FTC/TDF) [5]. After 48 weeks, VitD/Ca supplementation (vitamin D3 4,000 IU and calcium carbonate 1,000 mg daily) attenuated increases in bone turnover markers and decreases in BMD at the total hip and lumbar spine by approximately 50% in comparsion to placebo [5].
VitD plays a role in both the innate and adaptive immune responses and the vitamin D receptor is expressed by almost all cells of the immune system; in greatest quantity in CD8+ T-lymphocytes, but also in CD4+ T-lymphocytes, and to a lesser extent, B-cells and monocytes [6,7]. VitD downregulates cytokine release in activated T-cells and suppresses T-cell proliferation, reducing the net state of inflammation [8,9]. Therefore, VitD may play a role in downregulating cytokine release during immune reconstitution with ART initiation. In A5280, we evaluated change in soluble inflammatory markers, IL-6, soluble tumour necrosis factor (sTNFr)-I, sTNFr-II and sCD14, and found that with ART intiation there were significant within-group decreases in sTNFr-I, sTNFr-II levels from 0 to 24 and 48 weeks, but did not find any significant between-group differences in change in levels [5]. In this exploratory analysis of A5280, we examined the effect of VitD/Ca supplementation on cellular immune phenotypes and their association with BMD in PWH. We hypothesized that VitD supplementation would result in greater decreases in cellular immune activation markers and that greater decreases in cellular immune markers would be associated with less bone loss during ART initiation.
Methods
ACTG A5280 (NCT01403051) was a 48-week, randomized, double-blind, placebo-controlled study in which 165 PWH, naive to ART, with 25-(OH)D level ≥10 and <75 ng/ml (≥25 and <188 nmol/l), creatinine clearance (CrCl) ≥60 ml/min by Cockcroft-Gault, and serum calcium <10.5 mg/dl, were randomized to receive 4,000 IU cholecalciferol (vitamin D3) daily plus 500 mg calcium carbonate twice daily or identically matching placebos (Tishcon Corporation, Westbury, NY, USA). Primary and secondary treatment outcomes of percentage change in total hip and lumbar spine BMD, and bone turnover markers, procollagen-1 N-terminal pep-tide (P1NP) and C-terminal telopeptide of type 1 collagen (CTX), inflammatory biomarkers (IL-6, sTNFr-I, sTNFr-II and sCD14) and bioavailable VitD from baseline to 48 weeks have been previously reported [5,10].
Cellular phenotypes
Characterization of Tregs, T-cell immune activation and senescence, and T and B-cell expression of RANKL and osteoprotegerin (OPG) was performed by polychromatic flow cytometry on frozen/thawed peripheral blood mononuclear cells (PBMCs). To assess cell viability, PBMCs were stained using the Aqua Live/Dead cell stain kit (Invitrogen, Waltham, MA, USA) prior to cell surface staining and intracellular OPG and FoxP3 staining. PBMCs were surface stained with fluorochromeconjugated monoclonal antibodies to CD3, CD4, CD8, CD19, CD28, CD38, CD57, HLA-DR, CD25 (Becton Dickinson, BD, Franklin Lakes, NJ, USA) and RANKL (R&D Systems, Minneapolis, MN, USA). Cells were subsequently stained intracellularly for FoxP3 (eBioscience), or OPG Biotin (Leinco) and Streptavidin-BV421 (BD), and fixed in 1% formaldehyde. PBMCs were acquired on an LSRFortessa flow cytometer (BD) and analysed using FlowJo software (TreeStar, version 9.9.3, Ashland, OR, USA). Immune activation (CD38+/HLA DR+), senescence (CD28−/CD57+) phenotypes were characterized on the CD3+CD4+ and CD3+CD8+ T-cell subsets. Tregs (CD4+/CD25+/FoxP3+), and CD19+ B-cell phenotypes were compared as the % of parent population. Expression of RANKL and OPG was measured by mean fluorescence intensity (MFI) in the CD3+CD4+ and CD3+CD8+ T-cell subsets and CD19+ B-cell populations.
Statistical analyses
All analyses were performed as complete case intent-to-treat (ITT), which was limited to eligible participants who had both baseline and week 48 evaluations for cellular phenotypes (n=138). All available data, regardless of treatment change/discontinuation, were included. Wilcoxon signed rank tests were used to evaluate the within treatment group changes from baseline. Wilcoxon rank sum tests were used to test for differences between the two treatment groups. Spearman (rank-based) correlations were used to assess associations between BMD and cellular phenotyping markers. In this exploratory analysis, all statistical tests were two-sided interpreted at the 5% nominal level of significance without adjustment for multiple testing. Analyses were conducted using SAS statistical software 9.4 (SAS Institute Inc., Cary, NC, USA).
Results
There were 165 eligible participants enrolled in ACTG A5280, 151 completed study follow-up at week 48. Seven participants did not have any laboratory data due to insufficient samples, and an additional six participants were not included in this analysis due to low viable samples for cellular phenotypes. A total of 138 participants (64 in VitD/Ca arm and 74 in placebo arm) were included in this analysis. Table 1 summarizes baseline demographic, 25-(OH)D levels, BMD and soluble inflammatory marker levels for the analytic sample. Overall, the median age was 32 years, 92% male, median CD4 count 350 cells/mm3 with 17% having CD4 count ≤200 cells/mm3. No participants were coinfected with hepatitis B or C. The median BMD at the hip and at the spine were 1.05 g/cm3 and 1.12 g/cm3 (Z-scores 0.00 and −0.30), respectively.
Baseline characteristics by treatment arm

BMD, bone mineral density; BMI, body mass index; IL, interleukin; sTNFr, soluble tumour necrosis factor receptor.
Change in cellular phenotyping markers from baseline to week 48 by treatment arm
Changes in the percentage of cells expressing cellular phenotype markers from baseline to week 48 are summarized in Table 2. Marker levels appeared to be balanced between the two treatment arms at baseline, and there were no significant differences in percentage of cells between the two treatment arms from baseline to week 48 for any of the cellular markers (all P>0.25; Table 2). The within treatment arm declines were significant for markers of activation (CD38+/HLA-DR+) for the CD4+ or CD8+ T-cell subsets and and CD38+/HLA-DR+ B-cells along with the marker of immune senescence (CD28−/CD57+) for CD4+ or CD8+ T-cell subsets (all P<0.001). Significant declines in percentage of Treg+ cells were observed in the placebo arm (P=0.002), but not in the VitD/Ca arm (P=0.08); however, the between group difference was not statistically significant (P=0.50). In addition, Treg+ cells were not associated with 25-(OH)D levels at baseline or week 48.
Baseline and change in cellular phenotypes from baseline to week 48 by treatment arm
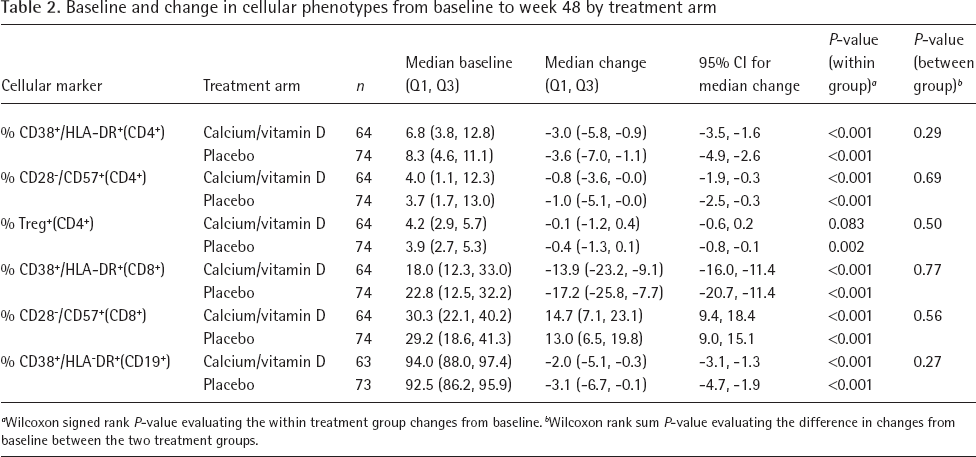
Wilcoxon signed rank P-value evaluating the within treatment group changes from baseline.
Wilcoxon rank sum P-value evaluating the difference in changes from baseline between the two treatment groups.
Baseline RANKL and OPG MFI were similar between treatment arms (Table 3). There were no significant declines in RANKL+(CD4+) MFI or RANKL+(CD8+) MFI in either treatment arm. However, RANKL+(CD19+) MFI declined more in the placebo arm than the VitD/Ca arm (median [Q1,Q3] −1,187 [-2,488,-250] versus −694 [-1,646, 445]; P=0.039). In contrast to RANKL, significant within arm declines were found in OPG(CD4+) MFI, OPG(CD8+) MFI and OPG(CD19+) MFI (all P<0.005), but the distribution of changes were not different between arms (P>0.50).
Change in expression of RANKL and OPG on lymphocytes by MFI from baseline to week 48 by treatment arm
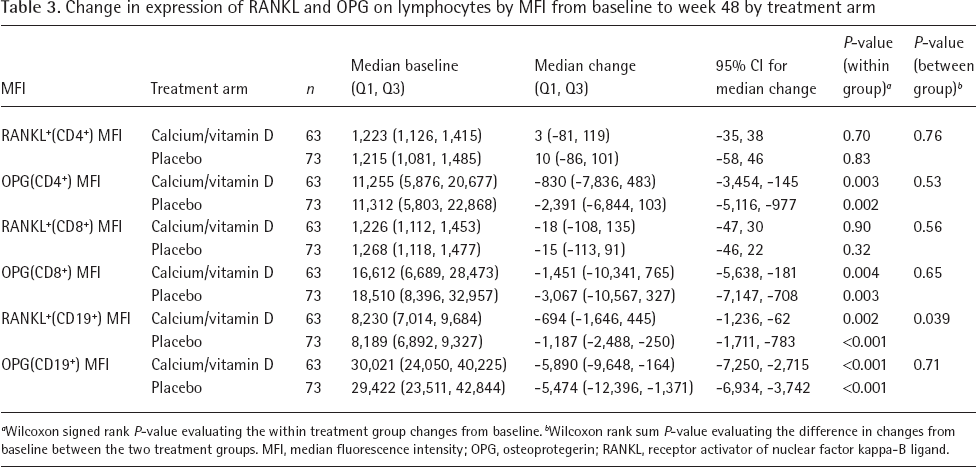
Wilcoxon signed rank P-value evaluating the within treatment group changes from baseline.
Wilcoxon rank sum P-value evaluating the difference in changes from baseline between the two treatment groups. MFI, median fluorescence intensity; OPG, osteoprotegerin; RANKL, receptor activator of nuclear factor kappa-B ligand.
Associations between hip/spine BMD and cellular markers at baseline (combined arms)
Rank-based Spearman correlations between hip/spine BMD and cellular markers at baseline were performed. There were no significant associations between %CD38+/HLA-DR+(CD4+), %CD38+/HLA-DR+(CD8+) or %CD38+/HLA-DR+(CD19+) and baseline BMD at either the hip or spine (data not shown). At baseline, a positive correlation was observed between %CD28−/CD57+(CD8+) and total hip BMD (r=0.22, P=0.013) and spine BMD (r=0.21, P=0.015).
Associations between change in cellular markers and percentage change in total hip BMD from baseline to week 48 by treatment arm
There were positive associations between changes in %CD38+/HLA-DR+(CD4+) and %change in total hip BMD in both the VitD/Ca and placebo arms (VitD/Ca r=0.25, P=0.047, placebo arm r=0.26, P=0.026; Table 4). A greater decline in %CD38+/HLA-DR+(CD4+) was associated with a greater decline in total hip BMD, with or without VitD/Ca supplementation. There was a positive correlation between changes in %CD38+/HLA-DR+(CD8+) and %change in total hip BMD (r=0.31, P=0.009) in the placebo arm but not in the VitD/Ca arm. A greater decline in %CD38+/HLA-DR+(CD8+) was associated with a greater decline in total hip BMD in the placebo arm. There was also a positive correlation between change in %CD38+/HLA-DR+(CD19+) and %change in total hip BMD in the VitD/Ca (r=0.30, P=0.020) but not the placebo arm; however, this association was not apparent on the scatter-plot (Figure 1A).

Associations between cellular markers and BMD by treatment group
Spearman correlations between percentage change in total hip BMD and change in cellular markers from baseline to week 48 by treatment arm

BMD, bone mineral density; MFI, median fluorescence intensity; OPG, osteoprotegerin; RANKL, receptor activator of nuclear factor kappa-B ligand.
Associations between change in cellular markers and percentage change in lumbar spine BMD from baseline to week 48 by treatment arm
There were positive associations between changes in %CD38+/HLA-DR+(CD4+) and %change in lumbar spine BMD from baseline to week 48 in both arms (VitD/Ca arm r=0.37, P=0.003, placebo arm r=0.30, P=0.010; Table 5). There was a positive association between change in %CD38+/HLA-DR+(CD8+) and %change in lumbar spine BMD in the placebo arm (r=0.25, P=0.035) but not in the VitD/Ca arm (r=0.20, P=0.12). There was also a positive association between change in RANKL+(CD19+) MFI (r=0.25, P=0.050) and %change in lumbar spine BMD in the VitD/Ca arm, but not in the placebo arm. A small but significant P-value was observed for the correlation between change in %CD38+/HLA-DR+(CD19+) and %change in lumbar spine BMD in the VitD/Ca arm (r=0.29, P=0.021; Figure 1B).
Spearman correlations between percentage change in lumbar spine BMD and change in cellular markers from baseline to week 48 by treatment arm

BMD, bone mineral density; MFI, median fluorescence intensity; OPG, osteoprotegerin; RANKL, receptor activator of nuclear factor kappa-B ligand.
Discussion
In ACTG A5280, we have previously reported that VitD/Ca supplementation with ART initiation increased total and bioavailable 25-(OH)D levels with beneficial effects on BMD over 48 weeks [5]. In these exploratory analyses, we observed decreases in %CD38+/HLA-DR+ activation marker expression for the CD4+ and CD8+ T-cell subsets and B-cells over 48 weeks in both treatment arms, characteristic of ART initiation. We also observed declines in the level of OPG expression on CD4+ and CD8+ T-cells and B-cells in both treatment arms, but declines in RANKL expression were apparent only on B-cells. Contratry to our hypothesis, greater declines in CD4+ T-cell activation markers were modestly correlated with greater declines in lumbar spine and total hip BMD. Changes in senescence (%CD28−/CD57+), Tregs, or OPG and RANKL expression did not correlate with declines in BMD. Among the cellular phenotypes analysed in these exploratory analyses, no apparent differences between the VitD/Ca arm and placebo arm were observed, except for RANKL expression on B-cells. The VitD/Ca arm was found to have a lesser decline in RANKL expression than the placebo arm (median −694 versus −1,187; P=0.039). VitD/Ca supplementation does not appear to mitigate bone loss through modulation of lymphocyte activation, T-cell senescence or expression of RANKL on lymphocytes.
The effects of ART on immune cell phenotypes have been described in several other ACTG studies, and within other study populations. In A5260s, Kelesidis and colleagues reported a 50% decrease in CD38+/HLA-DR+ expression on both CD4+ and CD8+ T-cells with further decreases at the 96 week evaluation; they also reported sustained decrease in senescent (CD28−/CD57+) CD4+ T-cells of approximately 31% regardless of ART given [11,12]. There was variability in the change in senescent (CD28−/CD57+) CD8+ T-cells by arm, but by week 96, there was no apparent change from baseline. Similary, a case-control study combining several ACTG studies found that CD28−/CD57+ expression on CD8+ T-cells did not vary significantly from baseline after 48 weeks [13]. In A5303, Chan and colleagues reported a 49–61% median decrease in %CD38+/HLA-DR+ activation marker expression on CD4+ and CD8+ T-cells by 48 weeks, but also an approximately 15–27% median decrease in % senescent (CD28−/CD57+) CD4+ T-cells [14]. In our study, we observed a similar but smaller magnitude of decrease in activation markers on the T-cell subsets: 3–4% median decrease in %activated (CD38+/HLA-DR+)CD4+ T-cells and 14–17% median decrease in %activated CD8+ T-cells. In contrast, we observed only a 0.8–1% decrease in senescent (CD28−/CD57+)CD4+ T-cells at 48 weeks. It is uncertain why our senescent marker data differs from data from other ACTG studies.
The immunomodulatory effects of VitD on adaptive immunity have been examined in multiple in vitro studies and in vivo animal studies. 1,25(OH)2D appears to promote a tolerogenic state by increasing T regulatory lymphocyte development and response, and by promoting Th2 cells and suppressing Th1 cells, and limiting Th1-mediated inflammatory responses [15]. Several randomized clinical trials (RCTs) have evaluated the effect of VitD supplementation on immune activation in the general population. In a RCT of 59 healthy adults, Bock et al. [16] found that oral supplementation of vitamin D3 (140,000 IU per month) increased the mean percentage of T reg cells by 1.5%. In an ancillary study (n=38) of an RCT examining VitD supplementation in individuals at high risk of hypertension, Konijeti et al. [17] reported that high dose vitamin D3 supplementation (4,000 IU daily of D3 for 6 months) of individuals with VitD deficiency (25-(OH)D ≤25 ng/ml) reduced CD4+ T-cell activation estimated by a functional assay of intracelluar ATP release after phytohaemagglutinin stimulation, in comparsion to participants randomized to 400 IU daily. Several RCTs have also evaluated the effects of vitamin supplementation among HIV-infected children and young adults on immune and bone outcomes. Stallings et al. [18] randomized 50 HIV-infected children to receive 7,000 IU VitD3 daily versus placebo, and reported that after 12 months, the percentage of naive T-cells were significantly higher and HIV RNA levels lower. Also, change in 25-(OH)D levels predicted HIV RNA levels at 3 and 12 months, and CD4+ T-cell percentage at 3 months [18]. Most pertinent to our study, Eckard et al. [19] found that among 51 HIV-infected youth aged 8–26 years with virological suppression on ART, those receiving 120,000 IU VitD3 monthly (equivalent of 4,000 IU daily) had significant decreases in percentage CD4+ and CD8+ activation (CD38+/HLA-DR+) and inflammatory monocytes (CD14+CD16+).
In contrast to previous studies in HIV-infected populations examing the effect of VitD supplementation on immune activation and senesence, our study provided VitD/Ca supplementation at the time of ART initiation. We observed decreases in T-cell activation and sTNFr from baseline to 48 weeks in both arms, however these changes are most likely related to virological suppression. Contrary to our hypothesis, we also observed that greater decreases in CD38+HLADR+ CD4+ and CD8+ T-cells were associated with greater decreaeses in BMD. Participants who experienced the greatest decreases in CD4+ and CD8+ T-cell activation started with high levels of CD4+ and CD8+ T-cells at baseline. While these data are not consistent with the theory that immune reconstitution mediates bone loss with ART initiation, we may have missed early immune changes that impact BMD, since we only evaluated cellular phenotypes at weeks 0 and 48. As for the role of VitD supplementation on immune phenotypes, it is very likely that the robust anti-inflammatory effects of ART initiation obscured our ability to observe any potential immunomodulatory effects of VitD.
We recognize that this study has several limitations. First, we collected samples at baseline, 24 and 48 weeks, but only measured cellular markers at baseline and 48 weeks. Some of the early changes could have been missed with this approach, as certain data suggest that the cytokine levels increase within the first few weeks after ART initiation [4]. Second, we did not evaluate changes in monocyte activation or phenotype, even though there are data suggesting that VitD supplementation affects monocytes. Third, we only characterized cellular markers, and did not perform any functional assays on the cells.
In conclusion, with ART initiation, reductions in markers of T- and B-cell activation were observed, which correlated modestly with bone loss. However, VitD/Ca supplementation does not appear to augment the immunomodulatory effects of ART on T- and B-cells, or mitigate bone loss through modulation of immune activation.
Footnotes
Acknowledgements
We wish to gratefully acknowledge all of the study sites and study participants who have devoted their time and effort to this research endeavor.
Research reported in this publication was supported by the National Institute of Allergy and Infectious Diseases of the National Institutes of Health under Award Number UM1 AI068634, UM1 AI068636 and UM1 AI106701 and supported by National Institute of Mental Health (NIMH), National Institute of Dental and Craniofacial Research (NIDCR). The content is solely the responsibility of the authors and does not necessarily represent the official views of the National Institute of Allergy and Infectious Diseases or the National Institutes of Health, Bristol-Myers Squibb and Gilead funded the DXA scans and ancillary laboratory testing. Study medications were provided by Bristol-Myers Squibb, Gilead Sciences and Tischcon Corporation.
This work was presented at the International AIDS Society Conference on 24–27 July 2018 in Amsterdam, the Netherlands. Abstract number TUPEB112. Trial registration number: NCT01403051.
The authors declare no competing interests.