
Abstract
Background
A unique chronic hepatitis B patient was followed over 189 months of nucleoside/nucleotide analogue (NA) therapies with the analysis of multiple drug-resistance HBV mutants.
Methods
Clonal sequencing (≥20 clones/sample) was performed on sera sampled at 41 time points, and the phenotypic features of eight representative mutants were analysed.
Results
Lamivudine (LAM)-, adefovir dipivoxil (ADV)-, entecavir (ETV)- and repeat ADV-resistance mutants emerged upon individual sequential NA monotherapy. The efficacy of NA combination rescue therapies ranked as LAM+ADV < ETV+ADV < ETV+ tenofovir disoproxil fumarate (TDF). Specifically, LAM+ADV and ETV+ADV suppressed viral loads to <100 IU/ml for a long period of time, either with or without late stage HBV DNA fluctuations. Furthermore, ETV+TDF suppressed the viral load to <10 IU/ml. During the LAM+ADV and ETV+ADV combination therapies, ETV-resistance mutants dominated at most time points, and multidrug-resistance (MDR) mutants that harboured LAM-, ETV- and ADV-resistance mutations were intermittently detected. Interestingly, the rtA181T-causative sW172stop to sW172non-stop mutation transition was observed at HBV DNA fluctuations. In a phenotypic analysis, two MDR strains had cross-resistance to LAM, ETV and ADV, and a lower susceptibility to TDF (<10-fold decrease compared with the wild-type strain). In contrast, the natural replication capacity was inversely associated with the number of primary resistant mutations which would limit MDR mutant development.
Conclusions
Taken together, viral drug susceptibility, replication capacity, and perhaps immunological adaptation may play coordinated roles in the fitness of drug-resistance mutants. ETV+TDF therapy is the preferred option for treating chronic hepatitis B patients with multiple drug failure.
Introduction
It has been estimated that around 292 million people are infected with chronic HBV worldwide, and of these individuals 86 million are in China [1]. Treatment of chronic HBV infection is aimed at suppressing viral replication to the lowest possible level in order to prevent disease progression [2]. Currently, five nucleoside/nucleotide analogues (NAs) are licensed to treat HBV infection in China, namely lamivudine (LAM), adefovir dipivoxil (ADV), entecavir (ETV), telbivudine (LdT) and tenofovir disoproxil fumarate (TDF), which was the latest to be approved (2014) in China and is relatively expensive.
Long-term NA treatment is associated with an increased risk of developing drug resistance due to mutations in the reverse transcriptase (RT) region of the HBV polymerase. Signature primary resistant mutations include rtM204I/V±L180M (LAMr) for LAM (rtM204I is also an LdT-resistance mutation), rtA181V/rtN236T for ADV, LAMr plus one of the substitutions (sub) at rtT184 (A/C/F/G/I/L/M/S), rtS202 (C/G/I) and/or rtM250 (I/L/V) for ETV [3,4]. Recently, two novel mutations, rtA186T and rtI163V, have been reported to account for ETV resistance in concurrence with LAMr [5]. In addition, an rtS78T/sC69 stop mutation has been reported as being selected under ETV+TDF pressure, and to be associated with an insufficient response to antiviral treatments [6]. We have also identified two mutations that respectively confer resistance to LAM and ADV [7,8]. So far, TDF-resistance mutation has not been recognized. Compared to ADV, TDF had similar 50% effective concentration (EC50) but 30-fold higher dose (300 mg/day versus 10 mg/day). As at least 2-fold increased EC50 is required for ADV resistance [3], it may be calculated that around 60-fold increased EC50 is required for TDF resistance.
Multidrug-resistance (MDR) HBV has multiple mutations co-located in the same viral genome that confer resistance to antiviral agents that have a complementary cross-resistance profile, such as the nucleoside analogue LAM and the nucleotide analogue ADV [9]. MDR HBV infections have been documented in some patients [9–15].
Antiviral efficacy can possibly be influenced by host-specific immunity. Six and ten HLA-A2-restricted cytotoxic T lymphocyte (CTL) epitopes have been identified, respectively, in the HBV RT and S regions [16]. Some drug-resistance-associated mutations in the RT region may introduce nonsynonymous mutations in the overlapping S region; rtA181T is such a mutation [17]. So far, it is not fully understood how MDR HBV develops, and how the CTL response is influenced by HBV mutations under long-term NA antiviral pressure.
In this study, we have successfully extended our knowledge of these issues through an in-depth analysis of genotypic evolution, and the phenotypic features of multiple HBV drug-resistance mutants, as well as relevant S-region variants, in a single patient who received long-term diverse antiviral therapies.
Methods
Patient
The patient was a 38-year-old Chinese male patient with chronic hepatitis B (CHB) at his first admittance to Beijing 302 Hospital who received NA therapy in June 2002. The first half (94 months) of the patient's course has been described previously [13]. Briefly, the patient was infected with genotype C HBV. NA therapy was administrated with LAM in June 2002, switched to ADV in March 2005, switched to ETV in May 2006, switched back to ADV in March 2007 and changed to LAM+ADV in October 2008 due to resistance to sequential monotherapies. The combination therapy decreased the HBV DNA levels to undetectable levels (<100 IU/ml) with a normalization of alanine aminotransferase (ALT) up until April 2010, the end of the 94-month observation. In addition to NA treatment, the patient received twice interferon-α2b treatments (one for 10 months and another for 6 months) and gave up due to side effects. In this study, the patient was continuously followed-up for the second half (95 months) of illness, up until March 2018. During this period, the NA therapy was changed twice, that is, from LAM+ADV to ETV+ADV in January 2013, and then to ETV+TDF in June 2017. The patient's informed consent was obtained, and the study was approved by the Ethics Committee of Beijing 302 Hospital.
Serological markers, quantitation of HBV DNA and human leukocyte antigen (HLA)-A2 typing
Biochemical and serological markers and the HBV DNA levels of the patient were regularly measured in the Central Clinical Laboratory of Beijing 302 Hospital. The HBV DNA level was determined using a real-time quantitative PCR kit (Fosun Pharmaceutical Co., Ltd, Shanghai, China) with a lower limit of detection (LLOD) of 100 IU/ml before April 2012 and 40 IU/ml afterwards. HLA-A2 type was determined by flow cytometry analysis of peripheral blood mononuclear cells stained with FITC-labelled anti-HLA-A2 (BD Biosciences, Franklin Lakes, NJ, USA). HLA-A2 subtype was determined by sequence analysis as described in Chinese patent 201010258763-Method for HLA genotyping by using serum trace genome DNA. In brief, trace genomic DNA was extracted from 100 ml serum and then subjected to a nested PCR. The HLA-A genetic region was amplified in the first-round PCR, and the product was used as amplification template of the second-round PCR in which HLA-A2, A11 and A24 genetic regions were independently amplified. The three HLA-A2 genotypes were determined by 2% agarose gel electrophoresis. The subtype of the individual HLA-A genotypes was determined by direct sequence analysis of the product from the second-round PCR. The primers used are shown in Additional file 1.
HBV Genotypic Resistance Analysis and Phylogenetic Tree Analysis
The methods used for HBV genotypic resistance analysis and phylogenetic tree analysis have been described previously [14,15]. In brief, a 1225-bp-long HBV gene fragment (nucleotide [nt] 54–1278) that covers the full-length RT gene (nt 130–1161) and overlapping S gene (nt 155–835) were amplified from serum HBV DNA using a one-tube nested PCR method (with a 10 IU/ml LLOD at an input of 200 ml serum).
The sense and antisense primers for the first-round PCR were 5'-AGTCAGGAAGACAGCCTACTCC-3’ (RTUP3, nt 3146-3167) and 5'-AGGTGAAGCGAA-GTGCACAC-3’ (SB1R, nt 1577-1596), respectively. The sense and antisense primers for the second-round PCR were 5'-TTCCTGCTGGT-GGCTCCAGTTC-3’ (RTUP4, nt 54-75) and 5'-TTCCGCAGTAT-GGATCG-GCAG-3’ (SB2R, nt 1258-1278). Clonal sequencing of the RT gene was performed using the TA cloning strategy (≥20 clones/sample). The viral strain is named as ‘S plus two numbers’, in which the first number represents sampling time point and the second number represents viral clone number at this sampling time point. The phylogenetic tree analysis was performed using MEGA-7 software (IGEM, Temple, PA, USA).
Assessment of viral replication capacity and drug susceptibility
Amplicons containing the 1.1 mer genotype C HBV genome were constructed for phenotypic analysis and were performed based on a previously described method [18,19]. Phenotypic analyses for natural viral replication capacity and drug susceptibility were performed as previously described [7,8]. The mutant and wild-type HBV genomic amplicons were transiently transfected into HepG2 cells and cultured in the presence or absence of NAs. Transfection was carried out using the X-tremeGENE HP DNA transfection reagent (Roche, Mannheim, Germany) and transfection efficiency was normalized using a β-galactosidase reporter plasmid (Promega, Madison, WI, USA). At 5 h post-transfection, new medium containing serially diluted NAs was added, and the medium was replaced every other day. The concentrations for the analysis of viral susceptibility to a single drug were 0, 0.01, 0.1, 1.0, 10 and 100 μmol/l for LAM and TDF; 0, 0.1, 0.33, 1.0, 3.3 and 10.0 μmol/l for ADV; and 0, 0.001, 0.01, 0.1, 1.0 and 10 μmol/l for ETV. For analysis of viral susceptibility to two drug combinations, the corresponding pairs of serially diluted concentrations of each drug were conjunctively used. For example, LAM+ADV were 0+0, 0.01+0.10, 0.10+0.33, 1.0+1.0, 10.0+3.3 and 100.0+10.0 μmol/l. After 4 days of culture, the cells were harvested and lysed. Viral core particles were immunoprecipitated using an anti-HBc/protein A+G complex, and HBV replicative intermediates in the core particle were released and quantitated by real-time PCR. Drug susceptibility was determined by comparing EC50 of the drug for the mutants to that for the wild-type. All experiments were performed independently at least three times. In addition, the PCR-based assay, a Southern blotting-based assay was performed to determine viral replication capacity in the laboratory of the Institute of Virology, University Hospital of Essen, according to a previously described method [20].
Statistical analysis
Data are presented as the mean ± standard deviation or the median (range). Differences between variables were examined by Student's t-test. Statistical analysis was carried out using the Statistical Program for Social Sciences (SPSS 18.0 for Windows; SPSS Inc., Chicago, IL, USA). A P-value of <0.05 (two-tailed) was considered statistically significant.
Results
Clinical responses during the course of antiviral therapies and the evolution of HBV drug-resistance mutants
NA treatment for the patient was initiated on June 2002 and lasted for 189 months by the end of the observation period. The antiviral schedule comprised sequentially of 33 months of LAM monotherapy, 14 months of ADV monotherapy, 10 months of ETV monotherapy, 19 months of further ADV monotherapy, 51 months of LAM+ADV combination therapy, 53 months of ETV+ADV combination therapy and 9 months of ETV+TDF combination therapy.
The dynamic changes in the clinical responses and the HBV drug-resistance mutants are shown in Figure 1. The dynamic changes from baseline to month 94 of antiviral therapies, which included 22 sampling time points (S1-S22), have been described previously [13], and are recapitulated in the Methods. After this period, the patient was maintained on LAM+ADV combination therapy which started in October 2008 (S19) up until January 2013 (S29). During this period, the HBV DNA level was maintained at a low level (<100 IU/ml) for most of the time, but fluctuated twice, that is, increased from <100 IU/ml to 7.21 x 10 2 IU/ml in November 2011 (S26) and to 1.31x10 3 IU/ml in January 2013 (S29). A clonal sequence analysis showed that drug-resistance mutants were continuously present in the viral pools during LAM+ADV therapy. Specifically, ETV-resistance mutants were found to be present most of the time during treatment. However, the ADV-resistance mutant rtA181T+N236T became dominant at the time of the obvious fluctuations in HBV DNA (that is, S26 and S29). MDR strains were intermittently detected at S20, S25 and S28. The mutational patterns included rtL180M+A181V+S202G+M204V+N236T and rtL180M+S202G+M204V+N236T
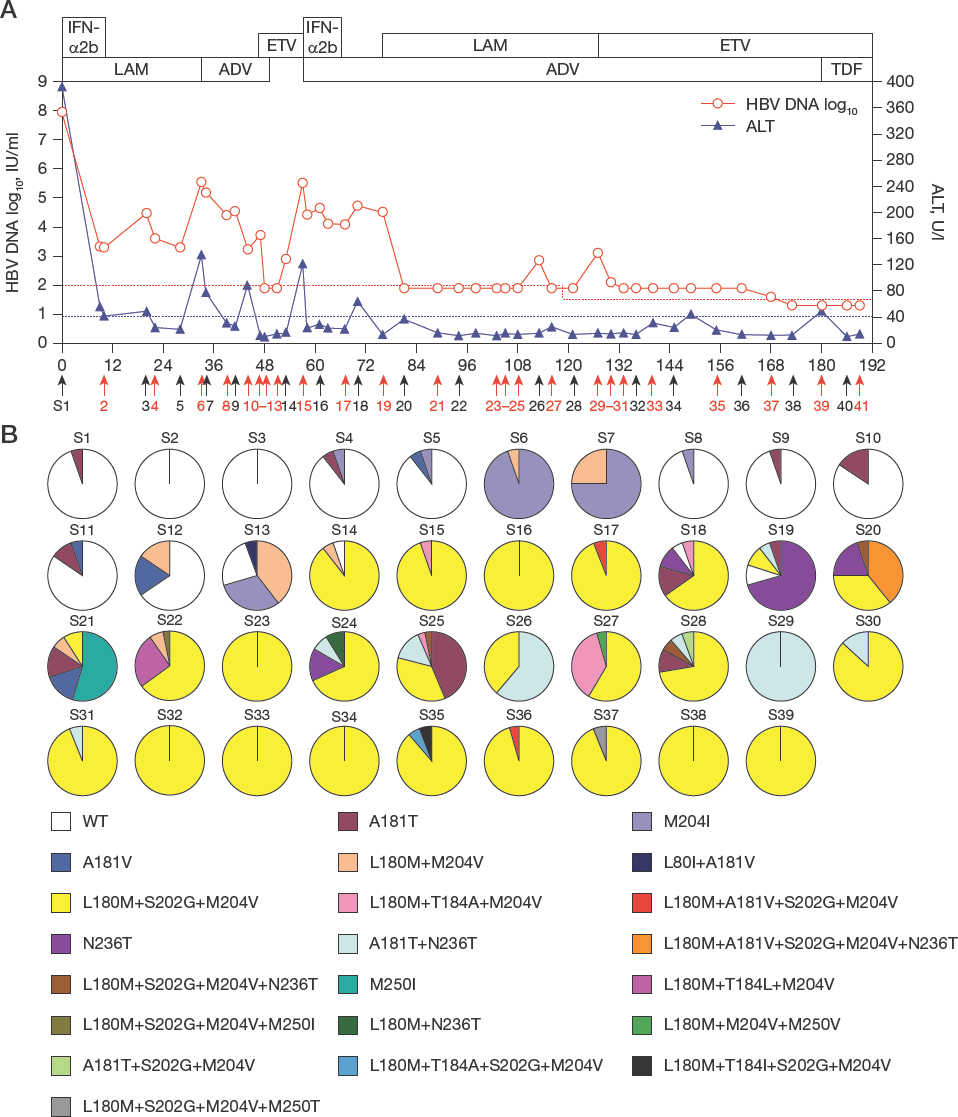
The dynamic changes in the serum viral load and ALT levels and the evolution of drug-resistance and multidrug-resistance HBV strains during the course of different nucleoside and nucleotide analogue antiviral therapy
In light of the clinical response with viral resistance, the therapy was changed to an ETV+ADV combination in January 2013. As a result, HBV DNA was decreased to an undetectable level following regular clinical testing (<40 IU/ml), and there were no fluctuations in levels noted. The ALT levels basically remained in the normal range (≤40 U/l) with the exception of a slight increase that was observed twice (44 U/l in November 2014 and 49 U/l in June 2017). A clonal sequence analysis showed that the ETV-resistance mutant rtL180M+S202G+M204V was persistently present during treatment, and an MDR strain (rtL180M+A181V+S202G+M204V) was detected at one time point (S36), and three other ETV-resistance strains were found at two time points (S35 and S37) during this period.
In June 2017, the antiviral therapy was changed to ETV+TDF. Following this change, the virus was undetectable by both HBV DNA quantitation and sequence analysis, and remained so up until March 2018, the end of observation.
HLA-A2 Typing and Subtyping
The HLA allele of the patient was identified as HLA-A2 (A*0206 subtype).
Longitudinal analysis of the amino acid changes in the RT and S regions
The influence of RT-region mutations on S-region mutations (especial for rtA181T mutation) was paid special attention in this analysis. A sequence comparison of the major amino acid (aa) changes in 100 viral strains of interest obtained from 22 sampling time points during long-term anti-HBV treatment of the patient is shown in Table 1. These include 14 representative wild-type strains from the individual time points, all 82 tested rtA181T and rtA181T+N236T strains from the individual time points, and four representative rtL180M+S202G+M204V strains from the four time points where therapies were changed or ended (that is, at the beginning of ETV, LAM+ADV, ETV+ADV and at the end of ETV+ADV). With respect to the major aa changes in the S-region, all of the rtA181T+N236T strains introduced an sW172stop prior to S26 (S19, S24 and S25), but introduced an sW172non-stop mutation (sW172/L or sW172S) at, and after, S26 (that is, S26 and S28-31). Simultaneously, the dominant sI126 changed overwhelmingly to sT126. In addition, most of the rtA181T+N236T strains prior to S29 (S19, S24-26, and S29) harboured sL61, but this became sS61 at, and after, S29 (S29-31). Moreover, sA45 and sR79 were overwhelmingly found the in rtA181T+N236T strains prior to S28, whereas sV45 and sH79 were found in these positions in some of the rtA181T+N236T strains at, and after, S28.
Major S-region amino acid changes of interesting viral strains during long-term antiviral therapies a
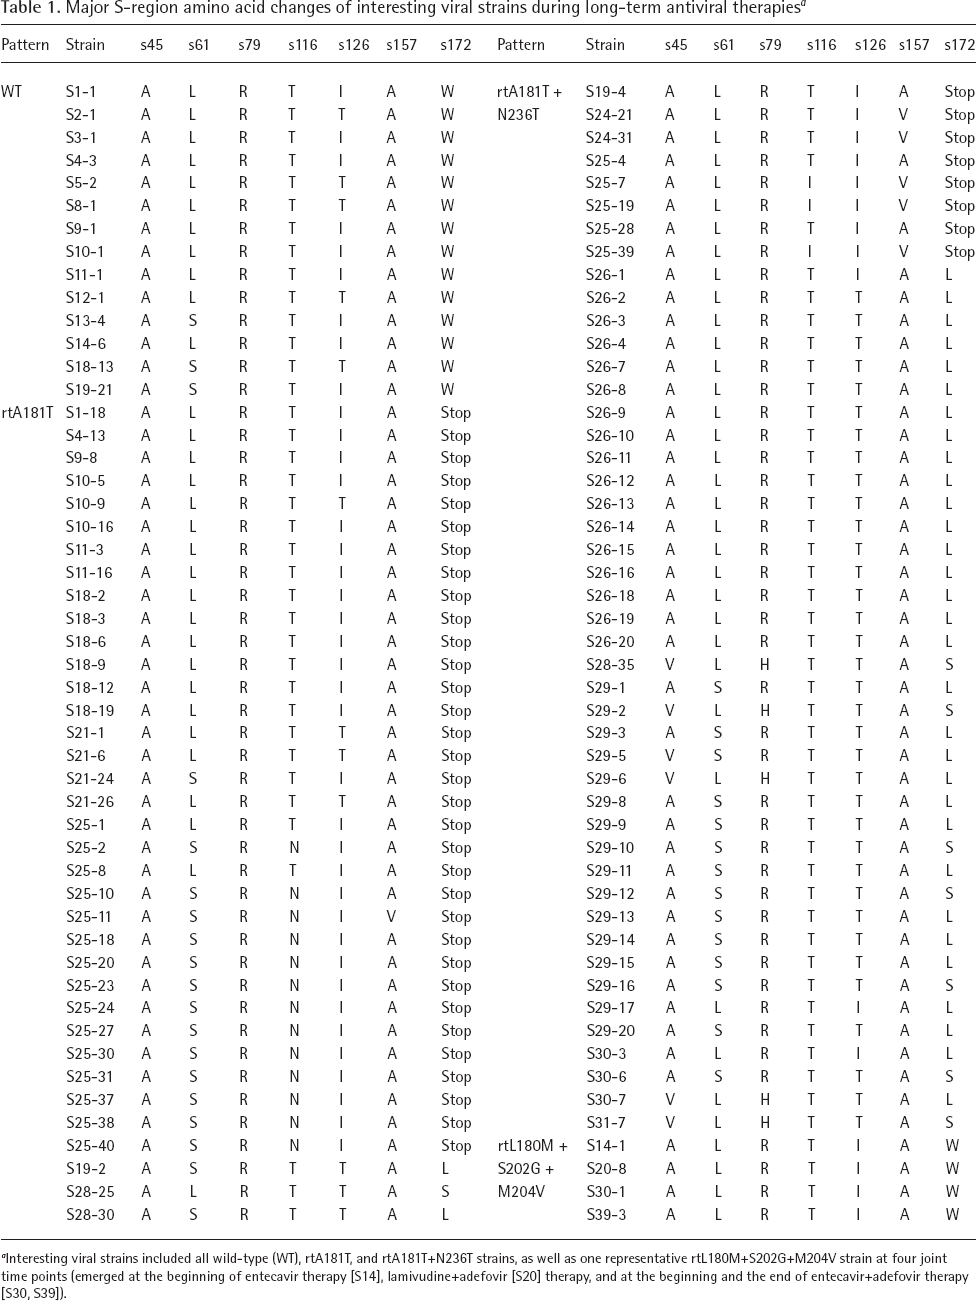
Interesting viral strains included all wild-type (WT), rtA181T, and rtA181T+N236T strains, as well as one representative rtL180M+S202G+M204V strain at four joint time points (emerged at the beginning of entecavir therapy [S14], lamivudine+adefovir [S20] therapy, and at the beginning and the end of entecavir+adefovir therapy [S30, S39]).
Phylogenetic tree analysis
A phylogenetic tree analysis of the 97 cloned HBV RT gene sequences was performed. The 97 sequences comprised each kind of viral strain(s) from every sampling time point. The MDR HBV strains and the rtA181T-causative s172 mutation strains were paid special attention (marked in red and blue, respectively). As shown in Figure 2, a molecular evolution analysis showed that the virus sequences tended to cluster in relationship to the type of drug-resistance mutation; the MDR strains were all found adjacent to the ETV-resistance mutants and were scattered on neighbouring branches.

Phylogenetic tree analysis for 97 representative HBV reverse transcriptase gene sequences
Replication capacity of the representative HBV strains in the absence of drug
The wild-type strain derived from baseline and eight representative resistance strains obtained during the different antiviral therapies were selected for an analysis of their replicative capacity in the absence of drug. The resistance mutant strains included M204I (M1), rtL180M+M204V (M2), rtL180M+S202G+M204V (M3), rtL180M+A181V+S202G+M204V (M4), rtL180M+T184A+M204V (M5), rtN236T (M6), rtL180M+A181V+S202G+M204V+N236T (M7) and rtL180M+S202G+M204V+N236T (M8). The results using an efficient PCR-based assay that could quantitate HBV intermediates in the viral core particles are shown in Figure 3A. Specifically, M7 that harboured four primary resistance mutations had the lowest replicative capacity (3% of the wild-type); M8 and M4, which both harboured three primary resistance mutations, had 14% and 22% of the replicative capacity of the wild-type, respectively; M5 and M3, which harboured two primary resistance mutations, had 43% and 53% of the replicative capacity of the wild-type, respectively; and M1, M2 and M6, which harboured a single primary resistance mutation, had 59%, 75% and 76% of the replicative capacity of the wild-type, respectively. Results consistent with these were obtained using a traditional Southern blotting-based assay (Figure 3B). The relative intensities of the mutants to wild-type (taken as 1.0) were 0.76 (M1), 0.85 (M2), 0.66 (M3), 0.21 (M4), 0.42 (M5), 0.85 (M6), 0.02 (M7) and 0.08 (M8).

Analysis of the replication capacities of the WT HBV strain and the eight resistant HBV strains with different mutations in the RT region
Drug susceptibility of two representative MDR mutants
The susceptibility of the MDR mutants M4 (rtL180M+ A181V+S202G+M204V) and M8 (rtL180M+S202G+ M204V+N236T) to LAM, ADV, ETV and TDF was compared to that of the wild-type virus in HepG2 cells. The data showed that the M4 and M8 mutants were resistant to LAM, ADV and ETV, and less susceptible to TDF. For two MDR strains, but not for the wild-type strain, NA combinations clearly decreased each drug's EC50 (Table 2).
Drug susceptibility of two MDR mutants compared with the wild-type strain

ADV, adefovir; EC50, 50% effective concentration; ETV, entecavir; LAM, lamivudine; NA, nucleoside/nucleotide analogue; TDF, tenofovir disoproxil fumarate.
Discussion
The unique case came from analysis of a large number of patients in clinical practice and provided rich novel information as follows. Suboptimal response to sequential mono and combination NA therapies facilitated MDR HBV development. HBV replication capacity was inversely related to resistance mutation number, which limited MDR mutant propagation because selection of an HBV mutant mainly depends on viral replication fitness [21]. The two MDR strains had multiple resistances to LAM, ADV and ETV, and <10-fold reduction in TDF susceptibility, which was insufficient to cause TDF resistance in clinic. For two MDR strains, but not for the wild-type strain, NA combinations clearly decreased each drug's EC50. Efficacy order of NA combination rescue therapies was LAM+ADV < ETV+ADV < ETV+TDF for the patient with multiple drug failure.
Although ultra-deep pyrosequencing is more efficient at detecting minor resistant HBV strains [22], a clonal sequencing strategy was adopted in this study for its advantages: able to distinguish whether multiple resistance mutations are located in the same viral genome; able to directly obtain the viral genes for amplicon construction when needed; and able to more sensitively detect RT/S gene sequences with an LLOD of 10 IU/ml. The sensitivity of the assay is critical as replication-defective MDR strains usually emerged in viral pool at low viral load.
The inadequate viral suppression observed during the LAM+ADV and ETV+ADV therapies was mainly due to the relatively weak potency of low-dose ADV because switching to high-dose TDF suppressed the HBV DNA to undetectable levels soon after for the patient, and this was supported by previous clinical evidence [23]. Since the HBV genome mutations could be archived in the covalently closed circular DNA (cccDNA) pool and so escape from the direct impact of NAs [24], the suppressed drug-resistance mutants likely re-emerged from the recall of the mutants in the cccDNA pool when the rescue antiviral therapy with combination NAs contained an NA for which resistance had previously arisen. In addition to resistance mutation in HBV RT region, poor response to entecavir of CHB patient was reported to be conditioned by variability of CTL epitopes in HBV S region [25]. In this studied patient, both LAM+ADV and ETV+ADV therapies were administrated for a long period of time with inadequate suppression of HBV resistance mutants, which offered us a rare opportunity to analyse viral immunological adaptation with drug-resistance mutations. As shown in Table 1, seven aa changes in the S-region were identified in the alignment comparison. Four of these were located in known HLA-A2-restricted HBV-specific CTL epitopes, that is, sA45V in epitope s41-49, sT116I in epitope s108-117, sA157V in epitope s150-158 and sW172*/L/S in epitope s172-180 [16]. These S-region aa changes were not concomitant with aa changes in the corresponding positions of the overlapping RT region, suggesting that they were potentially selected by immune pressure rather than by drug pressure.
The rtA181T+N236T mutant was intermittently detected at S19, S24, S25, S26, S28 and S29 during LAM+ADV therapy, and at S30 and S31 during subsequent ETV+ADV therapy. Interestingly, a re-emergence of rtA181T+N236T mutant was linked with HBV DNA fluctuation at S26 and subsequent slight ALT fluctuation at S27 (Figure 1), with a conversion of sW172stop to sW172L for all rtA181T+N236T mutants, suggesting that the T-cell response might be involved (Table 1). Unlike sW172stop mutation, sW172non-stop mutation maintains the s172-180 (env335-343) epitope, an epitope frequently detected in Chinese patients with acute hepatitis B. Therefore, it is proposed that this sW172stop to non-stop conversion would on the one hand be favourable for viral replication capacity, on the other hand elicit an epitope-specific CTL response that was subsequently unfavourable for viral fitness. A similar phenomenon was observed for the HBV cL60V variation which not only enhanced viral replication, but also elicited a new CTL-specific epitope [26]. In addition, combined aa changes might have clinical relevance. Among the rtA181T+N236T mutant sequences, the sA45-L61-R79 pattern was overwhelmingly found at S19, S24, S25 and S26, but the pattern switched to sV45-L61-H79 at S28, and then switched to the dominant pattern of sA45-S61-R79 at S29 with HBV DNA fluctuations. These together suggested that HBV immunological adaptation via S-region CTL epitopic change might be related to clinical response during long-term NA treatment.
In summary, viral drug susceptibility, replication capacity, and perhaps immunological adaptation, may play coordinated roles for the fitness of drug-resistance mutants. ETV+TDF therapy is the preferred option for treating chronic hepatitis B patients with multiple drug failure. This study provides new insights on HBV drug resistance with clinical implications of the resistance management.
Footnotes
Acknowledgements
This work was supported by National Natural Science Foundation of China (81721002, 81573676, 81371852), and the Deutsche Forschungsgemeinschaft (DFG Transregio TRR60). The funders had no role in study design, data collection and analysis, decision to publish, or preparation of the manuscript.
All authors declare that they have no competing interests.