
Abstract
Background
Residual renal function (RRF) affects sodium and fluid balance. The aim of this analysis was to examine the impact of RRF on the effect of a sodium-reduced peritoneal dialysis fluid (PDF) on blood pressure (BP).
Methods
This is a post-hoc analysis of a prospective, randomized, controlled double-blind clinical trial with 82 patients on continuous ambulatory PD (CAPD) treated with a low-sodium (125 mmol/L Na) or a standard-sodium (134 mmol/L Na) PDF. Subgroups according to glomerular filtration rate (GFR) at baseline (≤ / > 6 mL/min/1.73 m2) were analyzed for BP and antihypertensive medication.
Results
In the low-GFR group on low-sodium PDF (N = 26), systolic BP was reduced from 152 ± 24 mmHg at baseline to 137 ± 21 mmHg at week 12, diastolic BP from 90 ± 16 mmHg to 83 ± 11 mmHg. In the low-GFR group on standard-sodium PDF and in the high-GFR group on both PDF types, only minor changes were observed. For the low-GFR subgroup, the confounder-adjusted mean study group difference in systolic BP at week 12 between low-sodium and standard-sodium PDF was -16.9 (95% confidence interval [CI] -27.2 to -6.6) mmHg, for diastolic BP, it was -7.0 (95% CI -12.6 to -1.4) mmHg. In both GFR subgroups, more patients had a reduced daily dose of antihypertensive medication and fewer patients an increased daily dose in the low-sodium compared with the standard-sodium group at week 12.
Conclusions
The reduction of BP with a sodium-reduced PDF seems to be more effective in patients with no or low RRF than in patients with residual capacity of renal sodium and fluid control.
Volume homeostasis is an important parameter of adequate treatment, and fluid overload a predictor of outcome in peritoneal dialysis (PD) (3). Because volume retention is driven by salt retention, maintenance of salt balance should be a major concern, particularly as sodium and volume status play an essential role in blood pressure (BP) regulation (4). Sodium removal by PD across the peritoneal membrane can happen by convection with osmosis-driven ultrafiltration (UF), and by diffusion, the extent of the latter depending on the difference between dialy-sate and plasma-sodium concentrations. This difference is only small when standard PD solutions with a sodium concentration of 132 – 134 mmol/L are applied. Therefore, convective clearance is usually more substantial than diffusive clearance (5–7). Moreover, in certain PD treatment schedules, sodium sieving, i.e. overproportional water elimination through ultrasmall pores, namely aquaporins, may limit sodium elimination even more (5). The resulting risk of fluid overload and hypertension is reflected in data from epidemiological studies, quantifying the proportion of hypertensive PD patients or patients on anti-hypertensive medication at more than 80% (6,8).
To also enhance diffusive sodium elimination, a PD solution with a reduced sodium content of 125 mmol/L has been developed and investigated in a prospective, randomized, double-blind clinical study (9). Patients in this study were prevalent on continuous ambulatory PD (CAPD) and had a glomerular filtration rate (GFR) from 0 to 35 mL/min/1.73 m2, approximately 25% of patients had GFR > 6 mL/min/1.73 m2 at enrolment in the study. Blood pressure, a secondary aim of this study, showed a trend of improvement in the low-sodium arm.
The analysis of the subgroups with GFR ≤ / > 6 mL/min/ 1.73 m2, as performed for the primary endpoint (total Kt/V) (9) was extended to the present interaction analysis. This investigates whether the extent of RRF has an impact on the effect of a low-sodium PD fluid (PDF) on BP control.
Patients and Methods
Study Design and Patients
This is a post-hoc analysis of a prospective, controlled, randomized, double-blind, multicenter phase III study comparing a low-sodium PD solution containing 125 mmol/L Na with a standard-sodium PD solution with 134 mmol/L Na (both with glucose as osmotic agent, Fresenius Medical Care, Bad Homburg, Germany).
The study enrolled adult patients on CAPD for at least 3 months, treated with standard-sodium solution for at least 4 weeks prior to inclusion, and receiving at least 1 antihypertensive drug (including diuretics), or showing an office systolic blood pressure (SBP) of ≥ 130 mmHg. Patients prone to hyponatremia and experiencing peritonitis within < 4 weeks prior to study start were excluded. Randomization was centrally performed via a 1:1 block randomization and was stratified by center (9). No further stratification was done at randomization.
The study had been approved by the competent authorities of the participating countries and the institutional review boards of the study centers. Informed consent was obtained from each patient prior to inclusion. The study was registered at EU Clinical Trials Register (2004–002108–14).
Treatment Intervention
After inclusion, patients were randomized to receive CAPD treatment with either the low-sodium (125 mmol/L Na) or the standard-sodium solution (134 mmol/L Na) for all bags of the day over 6 months. At first, a baseline visit was performed. Immediately after this, study medication was started. Further study visits 2, 6, 12, 18 ± 1, and 25 ± 1 weeks after baseline were performed.
Assessment of Blood Pressure and Antihypertensive Medication
Blood pressure measurements were performed on all study visits in seated position after 5 minutes of rest, at the same arm, and repeated after 5 minutes, using a digital BP device (Omron OMRON M5-I, or HEM-757, Vernon Hills, IL, USA).
The dosing of antihypertensive drugs was based on the defined daily dose (DDD) prescribed at the respective visit (extracted from the Anatomical Therapeutic Chemical (ATC)/ DDD system). One DDD unit reflects the assumed average maintenance dose per day for a drug used for its main indication. Combination drugs without a DDD were split into their components. Based on the difference in DDD from baseline to week 12, we built a categorized variable “Change in antihypertensive medication” to differentiate between patients whose DDD increased, remained unchanged, or increased.
Laboratory Assessments
Laboratory analyses were performed decentrally at the study sites’ clinical laboratories, except for brain natriuretic peptide (BNP, determined as NT-proBNP), which was measured centrally by enhanced chemiluminescence assay (ECLIA, Roche Diagnostics, Mannheim, Germany).
Study Aim
The objective of the trial was to assess efficacy (primary objective: non-inferiority of the low-sodium PD solution in comparison with the standard-sodium solution regarding Kt/Vurea) and safety of the low-sodium PDF. Among various secondary efficacy measures, BP and antihypertensive medication were analyzed.
Since the analysis of the primary parameter by GFR subgroup revealed an influence of RRF (9), this interaction analysis was extended. The aim of the present post-hoc analysis was to investigate whether the effect of the low-sodium solution on BP at week 12 differs depending on RRF being higher or lower than 6 mL/min/1.73 m2, a threshold for starting dialysis according to the European best practice guideline for PD (10).
Statistical Analysis
The initial analysis of this study was performed on the per-protocol (PP) population following recommendations by regulatory guidance for non-inferiority trials. For comparability reasons, the present post-hoc analysis was performed as well on the PP population and using BP and other parameters assessed at week 12. A dichotomous variable “GFR subgroup” was built to distinguish between PP patients with low vs high GFR at baseline (≤ or > 6 mL/min/1.73 m2). The GFR was calculated as the mean of urea and creatinine clearance, which were determined from urine volume and urine and plasma urea and creatinine concentrations.
Descriptive Analyses
Descriptive analyses were performed for baseline characterization of study groups and to describe the distribution of systolic BP (SBP) and diastolic BP (DBP) and parameters of fluid and sodium balance at week 0 (baseline) and week 12 (time of outcome assessment).
Interaction Analysis
Linear mixed models were applied to estimate the effect of a low-sodium PDF on SBP and DBP and on other parameters in the 2 GFR subgroups and to investigate the potential interaction between GFR subgroup and study group (low sodium vs standard sodium), i.e., whether the effect of sodium-reduced PDF on the respective endpoint differs depending on GFR subgroup. For each endpoint, we first estimated a full model with fixed effects for baseline level (e.g., SBP at week 0), study group (low sodium vs standard sodium), GFR subgroup (low vs high baseline value according to ≤ vs > 6 mL/min/1.73 m2), GFR subgroup x study group interaction and country as well as a random center effect to account for clustering of patients within study centers. In cases where exclusion of the 3 dummy variables for the fixed effect country yielded a lower Akaike Information Criterion (AIC) value, we selected this reduced model for the respective endpoint.
Fulfillment of assumptions underlying the linear model was examined by means of residual and influence diagnostics. To ensure homoscedasticity and normal distribution of residuals, 2 endpoints (24-h urine removal and BNP) had to be modeled on the log-scale (for 24-h urine removal it was considered necessary to apply an offset of 1 prior to log-transformation). In case of highly influential observations (absolute values of Cook's Distance and DFFITs > 0.5 and > 1, respectively), sensitivity analyses were performed after elimination of the affected observations.
For all endpoints and both GFR subgroups, we report the least squares (LS) mean difference estimates (with 95% confidence interval [CI]) between study groups (low sodium vs standard sodium), which are the confounder-adjusted estimates for the effects of low-sodium PDF in the 2 GFR subgroups.
For SBP and DBP, we additionally report the regression weight for the GFR subgroup x study group interaction term, bˆInteraction, which is the estimate for the difference in the effect of low sodium vs standard sodium between the 2 GFR subgroups. The p values of the associated significance tests (H0: bInteraction = 0; H1: bInteraction ≠ 0) are reported as well. The 2 significance tests of interaction effects on systolic and diastolic BP, as well as estimation of CIs for mean differences between study groups for the different endpoints, were performed at an unadjusted 2–sided alpha level of 5%. We did not adjust for multiple testing due to the explorative nature of this study. These “descriptive” significance tests are intended to guide generating hypotheses. All analyses were performed using SAS version 9.4 (SAS Institute, Cary, NC, USA).
Results
Patients
Of the analysis population (82 patients), 40 patients were treated in the low-sodium and 42 in the standard-sodium group. Out of 40 patients in the low-sodium group, 26 were allocated to the subgroup with GFR ≤ 6 mL/min/1.73 m2, and 14 patients to the subgroup with GFR > 6 mL/min/1.73 m2; in the standard-sodium group the 2 subgroups consisted of 26 and 16 patients, respectively (Figure 1). Table 1 shows the patient characteristics at baseline in the 2 GFR subgroups. Expectedly, the low-GFR group was characterized by longer time on CAPD, lower mean residual diuresis, and higher daily UF. Also baseline SBP and DBP were higher in this subgroup than in the high-GFR subgroup. Dosage of antihypertensive medication was higher in the high-GFR compared with the low-GFR subgroup.
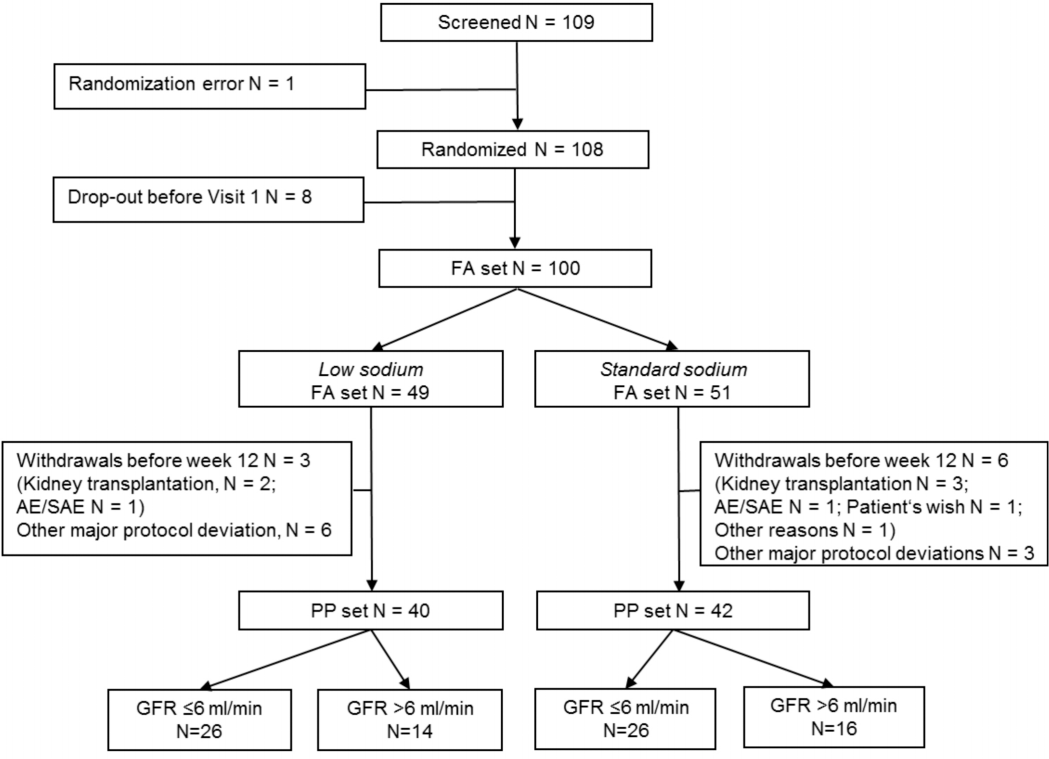
Patient flow in the study and formation of subgroups. FA = full analysis; PP = per protocol; (S)AE = (serious) adverse event; GFR = glomerular filtration rate.
Patient Characteristics at Baseline Overall and by GFR Subgroupa
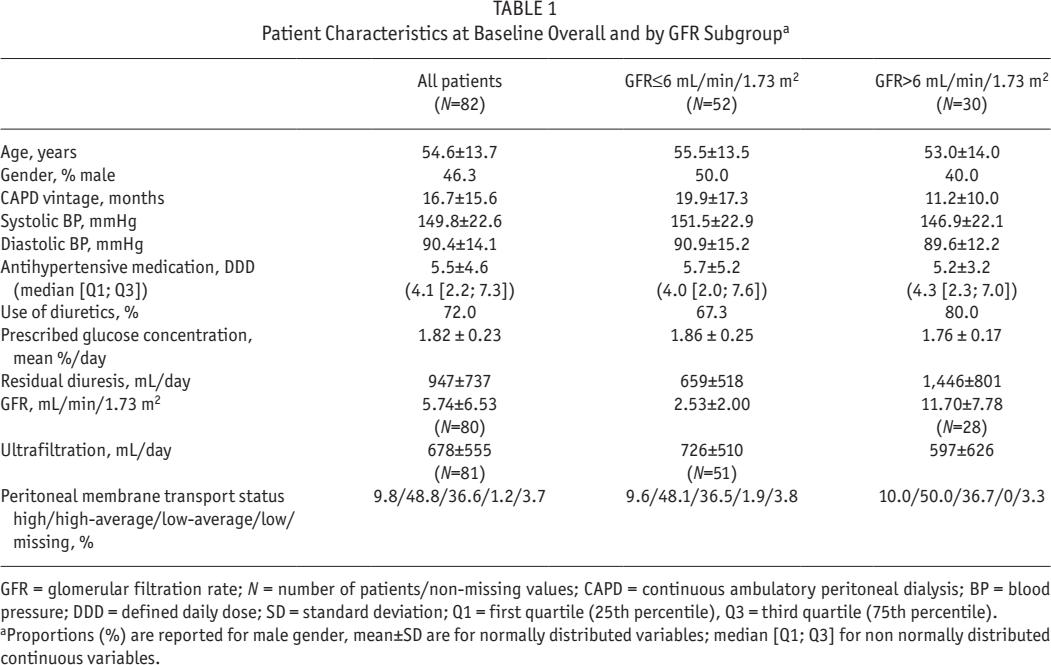
GFR = glomerular filtration rate; N = number of patients/non-missing values; CAPD = continuous ambulatory peritoneal dialysis; BP = blood pressure; DDD = defined daily dose; SD = standard deviation; Q1 = first quartile (25th percentile), Q3 = third quartile (75th percentile). Proportions (%) are reported for male gender, mean±SD are for normally distributed variables; median [Q1; Q3] for non normally distributed continuous variables.
Effect on Blood Pressure
In the low-GFR subgroup, SBP and DBP decreased in the low-sodium group, whereas with the standard-sodium solution there was practically no change of BP from baseline to week 12 (Table 2). Mean SBP decreased in the low-sodium arm from 152 ± 24 to 137 ± 21 mmHg.
Systolic and Diastolic Blood Pressure (Descriptive Analysis)
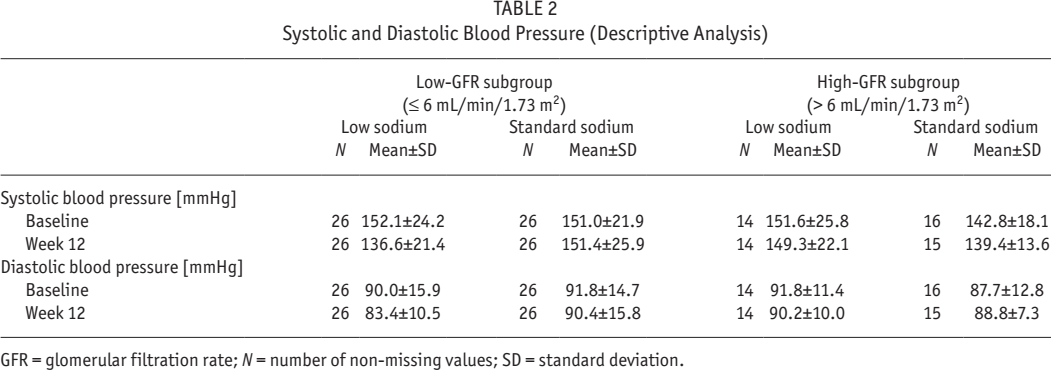
GFR = glomerular filtration rate; N = number of non-missing values; SD = standard deviation.
In the high-GFR subgroup, SBP and DBP changed only marginally irrespective of the sodium content of the PD solution. The results of the linear mixed models confirm these trends. Figure 2 shows the estimated LS mean group differences and 95% CIs for SBP and DBP at week 12, estimated for each of the 2 GFR subgroups and also adjusted for baseline values and country.
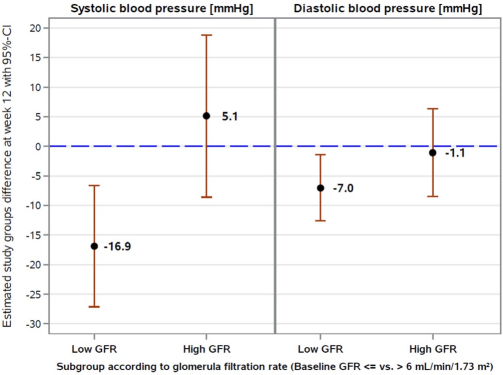
Confounder-adjusted estimates for the effects of sodium-reduced PD fluid on systolic and diastolic blood pressure at week 12 in the 2 GFR subgroups: Least square mean group difference estimates (low sodium vs standard sodium) with associated 95% confidence intervals from a linear mixed model with a random center effect.* PD = peritoneal dialysis; GFR = glomerular filtration rate; CI = confidence interval. * Estimation of effects of sodium-reduced PD solution on systolic and diastolic blood pressure in the 2 GFR subgroups was performed based on the main effect of study group (low vs standard sodium) and the GFR subgroup x study group interaction effect, which were adjusted for baseline levels, country, and GFR subgroup. Least square mean difference values < 0 indicate a lower mean (systolic/diastolic) blood pressure at week 12 in the low sodium than in the standard sodium study group. A sensitivity analysis on diastolic blood pressure excluded 2 highly influential observations and yielded a least square mean study group difference of -4.6 (95% CI: -10.1 to 0.9) mmHg in the low-GFR subgroup and of -1.5 (95% CI: -8.5 to 5.5) mmHg in the high-GFR subgroup.
In the low-GFR subgroup, the LS mean difference in SBP at week 12 between study groups was estimated to be -16.9 [-27.2; -6.6] mmHg. This difference between study groups reaches statistical significance. In addition, the DBP was found to be significantly reduced at week 12 under low-sodium compared with standard-sodium treatment (-7.0 [-12.6; -1.4] mmHg). In the high-GFR subgroup, LS mean difference estimates between study groups for SBP and DBP were 5.1 [-8.6; 18.9] mmHg and -1.1 [-8.5; 6.4] mmHg, respectively, and not statistically different from 0.
The GFR subgroup x study group interaction effect on SBP was estimated as bˆInteraction = 22.0 (standard error [SE] = 8.6) mmHg and statistically different from 0 (p = 0.01). It may hence be concluded that the effect of sodium-reduced PD fluid on SBP at week 12 significantly differs dependent on low- vs high-baseline GFR. With regard to DBP, the estimate for the interaction between GFR subgroup and study group was smaller (bˆInteraction = -6.0 mmHg; SE = 4.6) and not statistically different from 0 (p = 0.2) in this post-hoc analysis.
A sensitivity analysis performed on DBP after excluding 2 highly influential observations yielded qualitatively similar results; the LS mean difference between study groups was a little smaller (-4.6 mmHg) but just missed statistical significance (95% CI: -10.1 to 0.9 mmHg). The estimate for the interaction effect was smaller as well (bˆInteraction = -3.1, mmHg; SE = 4.5; p = 0.5).
Antihypertensive Medication
In both GFR subgroups, the proportion of patients whose daily dosage of antihypertensive medication reduced from baseline to week 12 was higher in the low-sodium compared with the standard-sodium study group (Table 3). Correspondingly, and also irrespective of GFR subgroup, the proportion of patients with an increased DDD at week 12 was lower in the low-sodium group.
Change in Antihypertensive Medication
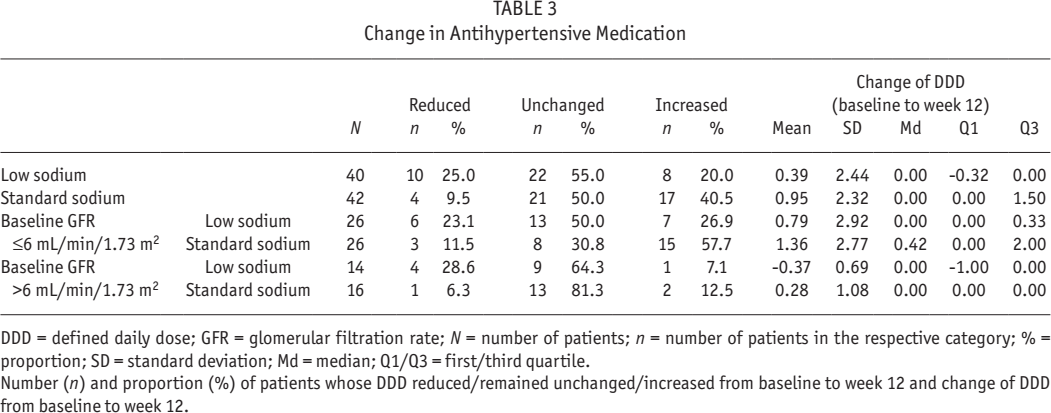
DDD = defined daily dose; GFR = glomerular filtration rate; N = number of patients; n = number of patients in the respective category; % = proportion; SD = standard deviation; Md = median; Q1/Q3 = first/third quartile.
Number (n) and proportion (%) of patients whose DDD reduced/remained unchanged/increased from baseline to week 12 and change of DDD from baseline to week 12.
Effect on Sodium and Fluid Management
To elucidate the physiological relationship of the low-sodium solution on parameters related to sodium and fluid status in the PD patients and their interaction with RRF, those parameters were also analyzed by GFR subgroup (Table 4). The confounder-adjusted estimates of LS mean difference at week 12 revealed a higher dialysate sodium removal with low-sodium PDF solution than with standard-sodium PDF in the low-GFR subgroup; in the high-GFR subgroup it was lower—however, both differences are not statistically different from 0. The 24-h urine sodium removal was slightly and statistically significantly lower with low-sodium PD solution compared with standard-sodium solution in the low-GFR subgroup, and nearly without difference in the high-GFR subgroup.
Parameters of Sodium and Fluid Balance by Baseline GFR Subgroup
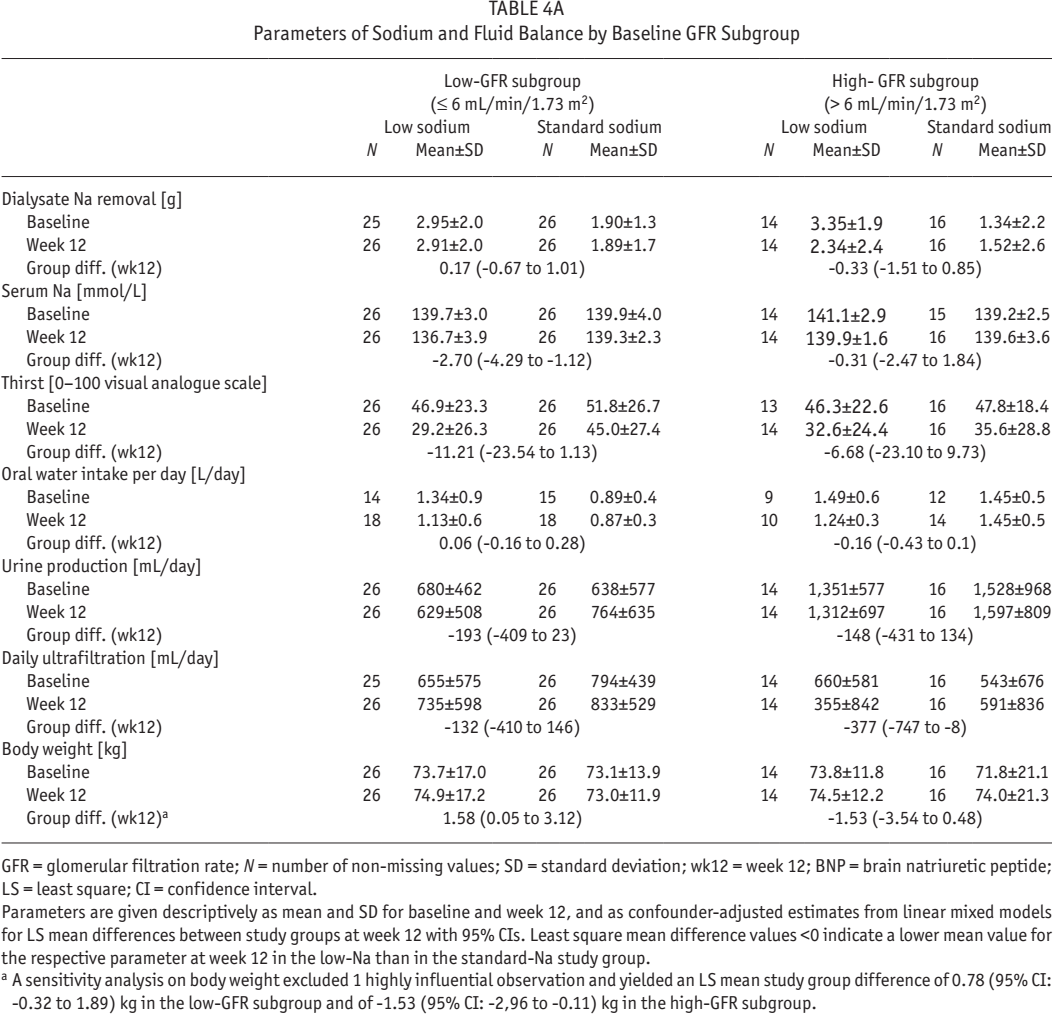
GFR = glomerular filtration rate; N = number of non-missing values; SD = standard deviation; wk12 = week 12; BNP = brain natriuretic peptide; LS = least square; CI = confidence interval.
Parameters are given descriptively as mean and SD for baseline and week 12, and as confounder-adjusted estimates from linear mixed models for LS mean differences between study groups at week 12 with 95% CIs. Least square mean difference values <0 indicate a lower mean value for the respective parameter at week 12 in the low-Na than in the standard-Na study group.
A sensitivity analysis on body weight excluded 1 highly influential observation and yielded an LS mean study group difference of 0.78 (95% CI: -0.32 to 1.89) kg in the low-GFR subgroup and of -1.53 (95% CI: -2,96 to -0.11) kg in the high-GFR subgroup.
Parameters of Sodium and Fluid Balance by Baseline GFR Subgroup
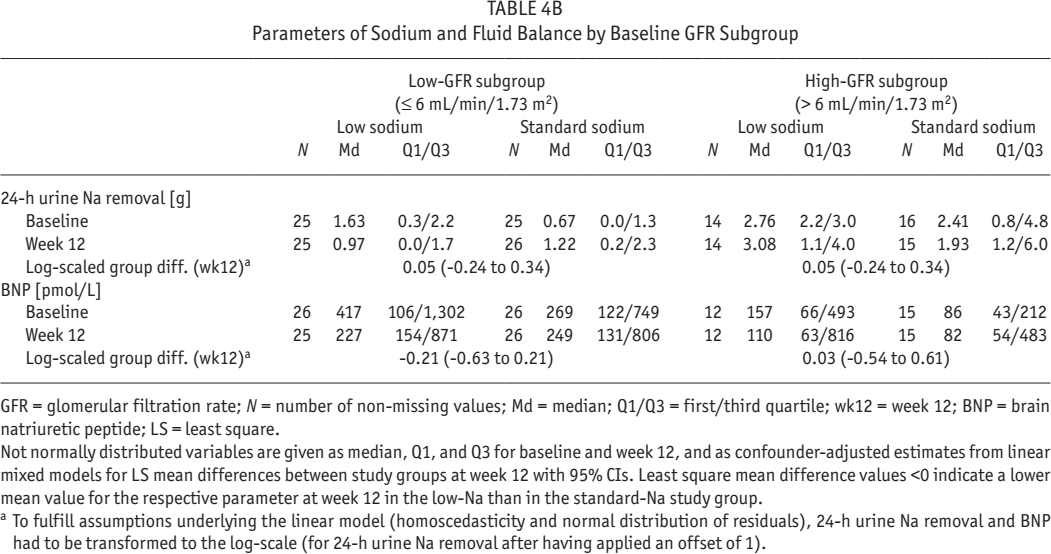
GFR = glomerular filtration rate; N = number of non-missing values; Md = median; Q1/Q3 = first/third quartile; wk12 = week 12; BNP = brain natriuretic peptide; LS = least square.
Not normally distributed variables are given as median, Q1, and Q3 for baseline and week 12, and as confounder-adjusted estimates from linear mixed models for LS mean differences between study groups at week 12 with 95% CIs. Least square mean difference values <0 indicate a lower mean value for the respective parameter at week 12 in the low-Na than in the standard-Na study group.
To fulfill assumptions underlying the linear model (homoscedasticity and normal distribution of residuals), 24-h urine Na removal and BNP had to be transformed to the log-scale (for 24-h urine Na removal after having applied an offset of 1).
Despite this, in the low-GFR subgroup the exposure to the low-sodium PDF resulted in a significant decrease of serum sodium. In the high-GFR subgroup, the decrease of serum sodium was lower and statistically not significant. A sensitivity analysis excluding 3 highly influential observations confirmed the significant decrease for low-sodium vs standard-sodium PDF solution in the low-GFR subgroup (-2.16 mmol/L; 95% CI = -3.5 to -0.9), but yielded a very small, statistically non-significant increase in serum sodium for low-sodium vs standard-sodium PDF (0.66 mmol/L; 95% CI = -1.1 to 2.4) in the high-GFR subgroup. Reduced serum sodium concentrations may affect thirst. This was assessed by the patients on a visual analogue scale and was non-significantly lower in the low-sodium group at week 12 for both GFR subgroups. This was reflected only in minor, non-significant differences of fluid intake between the 2 study arms. Water excretion, both with urine and by UF, was non-significantly lower in the low-sodium group, irrespective of GFR level.
The concentration of BNP was higher in the subgroup with low GFR than in that with high GFR. In the low-GFR subgroup, the BNP concentrations at week 12 were non-significantly lower in the low-sodium group than in the standard-sodium group. If not stated otherwise above, results of sensitivity analyses performed after excluding single highly influential observations confirmed the above described trends. There was a higher body weight increase with low-sodium solution than with standard-sodium solution in the low-GFR group, which was, however, highly influenced by the data of 1 patient. The difference of body weight change in the high-GFR group was not significant.
Adverse Events
Details on adverse events in this study have been described before (9). Six events of hyponatremia occurred in 3 patients from the full analysis set, 2 of these patients were part of the per protocol set analyzed here. Both patients were treated in the low-sodium PD solution group and had a GFR ≤ 6 mL/ min/1.73 m2. One event of hypotension in the low-sodium group and 1 event of orthostatic hypotension in the standard group were recorded, both also in the low-GFR subgroup.
Discussion
This post-hoc analysis of a clinical trial comparing a sodium-reduced PD solution with a standard-sodium PD solution showed an effect on BP depending on RRF. In patients with a low or absent GFR, a significantly different reduction of BP with a low-sodium PDF in comparison with the standard-sodium solution was observed. In patients with a GFR higher than 6 mL/ min/1.73 m2, this effect was not seen. The threshold of 6 mL/ min/1.73 m2 has been derived from the 2002 European best practice guidelines as the lowest level to start dialysis (10). In general, a considerable proportion of PD patients has a GFR below 6 mL/min/1.73 m2, as shown in a prevalent population with a median of 5.1 mL/min/1.73 m2 (6).
The prevalence of hypertension in PD patients is reported, also depending on the definition of hypertension (1), in 42.8% of incident and in 39.1% of prevalent PD patients (6,11). Another study described 88% of PD patients being hypertensive (8). The studies by van Biesen et al. (6) and by Ronco et al. (11) show that about two thirds of these hypertensive patients are also fluid overloaded. Fluid overload can be a consequence of inadequate oral fluid intake and insufficient fluid removal associated with decreasing renal diuresis. Menon et al. identified the association of declining RRF with poor BP control (12).
Moreover, inadequate renal sodium elimination leading to sodium retention can further contribute to fluid overload. Thus, hypertension can be a consequence of increasing extracellular volume, but sodium may also act directly on BP regulation through affecting neurohumoral mechanisms and structural alterations of the cardiovascular system (13).
In the low-GFR subgroup, serum sodium concentration is significantly reduced with the low-sodium PD solution, whereas in the high-GFR subgroup the effect of the low-sodium PD solution on serum sodium is only minor, thus the RRF might adjust renal sodium excretion. Sodium storage in tissues beyond the extracellular volume has been described recently (14), but the role of this process in sodium-dependent BP control cannot be elucidated with our data.
Salt sensitivity of B P, defined as a reaction of BP to increase or decrease upon salt load or salt depletion, has been identified to be present in about one quarter of the normotensive and about half of the hypertensive patients (15). There are scarce data on the prevalence of salt sensitivity in patients with end-stage renal disease; however data from chronic kidney disease (CKD) patients indicate that with decreasing kidney function, prevalence of salt sensitivity increases (16,17). This finding might be supported by our observations that the patients of the low-GFR subgroup on low-sodium PD solution show a distinct effect on BP, i.e. decrease of both SBP and DBP and decreasing serum sodium. Expectedly, the few adverse events of hyponatremia and hypotension reported in this study occurred in the low-sodium group of the low-GFR subgroup.
The observed effect on antihypertensive medication offers the potential to adjust the dose accordingly and/or the number of antihypertensive medications prescribed to dialysis patients when a sodium-reduced PD solution is applied.
The effect of low-sodium PDF and the interaction with RRF was also analyzed for parameters of sodium and fluid status. Differences in part of these parameters between the low-sodium and the standard-sodium group, seen predominantly in the low-GFR subgroup support the potential physiological effect of a sodium-reduced PDF via effects on sodium and fluid balance on BP. Due to the small sample size, most differences were statistically not significant, but there are indications that the presumed principle of action can be confirmed, in that the dialysate sodium removal reduces serum sodium and this, in turn, renal sodium elimination. Despite a trend to a decreased level of thirst, the oral water intake seemed to be unaffected. However a lower fluid excretion by UF and diuresis (again nonsignificant) was observed. An impact on UF to a different extent was observed in other studies applying low-sodium solutions containing between 102 and 120 mmol/L sodium which were not compensated by glucose for reduced osmolarity (18–20). Although our study solution was neither glucose-compensated, our moderately-reduced sodium concentration resulted in only a small decrease of osmolarity, less than with solutions investigated in these other studies. This could explain why we observed only a marginal effect on UF, similarly observed by Nakayama et al. (21). Earlier shown to correlate to hydration status in PD patients (22), BNP could be an indicator of whether a low-sodium PDF may generate a new equilibrium of sodium and fluid status. However, it needs to be kept in mind that BNP is not only a marker of extracellular volume expansion, but also a marker of left ventricular hypertrophy, left ventricular dysfunction, and RRF (23).
In the subgroup with GFR > 6 mL/min/1.73 m2 a smaller, and non-significant difference of serum sodium between the low- and standard-sodium solutions could be observed. For all further parameters, any differences were not significant. This group had an average residual diuresis of 1,446 and 1,464 mL/ day at baseline and after 12 weeks, respectively, which is likely to predominantly control sodium and fluid status in these patients.
We acknowledge limitations of this analysis. It is a post-hoc analysis of a clinical trial designed for another endpoint. Thus the sample size might for some observations be too low to confirm statistical significance. Likewise, due to limited sample size, some parameters were not well balanced between groups at baseline, requiring statistical adjustments in the analytical models. Results have to be considered rather as hypothesis-generating than as confirmative. Further, at the time the study was performed, no method to objectively assess fluid status was available to clearly link the effect of low-sodium PDF on fluid status as to explain the effect on BP.
In conclusion, this post-hoc analysis suggests that the effect of a sodium-reduced PDF on BP is influenced by the extent of kidney failure. In patients with a GFR lower than the level recommended by treatment guidelines to initiate dialysis, a low-sodium PDF has the potential to reduce BP and to support BP management.
Footnotes
Acknowledgments
Part of this post-hoc study was presented at the 55th congress of the European Renal Association-European Dialysis & Transplantation Association, Copenhagen, May 24 – 27, 2018.
PT has received consulting fees and travel funding from Baxter, Fresenius Medical Care and Gambro unrelated to this trial. He has also been a principal investigator in other trials funded by Baxter and Fresenius Medical Care. FMvdS received speaker fees from Baxter Europe and Fresenius Medical Care Europe and a restricted research grant from Fresenius Medical Care Europe. AV has received lecturer fees and travel grants from Baxter and Fresenius Medical Care unrelated to this trial. VS received lecture fees from Fresenius Medical Care, Baxter, and Novartis. RH, GK, and AG are fulltime employees at Fresenius Medical Care. The remaining authors have no financial conflicts of interest to declare. The clinical trial was funded by Fresenius Medical Care. The sponsor was involved in the study design, data collection, analysis and interpretation of data, preparation of study report, and preparation of manuscript.