
Abstract
Multipotent mesenchymal stromal cells (MSCs) have gained tremendous attention as potential therapeutic agents for the treatment of orthopedic diseases. Promising results have been obtained after application of MSCs for treatment of tendon and joint disease in the equine model, making it appear favorable to use these results as a basis for the translational process of the therapy. However, while the horse is considered a highly suitable model for orthopedic diseases, knowledge is lacking regarding the level of analogy of equine MSCs and their human counterparts. Therefore, the aim of this study was to assess the properties of human and equine adipose-and tendon-derived MSCs in a direct comparison. Basic properties of human and equine MSCs from both tissues were similar. The cells expressed CD29, CD44, CD90, and CD105 and lacked expression of CD73, CD14, CD34, CD45, CD79a, and MCHII/HLA-DR. No significant differences were found between proliferation potential of human and equine MSCs in early passages, but recovery of nucleated cells after tissue digestion as well as proliferation in later passages was higher in equine samples (p < 0.01). All samples showed a good migration capacity and multilineage differentiation potential. However, while osteogenic differentiation was achieved in all equine samples, it was only evident in five out of nine human tendon-derived samples. Human MSCs further showed a higher expression of collagen IIIA1 and tenascin-C, but lower expression of decorin and scleraxis (p < 0.01). Although revealing some potentially relevant differences, the study demonstrates a high level of analogy between human and equine MSCs, providing a basis for translational research in the equine model according to the guidelines issued by the authorities.
Introduction
Multipotent mesenchymal stromal cells (MSCs) have gained growing attention as therapeutic agents for orthopedic diseases during the last decades. Although their exact mechanism of action is still an issue of investigation, previous studies have demonstrated beneficial effects of MSC application in animal models of tendon disease or osteoarthritis (2,11,12,52). In order to further exploit the potential of MSCs and to demonstrate their safety and efficacy as well as their mechanism of action, preclinical studies in suitable animal models are required.
Studies in large animal models are particularly important in orthopedic diseases, as regeneration and function of the load-bearing musculoskeletal tissues can be assessed best when the size of the anatomical structure and the load it is subjected to are of similar dimensions as in humans. Furthermore, the most reliable results are obtained when the disease model best possibly reflects the conditions encountered in humans (5,14). This can be attempted by combining different types of animal models (40), in which the inclusion of animal species presenting with naturally occurring orthopedic diseases, for example, horses or dogs, can be advantageous (40,42,50). Especially the relevance of the horse as a model animal for preclinical orthopedic research is not only recognized by the research community, but is also highlighted in guidelines issued by authorities such as the US Food and Drug Administration (FDA) and the European Medicines Agency (EMA) (22,67).
For preclinical studies on cell transplantation therapies in large animals, the FDA and EMA further propose to use homologous models with autologous cell transfer when no humanized or immunocompromised animals are available. In this case, the respective animal and human cells should be equivalent (22), and the level of analogy of the animal and human cellular products should be characterized (67). Despite these clear recommendations, comparative studies on large animal and human MSCs are still relatively rare. While some comparative studies have been published on small animal, porcine, or ovine and human MSCs (29,41,45,71), no such studies have been performed involving equine MSCs yet.
This appears astonishing when considering the remarkable numbers of studies on MSC therapies that have already been performed in the equine model (6). Especially MSC treatment of tendon disease is already relatively well researched in the horse, with treatment of several hundred equine patients as well as roughly 20 further experimental in vivo studies having been published. As these studies indicate a reduction of reinjury rates (7,24,47,60) and an improvement of the structural reorganization of the healing tissue in the treated animals (15,57,63), further translation of the therapeutic concept appears highly favorable.
In addition to these in vivo studies, equine MSCs have been studied and characterized in vitro by several groups (9,10,23,26,38,48,53,69). The results of these studies contribute to the hypothesis that equine and human MSCs are similar and can be used in an analogous fashion. However, it is known that although they share basically similar characteristics, differences can exist between MSCs from different species (29,41,45,58). Such differences can only be explored reliably when the cells in question are studied under identical conditions. Therefore, a comparative study involving both human and equine cells appears vital for the use of any translational studies on MSC transplantation in the equine model.
Besides species-related differences, the tissue source can also have an impact on the properties of MSCs (9,30). Adipose and tendon tissue may be advantageous MSC sources for tendon therapy and were therefore chosen to be used in the present study. Adipose tissue-derived MSCs (AT-MSCs), currently more often referred to as adipose-derived stromal or stem cells, have been shown to be easily obtainable, highly vital, and immunomodulatory (3, 9,10,35,72). Recent studies further demonstrated a higher expression of tendon extracellular matrix components in equine AT-MSCs compared to MSCs from other sources, suggesting a high potential to support and modulate tendon matrix reorganization (8). Tendon tissue-derived MSCs (TT-MSCs), on the other hand, are tissue-specific progenitor cells and might therefore be capable of supporting tendon healing in a well-specialized fashion (39,43).
The goal of this study was to directly compare phenotypic as well as functional characteristics of human (hu) and equine (eq) AT- and TT-MSCs, aiming to improve the transferability of results gained in the equine model according to the guidelines issued by the responsible authorities. Attempting to close a gap in the translational progress of MSC-based therapeutic concepts, our hypothesis was that properties and phenotypes of MSCs from the two species are basically similar.
Materials and Methods
Study Design
Primary cells were isolated from human and equine adipose and tendon tissue (n ≥ 7 per sample type). The plastic-adherent cell fractions (huAT-MSCs, eqAT-MSCs, hu TT-MSCs, and eq TT-MSCs) from each sample were expanded and subjected to the characterization assays that were previously established (9,48) and that are specified below.
Sample Collection
Human subcutaneous adipose tissue was obtained from nine healthy donors (median age: 37 years; age range: 31–45 years; female and male) after liposuction was performed for cosmetic reasons. Human tendon tissue was collected from nine healthy donors (median age: 25 years; age range: 20-32 years; male) during knee surgery from tendon material discarded following preparation of cruciate ligament transplants (M. semitendinosus or M. gracilis). All human samples were collected with informed consent of the donors and approval by the local ethics committee (AZ 053-13-11032013).
Equine subcutaneous adipose tissue and tendon tissue were collected via skin incision from the supragluteal region and the superficial digital flexor tendon, respectively, from seven healthy horses (median age: 3 years; age range: 3-18 years; female and male) that were euthanized within the framework of another study approved by the local ethics committee (Landesdirektion Leipzig, Germany A 13/10).
Samples were stored at room temperature and subjected to cell isolation within 4 h after collection.
In addition, three separate human and six separate equine tendon samples were collected and immediately frozen at −80°C to be used as a reference for tendon marker expression analysis by real-time reverse transcription-polymerase chain reaction (RT-PCR).
Cell Isolation and Culture
For primary cell isolation, tissues were minced into small pieces of 1 mm3 and incubated in Hank's balanced salt solution (HBSS; Life Technologies GmbH, Karlsruhe, Germany) containing collagenase I (0.8 mg/ml and 4-h incubation time for adipose tissue; 5.6 mg/ml and 6-h incubation time for tendon tissue; Life Technologies GmbH) under permanent shaking at 37°C.
Isolated cells were washed, suspended in low glucose (1 g/L) Dulbecco's modified Eagle medium (DMEM; Life Technologies GmbH) supplemented with 20% fetal bovine serum (FBS; Sigma-Aldrich, Taufkirchen, Germany), 1% penicillin-streptomycin (PAALaboratories GmbH, Coelbe, Germany), and 0.1% gentamycin (Life Technologies GmbH), and seeded onto tissue culture flasks (BD Biosciences, Heidelberg, Germany) at a density of approximately 20,000 cells/cm2.
Under standard culture conditions at 37°C in a humidified 5% CO2 atmosphere, cells were allowed to attach for 2-3 days before the medium was changed, removing non-adherent cells. Medium was then changed twice weekly until MSCs were passaged at 80% confluency.
Proliferation Assays
For MSC expansion and assessment of generation times (GT), passage (P) 1 to P7 cells were seeded at a density of 3,000 MSCs per cm2 and passaged at 80% confluency. Population doubling rates (PD) and GT were calculated:
PD = 1n (cell count harvest/cell count seeding)/ln 2 and GT = 1/(PD/ days in culture).
At P3 and P8, a MTS tetrazolium assay (Cell Titer 96® Aqueous One Solution Proliferation Assay; Promega, Mannheim, Germany) was performed to evaluate cell proliferation rates (PR) between days 1 to 7 in culture. One thousand cells per well were seeded in 96-well plates (BD Biosciences) according to the manufacturer's instructions. At days 1 and 7, 20 μl MTS reagent per 100 μl culture medium was added. After 4 h of incubation at 37°C, formazan production was assessed photometrically (Tecan Safire™, Magellan™ Software; Tecan Group Ltd., Maennedorf, Switzerland) at a wavelength of 490 nm. PR was calculated as:
PR=optical density day 7/optical density day 1.
Trilineage Differentiation
For adipogenic differentiation, MSCs (P3) were seeded in 12-well plates (1,580 cells/cm2; BD Biosciences). After 3 days of incubation under standard culture conditions, medium was replaced by adipogenic differentiation medium consisting of DMEM-F12 (PAA Laboratories GmnH) supplemented with 15% rabbit serum, 1 μM dexamethasone, 100 μM indometacin, 500 μM 3-IBMX, 700 nM bovine insulin (all Sigma-Aldrich), and anti-biotics. After 3 days of incubation, samples were fixed for 20 min with 50% ethanol (Carl Roth, Karlsruhe, Germany) and stored at −20°C until Oil red O staining. For staining, cells were washed with distilled water and then incubated with 0.21% Oil red O (Sigma-Aldrich) in 60% isopropanol (Carl Roth) for 20 min. Subsequently, cells were washed in 50% ethanol, and nuclei were counterstained with Mayer's hematoxylin (Dako GmbH, Hamburg, Germany) for 2 min, followed by washing in tap water. Intensity of adipogenic differentiation was evaluated by two blinded observers using a previously published score system that includes the percentages of differentiated cells as well as the size of the Oil red O-stained lipid droplets (9).
For osteogenic differentiation, MSCs (P3) were seeded in 12-well plates (525 cells/cm2). After 3 days of incubation under standard culture conditions, medium was replaced by osteogenic differentiation medium consisting of DMEM-F12 supplemented with 10% FBS, 100 μM L-ascorbate-2-phosphate, 10 mM β-glycerophosphate, 100 nM dexamethasone (all Sigma-Aldrich), and antibiotics. Medium was changed twice weekly for 21 days of incubation. Cells were then fixed with 4% paraformaldehyde (PFA; Carl Roth) for 10 min and were then stored at −20°C until von Kossa staining of mineral deposits. For staining, cells were washed and then incubated with 5% silver nitrate (Carl Roth) in daylight for 30 min, washed and incubated with 1% pyrogallol (Carl Roth) for 3 min, washed and finally incubated with 5% sodium thiosulfate (Carl Roth) for 3 min, followed by a last washing step. Distilled water was used for all washing steps and for dissolving the chemicals. For positively stained samples, the index of osteogenic differentiation (IOD) was determined as described previously (46). Briefly, optical densities of stained differentiated and control samples were measured photometrically (λ= 492 nm) (Tecan Safire™, Magellan™ Software; Tecan Group Ltd.), and the IOD was calculated:
IOD = optical density (differentiated)/optical density (control).
Chondrogenic differentiation of MSCs (P3) was performed in pellet culture, and 500,000 cells per pellet were washed before chondrogenic differentiation medium consisting of high glucose (4.5 g/L) DMEM (PAA Laboratories), 10 ng/ml TGF-β1 (Acris Antibodies, Hiddenhausen, Germany), 1% ITS+ premix (BD Bio-sciences), 100 nM dexamethasone, 100 μM L-ascorbate-2-phosphate, 400 mM proline (Sigma-Aldrich), and antibiotics was added, and then centrifuged at 280 × g at 4°C for 5 min. Medium was changed twice weekly until day 21. Thereafter, pellets were fixed in 4% PFA overnight, dehydrated, and embedded in paraffin (Carl Roth). Sections of 5 μm were cut, deparaffinized, and rehydrated for staining with Alcian blue, Masson's Trichrome, and Safranin O. For Alcian blue staining, slides were rinsed in 3% acetic acid for 3 min and incubated with 1% Alcian blue in 3% acetic acid for 90 min, followed by washing in tap water, counterstaining in Nuclear Fast Red for 10 min, and a further washing step in distilled water. For Masson's Trichrome staining, slides were fixed in Bouin's fluid at 60°C for 60 min, then washed in running tap water for 10 min. Slides were further stained with Weigert's iron hematoxylin for 10 min, washed in tap water and 1% acetic acid for 10 min each. Slides were then incubated with 0.1% Ponceau-fuchsin (Xylidine Ponceau and acid fuchsin, 3:1) in 1% acetic acid for 30 min, rinsed in 1% acetic acid, placed in 2% tungstophoric acid for 2 min, and washed again in 1% acetic acid. Slides were finally stained with 0.2% Fast Green in 1% acetic acid for 5 min and rinsed in 1% acetic acid. For Safranin O staining, slides were rinsed in distilled water, incubated with 0.2% Safranin O in 1% acetic acid for 15 min, washed in distilled water, then counterstained with 0.2% Fast Green in 1% acetic acid for 15 s, followed by washing in distilled water. All substances for the staining procedures described here were obtained from Sigma-Aldrich. After staining, slides were rinsed in 96% ethanol for 3 min, then in xylene (Carl Roth) for 10 min. After air drying, coverslips with mounting medium (Roti®-Histokitt; Carl Roth) were placed over the stained pellets. Samples with Alcian blue and Masson's Trichrome positive proteoglycan and collagen staining were evaluated by two blinded observers using the Bern score based on Safranin O staining (25).
Immunophenotyping
Immunostaining and flow cytometry (FCM) of MSCs (P3) were performed to assess the expression of the marker antigens recommended for MSC definition by the International Society for Cellular Therapy. These comprised CD73, CD90, and CD105 as positive markers and CD14, CD34, CD45, CD79α, and MHCII/HLA-DR as exclusion markers. CD29 and CD44 were included as additional positive markers. For most antigens, anti-human antibodies that had previously been tested for cross-reactivity with the respective equine antigens (4,17,48) could be used for MSCs from both species. Different antibodies were used in the two species for CD90, as the one tested for equine MSCs showed poor affinity in human cells, and for MHCII/HLA-DR. Antibodies used are specified in Table 1.
Antibodies Used for Immunophenotyping

Staining was performed as described previously (48). Briefly, MSCs were detached with cell scrapers to prevent loss of surface molecules due to use of detachment enzymes. All incubation steps were performed on ice, unless stated otherwise, and protected from light. For identification of dead cells, MSCs were first incubated in Fixable E-Fluor 780® (ebioscience, Frankfurt a.M., Germany) diluted in phosphate-buffered saline (PBS; 1:1,000; PAA Laboratories) for 20 min. Blocking was performed by incubation in 1:500 diluted and heat-inactivated serum of the required species for 15 min. Immunostaining was then carried out using the subsets CD90/CD34, CD14/CD45/CD105, CD29/CD44/MHCII, and single staining of CD73 and CD79α, with 15-min incubation time for each antibody. For CD79α, staining, the FIX & PERM® kit (Life Technologies) was used according to the manufacturer's instructions prior to immunostaining, and cells were stained at room temperature. Isotype controls for each primary antibody used were prepared accordingly. Following all staining procedures, MSCs were fixed in 2% PFA or 0.1% PFA for CD 79α for 15 min, washed with PBS, and stored in FCM staining buffer (PBS, 3% FBS, 0.01% sodium azide; Carl Roth) until FCM analysis.
Eight hours after staining, cells were analyzed using a FACS CantoII™ (BD, Franklin Lakes, NJ, USA) equipped with a blue 488-nm solid state and a red 633-nm HeNe laser. Compensation was accomplished with CompBeads™ (BD). For each sample, 200,000 cells were recorded. Further analysis was performed using FlowJo 10.0.6 and 10.0.7 (Tree Star, Inc., Ashland, OR, USA). Gating strategies focused on living cells and exclusion of doublets. Geometric mean fluorescence intensity was used to define positive cells, and percentages of these were calculated.
Migration Assay
Migration of MSCs was assessed using a three-dimensional spheroid culture system. To prepare the cell spheroids, culture medium was supplemented with 0.003 g solubilized methyl cellulose (Sigma-Aldrich) per milliliter to increase viscosity, and MSCs (P3) were cultured in hanging drops (5,000 cells per drop) for 24 h until spheroid formation was observed. Spheroids were harvested, washed in PBS, seeded onto six-well plates, and cultured at standard conditions, allowing MSC migration from the spheroids onto the culture plates. After an additional 24 h, cells were photographed (IX51 research microscope; CC-12 digital color camera; CellAA software; Olympus Soft Imaging System GmbH, Muenster, Germany), and the area covered by migrated MSCs was measured (Fig. 5A).
Tendon Marker Expression
The basal expression of tendon extracellular matrix components and tendon differentiation markers in MSCs (P3) was assessed by real-time RT-PCR.
Total RNA of MSCs was isolated using the RNeasy® Mini Kit (Qiagen, Hilden, Germany) according to the instructions of the manufacturer (protocol version 09/2010). Frozen tendon samples, which were used as reference tissue, were sliced in 12-μm sections with a microtome CM 3050 S equipped with a cryochamber (Leica Microsystems, Wetzlar, Germany) and incubated for 60-min at 55°C in homogenization buffer (15 mM HEPES, 2.5 mM KC1, 68.5 mM NaCl, 450 μM Na2HPO4, 17.5 mM EDTA, 27.5 mM glucose at pH 7) containing 100 μg/ml proteinase K (Life Technologies). To homogenize the sample, lyzed tendon tissue was passed through a 20-gauge needle several times. Total RNA of tendon tissue homogenate was purified with phenol/chloroform extraction and isopropanol precipitation.
DNase-treated RNA was reverse transcribed using the RevertAid H Minus First Strand cDNA Synthesis Kit (Thermo Fisher Scientific, Nidderau, Germany) or the Omniscript RT Kit (Qiagen) with oligo-dT18 primers as described by the manufacturers. Relative quantification of cDNA was performed with a 7500 Real Time PCR System (Applied Biosystems, Foster City, CA, USA) and SYBR® Green as double-strand DNA-specific dye (iQ™SYBR® Green Supermix; Bio-Rad, Munich, Germany). Primers amplifying the respective genes are listed in Table 2.
Ct values were used to calculate the ratios of target gene expression relative to the housekeeping gene expression as previously described (51). Further, MSC gene expression ratios were normalized to the respective gene expression ratios in the native tendon tissue (naT), expressed as fold change (FC) compared to naT:
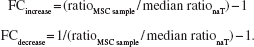
Primers Used for Real-Time RT-PCR Analysis of Tendon Marker Expression

Statistical Analysis
Using SPSS Statistics 22 software (IBM Deutschland GmbH, Ehningen, Germany), Kruskal-Wallis one-way analyses of variance and, in case of significance, subsequent Mann-Whitney U tests were performed to analyze differences between the sample groups. Differences were considered significant at p < 0.01.
Results
Cell Recovery and Proliferation
Recovery of plastic-adherent cells with fibroblast-like morphology was successful in all samples. The numbers of initially isolated nucleated cells per gram of tissue were higher in equine compared to the respective human tissues (p = 0.000) (Fig. 1A). Yet the yields of plastic-adherent MSCs per seeded nucleated cells and culture days obtained at first passaging were similar among eqAT-MSCs, eqTT-MSCs, and huAT-MSCs, and even slightly higher in huTT-MSC samples (Fig. 1B). During the later passages, equine MSCs proliferated faster than their human counterparts, as demonstrated by shorter GT in the population doubling assays and higher PR in the MTS assays. This difference became significant in earlier passages for AT-MSCs (GT: p < 0.01 in P3, P5, P6, and P7; PR: p = 0.001 in P8) than for TT-MSCs (GT: p = 0.005 in P7; PR: p = 0.003 in P8). Furthermore, as in P0, huTT-MSCs continued to proliferate more rapidly than huAT-MSCs (GT: p < 0.01 in P1, P2, P3, and P6; PR: p < 0.01 in P3 and P8). In contrast, no differences were evident between the proliferation potential of eqAT-MSCs and eqTT-MSCs (Fig. 1C, D).

Cell recovery and proliferation. (A) Recovery of nucleated cells (NC) per gram of tissue following tissue digestion; (B) recovery of mesenchymal stromal cells (MSCs) per seeded NC and culture days in passage 0; (C) generation times during MSC expansion; (D) relative proliferation rates in passage 3 and 8, determined by MTS assay. Bars indicate the median values, error bars the 95% confidence intervals. *Higher NC recovery, shorter generation times, or higher proliferation rates compared to samples obtained from the same tissue source but the other species (p < 0.01); +shorter generation times or higher proliferation rates compared to samples obtained from the same species but the other tissue source (p < 0.01). Eq, equine; hu, human; AT, adipose tissue; TT, tendon tissue.
Trilineage Differentiation
Multilineage potential with differentiation capacity in at least two different mesenchymal cell types could be demonstrated for all samples, but a few individual samples did not show the classical trilineage potential after induction with the protocols used in this study.
Adipogenic induction was achieved in all samples except 1 huTT-MSC sample, as demonstrated by Oil red O staining of the accumulated intracellular lipid droplets, which were not detected in the respective noninduced control cells. Evaluation by the scoring system revealed that accumulation of lipid droplets in positive samples was slightly more pronounced in equine than in human MSCs (p = 0.001 for TT-MSCs) (Fig. 2A).

Trilineage differentiation. Representative images obtained after (A) adipogenic differentiation and Oil red O staining, (B) osteogenic differentiation and von Kossa staining, and (C) chondrogenic differentiation and Trichrome Masson's staining. Diagrams show the results obtained after (semi)quantitative evaluation of stained samples. For chondrogenic differentiation, the scoring was performed using Safranin O-stained slides. Bars indicate the median values, error bars the 95% confidence intervals. *Higher values compared to samples obtained from the same tissue source but the other species (p < 0.01). Please note that only the positively stained samples were subjected to (semi)quantitative evaluation and statistical analysis as shown in the diagrams. Eq, equine; hu, human; AT, adipose tissue; TT, tendon tissue; MSC, mesenchymal stromal cells.
Following osteogenic induction, von Kossa staining of mineralized nodules was evident in all equine MSC samples and in all except one huAT-MSC sample but only in five out of nine huTT-MSC samples. In the positively stained samples, however, assessment of the IOD revealed no further significant differences between the osteogenic potential of the different sample types (Fig. 2B).
After chondrogenic differentiation, in contrast, all human samples but only five out of seven eqAT-MSC and six out of seven eqTT-MSC samples showed positive staining of collagen and glycosaminoglycans by Alcian blue and Masson's Trichrome. Distinct Safranin O staining was not evident in any of the samples. Scoring of the samples positive for Alcian blue and Masson's Trichrome based on the cell morphology and matrix accumulation revealed no further significant differences between the different sample groups (Fig. 2C).
Immunophenotype
MSCs from both species and tissues were positive for CD29, CD44, CD90 (except for eqTT-MSCs), and CD105. However, the percentages of positive cells varied between donors. No or very low percentages of CD73+ cells were found by FCM, irrespective of the sample type. Still, real-time RT-PCR demonstrated CD73 mRNA expression in human MSC samples (data not shown). MSCs from both species and tissues further showed no or very low expression of all exclusion markers (Table 3, Figs. 3 and 4).
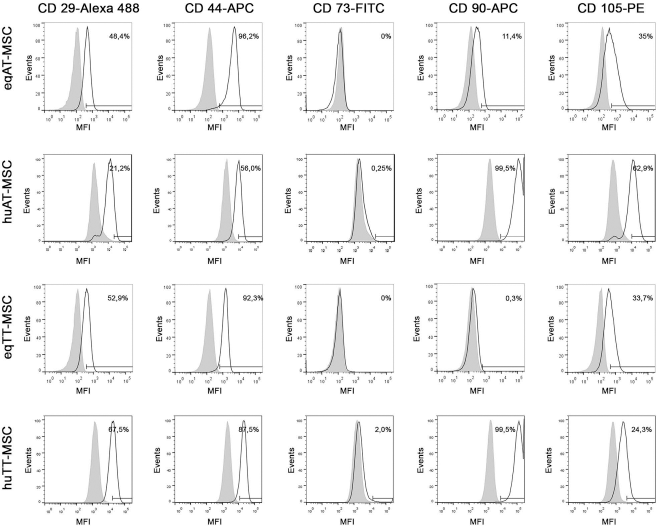
Immunophenotyping of positive marker antigens. Histograms of representative samples illustrating the expression of positive marker antigens, displaying relative numbers of events versus their mean fluorescence intensity (MFI). White histograms indicate samples incubated with monoclonal antibodies, gray histograms show the corresponding isotype controls. Measuring bars indicate cutoff values and percentages of positive cells. Eq, equine; hu, human; AT, adipose tissue; TT, tendon tissue; MSC, mesenchymal stromal cells.

Immunophenotyping of exclusion marker antigens. Histograms of representative samples illustrating the expression of exclusion marker antigens, displaying relative numbers of events versus their mean fluorescence intensity (MFI). White histograms indicate samples incubated with monoclonal antibodies, gray histograms show the corresponding isotype controls. Measuring bars indicate cutoff values and percentages of positive cells. Eq, equine; hu, human; AT, adipose tissue; TT, tendon tissue; MSC, mesenchymal stromal cells.
Immunophenotype of the Mesenchymal Stromal Cells

The table shows the percentages of positive cells for each antigen, given as median (minimum-maximum). Eq, equine; hu, human; AT, adipose tissue; TT, tendon tissue; MSCs, mesenchymal stromal cells.
However, preliminary experiments performed in our laboratory strongly indicated different affinities of the antibodies used, on the one hand between species when the same antibody was used, despite being tested for cross-reactivity, and on the other hand, even between different anti-human antibodies binding the same marker molecule in the same MSC samples (data not shown). As these different affinities hamper a direct and quantitative comparison between species, statistical means to analyze differences between sample groups were not used.
Migration
Good migration potential was evident in AT- and TT-MSCs from both species. No significant differences between the different MSC sample types investigated in this study were found. The highest values following measurement of the migration area were obtained in eqTT-MSCs, followed by huAT-MSCs (Fig. 5).

Migration assay. (A) Measurement of the area covered by mesenchymal stromal cells (MSCs) migrating from the spheroid (bordered by the white lines) after 24 h of incubation. The migration area is highlighted in light gray on the right image. (B) Diagram illustrating the migration areas measured in the MSC samples; bars indicate the median values, error bars the 95% confidence intervals. Eq, equine; hu, human; AT, adipose tissue; TT, tendon tissue.
Tendon Marker Expression
All MSC samples expressed the investigated tendon extracellular matrix components and tendon differentiation markers at quantifiable levels. Species-related differences between MSC samples were evident, with a higher expression of collagen IIIA1 and tenascin-C in human samples, but a higher expression of decorin and scleraxis in the equine samples.
For tenascin-C expression, the species-related higher expression in human MSCs was significant for TT-MSCs (p = 0.004). For collagen IIIA1 expression levels, however, the species-related differences were not significant when regarding the FC values normalized to naT. Tissue origin-related differences were more evident here, with a higher collagen IIIA1 expression in AT-MSCs than in TT-MSCs in both species (p = 0.002 for equine samples).
For decorin, the species-related higher expression in equine samples was pronounced in both AT-MSCs (p = 0.001) and TT-MSCs (p = 0.004); for scleraxis, differences were only significant in TT-MSCs (p = 0.004).
Collagen IA2 expression levels did not display a clear species-related or tissue origin-related pattern and were highest in huTT-MSCs and eqAT-MSCs, and lowest in eqTT-MSCs (p = 0.004 compared to huTT-MSCs; p = 0.002 compared to eqAT-MSCs) (Fig. 6).

Tendon marker expression. Relative gene expression of tendon extracellular matrix molecules or differentiation markers in mesenchymal stromal cells (MSCs) determined by real-time RT-PCR, normalized to the expression in native tendon tissue as fold change. Bars indicate the median values, error bars the 95% confidence intervals. *Higher gene expression compared to samples obtained from the same tissue source but the other species (p < 0.01); +higher gene expression compared to samples obtained from the same species but the other tissue source (p < 0.01). Eq, equine; hu, human; AT, adipose tissue; TT, tendon tissue.
Discussion
While it has often been proposed to use the existing data on tendon MSC therapy in the horse as a basis for human medicine (44,50,61,62), to the best of our knowledge, this is the first study to actually evaluate the characteristics of human and equine MSCs in a direct comparison and according to the recommendations of the authorities (68).
For this purpose, we chose to evaluate phenotypic and selected functional properties using established assays in order to obtain a high reliability of results. Phenotypic characterization was performed by immunophenotyping using a comprehensive marker set to assess the cellular identity. Functional characterization included trilineage differentiation assays according to the standards of MSC characterization, proliferation assays due to the importance of cell growth kinetics and viability, migration assays due to the impact of cell migration on the capability of homing and integration in host tissues, and the assessment of the expression of several marker molecules that are considered relevant to tendon healing (18,21,65,68).
We could confirm our hypothesis that human and equine MSC properties and phenotypes are basically similar, enabling translational research in the equine model. Specifically, cells in all sample groups displayed the typical spindle-shaped, plastic-adherent phenotype, similar surface marker expression patterns and multipotent differentiation capacity, as well as reliable migration potential and proliferation in the early passages. However, corresponding to other studies comparing MSCs from different species (29,41,45,58), our results also suggest some differences between human and equine MSCs, which should be considered in the translational process. Furthermore, differences found between the MSC samples evaluated in this study did not seem to be solely species related, but were also associated with the tissue origin or were in some cases even examples of high interdonor variability.
All donors in this study, except for one horse that was 18 years old but the MSCs of which did not show any abnormalities, could be selected to be healthy as well as full grown, but not elderly, in order to best possibly exclude age- or general health-related variations between the samples. Furthermore, all horses were of the same breed (Haflinger). Still, interdonor variability was evident in individual MSC samples, especially regarding the trilineage differentiation assays, in which all samples showed multipotency, but not all samples showed the classical trilineage differentiation potential. Similar findings were reported for human and porcine (45) as well as for ovine bone marrow-derived MSCs (1). This shows that as in humans, individual differences between cells from different donors are to be expected in large animal species, unlike in inbred laboratory animal strains. While this makes studies on MSCs from large animals more realistically comparable to studies on MSCs obtained from humans, at the same time the interdonor variations require larger sample sizes to obtain reliable results.
Differences between MSCs from different tissue origins have been reported for human as well as for equine MSCs in numerous studies (9,10,30,36). However, it is interesting that the tissue-specific differences between AT- and TT-MSCs observed in this study were not always the same in the two species. For example, while eqAT-MSCs and eqTT-MSCs displayed a very similar proliferation potential, huTT-MSCs proliferated faster than huAT-MSCs. Furthermore, collagen IA2 expression was highest in huTT-MSCs but lowest in eqTT-MSCs. This underlines the importance of cell characterization studies that should be as specific as possible concerning cell source and species before translation of any therapeutic concept is attempted.
Differences between the MSC samples investigated in the current study that appear to be species related were found in cell recovery and proliferation potential in later passages, osteogenic differentiation, and tendon marker expression.
Recovery of nucleated cells and the proliferation potential in later passages were higher in equine samples. However, no significant differences were observed regarding the proliferation potential in earlier passages. Our results indicate that MSC numbers sufficient for therapeutic applications can be obtained in P3 from equine as well as human samples. Comparing human, rabbit, and sheep AT-MSCs, it had previously been discovered that MSCs from these three species displayed a similar proliferation potential from P2 to P8, although the initial cell recovery was higher in rabbits (41). Similarly, no significant differences were found between the population doubling times of minipig and human bone marrow-derived MSCs (29). MSC proliferation strongly depends on the culture media used (1,58), and it was shown that the best proliferation is not achieved using the same culture medium for all species (58). While we deliberately used the same culture medium for all samples to improve comparability in the current study, species-specific optimization of the culture medium is advisable for further studies.
Regarding the trilineage potential, the most remarkable difference was found in osteogenic differentiation, as only part of the human MSC samples (five out of nine in the case of huTT-MSCs) showed positive staining of mineralizations after induction, whereas all equine samples stained positively. Similarly, equine MSCs had previously been shown to exhibit higher osteogenic potential than canine or porcine MSCs derived from adipose tissue (58) and that ectopic bone formation on scaffolds was greater in ovine than in human MSCs (71). On the one hand, such differences might again be compensated when using optimized protocols for each species, as it was demonstrated that differences between osteogenic potential of human and minipig MSCs depended on the protocols used (45). On the other hand, for clinical application in tendon therapy, low osteogenic potential appears favorable as it might reduce the risk of erroneous bone formation (28,56).
Furthermore, different basal tendon marker expression patterns were found in human and equine MSCs, with human MSCs showing a higher collagen IIIA1 and tenascin-C expression, but lower decorin and scleraxis expression than equine MSCs. All of these markers are important molecules in tendon tissue or tenocytes (54,59,65,66,70). However, high collagen IIIA1 and tenascin-C levels are generally associated with healing processes and tendon disease (34,54,55), while decorin and scleraxis are important for development and reorganization of the tendon structure (20,59,70). While support of tendon structure reorganization is presumably a major effect of MSCs in tendon therapy (15,57,63), unfortunately knowledge is still lacking on the exact mechanism of action, hampering a final interpretation of our finding regarding the basal tendon marker expression. Upregulation or downregulation of tendon markers in the in vivo environment of a tendon lesion are to be expected and should be further investigated in appropriate model systems.
The phenotypes of human and equine MSCs appeared to be similar despite the differences regarding the above-mentioned functional in vitro characteristics. Although some interdonor variations were evident regarding the percentages of positive cells, there was a clear pattern that CD29, CD44, CD90, and CD105 are expressed in MSCs from both species, while CD73 and the exclusion markers CD14, CD34, CD45, CD79α, and MHCII could not be detected at significant levels by FCM. While the lack of CD73 expression in equine MSCs is in accordance with most previous studies (17,31,49), CD73 is a recommended marker for human MSCs (18) and was therefore expected to be expressed in the human samples, but could not be detected by FCM in the current study. Here it is of importance to mention that as for CD90 and CD105, the authors had tested several anti-human anti-bodies against CD73, but none of these led to distinctly positive results (data not shown). In contrast, there was a high discrepancy between the percentages of CD90+ cells when different anti-human antibodies were used, ranging from 0% to 99% of CD90+ cells in the same human samples. This discrepancy was not only evident in human MSCs, but also in exemplarily tested equine MSC samples. Here >90% CD90+ cells could be detected in eqTT-MSCs when using certain antibodies (data not shown), although the same cells seemed to display a very low CD90 expression when using the antibody previously tested for cross-reactivity (17,48). However, as the antibodies that showed a higher affinity for CD90 had not been tested for cross-reactivity in previous studies, to prevent false positive results they were only used for the human samples in the final experiments of the current study. This may have led to seemingly lower percentages of CD90+ cells in the equine samples. However, while CD90 expression in equine MSCs from other sources was demonstrated previously (4,17,26,31), no such reports dealing with eqTT-MSCs in particular exist so far. Thus, on the one hand, the present finding of lacking CD90 expression in eqTT-MSCs may be due to poor antibody affinity, but on the other hand, the presence of CD90 in these cells remains to be proven. Currently, considering the nonavailability of commercially distributed antibodies against most MSC-related antigens for the equine species, which impairs a flexible choice of antibodies (6,16), and additionally the high variability of results even using anti-human antibodies for human cells, more work is still required before a reliable and comparable quantitative analysis of MSC marker expression in the two species can be performed.
Nevertheless, regardless of the technical issues concerning the available antibodies, our results obtained by FCM suggest that the MSC isolation procedures used do not lead to homogeneous cell populations corresponding to the MSC definition by the ISCT (18), neither for human nor for equine cells. Interestingly, plastic adherence-based cell isolation procedures corresponding to those in the present study are very commonly used to obtain MSCs (3,32,64). However, only a few studies dealing with MSCs present the results of immunophenotyping using a comprehensive marker set (33); hence, the true identity of the isolated cells often remains questionable. Nevertheless, it cannot be denied that MSC-like cells prepared in this manner were shown to display beneficial effects in vivo by several different groups (e.g., 13,19,27,37). It remains a highly relevant question at this point whether it should be aimed at therapies involving homogeneous, true MSC preparations only, or whether the application of heterogeneous MSC-like populations is actually advantageous, due to potential complementary mechanisms sustained by different cell types.
The present data underline that precise characterization of the cell populations to be applied is of tremendous importance for preclinical studies. As investigating cell properties in vitro can only be an approximation, corresponding in vivo studies using the cell population in question remain of tremendous importance in order to best possibly exclude any risks and to best possibly predict the efficacy of the treatment prior to application in human patients.
Demonstrating a high level of analogy between human and equine cells, the current study provides a reliable basis for translational studies on MSC therapies in the equine large animal model for the first time.
Footnotes
Acknowledgments
The authors thank Dr. Claudia Gittel and Bastian Pfeiffer (Large Animal Clinic for Surgery, University of Leipzig, Germany), Dr. Daniel Piehler (Institute of Immunology, Faculty of Veterinary Medicine, University of Leipzig, Germany), and Dr. Iris Ribitsch (Equine University Clinic, University of Veterinary Medicine, Vienna, Austria) for their scientific input and their help in data acquisition. Prof. A. Bader and Prof. P. Seibel (Center for Biotechnology and Biomedicine, University of Leipzig, Germany) and Prof. J. Seeger (Institute of Anatomy, Histology and Embryology, Faculty of Veterinary Medicine, University of Leipzig, Germany) are acknowledged for kindly providing the laboratory facilitties. The work presented in this article was made possible by funding from the German Federal Ministry of Education and Research (BMBF 1315883). The authors declare no conflicts of interest.