
Abstract
Xenotransplantation of human cells in animal models is an essential tool for evaluation of safety and efficacy of cell-based products for therapeutic use. Sensitive and reproducible methods are needed to detect and quantify human cells engrafted into the host tissue either in the targeted organ or in undesired locations. We developed a robust quantitative polymerase chain reaction (qPCR) assay based on amplification of human AluYb8 repeats, to assess the number of human cells present in rat or mouse tissues after transplantation. Standard curves of mixed human/rodent DNA and mixed human/rodent cells have been performed to determine the limit of detection and linear range of the assay. Standard curves from DNA mixing differed significantly from standard curves from cell mixing. We show here that the AluYb8 qPCR assay is highly reproducible and is able to quantify human cells in a rodent cell matrix over a large linear range that extends from 50% to 0.01% human cells. Short-term in vivo studies showed that human cells could be quantified in mouse liver up to 7 days after intrasplenic transplantation and in rat liver 4 h after intrahepatic transplantation.
Keywords
Introduction
Human cell transplantation in animal models is an essential step for the development of cell therapy products for clinical use. Concerning cell therapy for liver diseases, the focus is increasingly put on the use of stem/progenitor liver cells to replace mature hepatocytes for transplantation. Stem or progenitor cells offer the advantage over mature liver cells to proliferate in vitro and to withstand cryopreservation. Furthermore, some hepatic progenitor cells have shown proliferation capacity in vivo and participate to recipient mouse liver regeneration in response to partial hepatectomy (11). However, progenitor/stem cells can be difficult to track once transplanted because in vivo maturation might modify their phenotype, and their detection requires species-specific labeling methods (11). As a means to evaluate the therapeutic efficacy of cell-based products and to correlate their potency with clinical benefit once they enter clinical phases, there is a need for a highly sensitive, selective, and well-validated method to quantify their distribution in animal models. In addition such a method would be a powerful tool for biodistribution studies in the preclinical stage leading to better assessment of the safety of injected cells by allowing detection of cells in peripheral organs not deliberately targeted by the therapy.
Hybridization in situ or immunohistochemistry is routinely used to visualize human cells distributed into targeted organs, but these methods are difficult to standardize and lead to semiquantitative results only. The distribution of transplanted cells in solid organs can be highly heterogeneous. In the liver in particular, a recent study has shown that portal venous blood supply is itself inhomogeneous leading to unequal distribution of infused cells (31). As a consequence, quantification of cell implantation on tissue sections would require analysis of high numbers of sections and high numbers of microscopic fields. Such studies are extremely laborious and still do not provide statistical significance, although software-supported data analysis might allow processing of increasingly larger numbers of sections and cells.
In contrast, qPCR could support quantitative and sensitive detection methods to track human cells after infusion into animal models. Several groups have developed methods based on amplification of various human-specific genes. Single-copy genes (7,10,30) and repeated sequences of various lengths (5,7,16,34) have been utilized to derive PCR primers and PCR-based detection methods.
Together with variable number tandem repeat and short tandem repeat detection has been routinely used for the quantification of chimerism in bone marrow or hematopoietic stem cell-grafted patients. Unfortunately, the sensitivity of these methods does not allow the detection of less than a few percent of remaining host cells within allogeneic grafted cells (12,24). A useful method to study implantation and biodistribution of human cells in animal models must detect less than 1% transplanted cells within host cells, as the infused cells correspond to such approximate percentage of the liver mass. Cheng and Gupta (7) have compared the sensitivities of four amplification reactions and shown that amplification of human sex-determining region on Y (SRY) was more sensitive to detect human DNA in mouse tissue than methods based either on amplification of a single copy gene or of short tandem repeats located in HLA loci. As referred by Wang et al., they could detect one male cell in 10,000 female host cells according to a standard curve made of human and mouse DNA mixes (7,34). The higher sensitivity of the SRY assay likely resides in multiple representations of sequences within the SRY locus (8). Despite a higher sensitivity, the SRY qPCR assay was unable to detect human cells in transplanted mouse livers beyond 24 h posttransplantation.
As a corollary, repeated sequences like satellite sequences or Alu sequences have been targeted with the aim to develop universally applicable and highly sensitive detection methods both effectively reporting lower detection limits (5). Alu sequence qPCR assays were developed as a tool to quantify human DNA in forensic samples and as such were properly validated to ensure sensitivity, selectivity, and reproducibility (20,21). The method allowed detection and quantification of human DNA amounts as low as 1 pg, which is much lower than any of the aforementioned assays. However, it was not designed to detect human DNA in a matrix of rodent DNA. In addition, early days Alu qPCR assays suffered from an important level of contamination obscuring the interpretation of data obtained with other species DNA matrices (20,25).
The present study has been devoted to developing a sensitive qPCR method to quantify adult-derived human liver stem/progenitor cells (ADHLSCs) in mouse or rat xenotransplantation models. This assay is based on Alu sequence detection, a universal primate-specific marker that represents 6-13% of the haploid genome (18). AluYb8 amplification has been chosen based on the excellent sensitivity of the assay and its limited cross-reactivity with other species DNA (33). qPCR conditions have been optimized to limit false-positive reactions linked to contamination issues and as such to deliver an extremely selective assay toward human versus mouse and rat DNA (32). Specificity, linear range, precision, and limit of detection (LoD) of the assay have been determined. Several standard curves of mixed DNA and mixed cells have been qualified to establish the number of human cells in chimeric samples. Finally, we provide data from in vivo experiments illustrating that the present method can discriminate percentages of human cells in a matrix of rodent tissue far lower than 1%.
Materials and Methods
Animals
Adult Wistar rats and Rag2-/-Il2Ry-/- mice were used at 6-8 weeks of age and were purchased from the animal facilities of the UCL School of Medicine (Brussels, Belgium) and Taconic (Lille Skensved, Denmark), respectively. All animal studies were authorized by the Animal Ethics and Welfare Committee of the Université Catholique de Louvain and were treated in accordance with FELASA guidelines.
Isolation of Rodent Hepatocytes and Human Adult Liver Progenitor Cells
Isoflurane 2% (Forane®; Abbot GmbH & Co, Wiesbaden, Germany) was used for animal anesthesia. We isolated rat and mouse liver parenchymal cells using a two-step collagenase P (1100 units/L) (Roche, Mannheim, Germany) perfusion procedure according to the Seglen method (26). A hepatocyte-enriched cell fraction was obtained following low-speed centrifugation at 50 χ g for 3 min at 4°C (Eppendorf AG, Hamburg, Germany). The trypan blue exclusion test (Sigma-Aldrich, St. Louis, MO, USA) was used to evaluate cell viability, which was between 65% and 82% regardless of the species. Hepatocytes were pelleted as samples of 1 million cells and were stored as dry pellets at −80°C.
Human nonfetal liver progenitor cells, referred to as ADHLSCs were isolated from the liver of a week-old male cadaveric donor as described elsewhere (19). Cells were cultured in DMEM supplemented with 10% FBS and 1% penicillin-streptomycin (all from Life Technologies, Gent, Belgium).
qPCR Assay
Genomic DNA was extracted from cells and tissue using the QIAamp DNA blood and tissue mini kits respectively (Qiagen, Hilden, Germany), according to the manufacturer's instructions. Tissue samples were first disrupted with FastPrep® Lysing Matrix D (MPbio, Brussels, Belgium) in Qiagen ATL buffer before digestion with proteinase K (Qiagen). DNA concentration and quality were assessed by absorbance (Nanodrop; Thermo Scientific, Wilmington, DE, USA) and verified by qPCR assays using mouse b-actin gene (Actb) (14) and rat aryl hydrocarbon receptor gene (Ahr) (1) as reference genes (Table 1. Note that the sequence of reverse Actb primer contains a mismatch (G instead of C in position 17). All necessary control experiments have been performed to guarantee that this mismatch does not alter the specificity of the primer. Indeed, melting curves generated using mouse DNA showed that the primer pair gave rise to a single amplicon of the expected size. In addition, its specific hybridization was tested, as the primer was used in qPCR reactions, using from 0.01 to 100 ng of mouse or human DNA. While amplification of mouse DNA was indeed observed, no qPCR product could ever be detected if human DNA was used, even when large amounts of human DNA were used, which confirms specific hybridization to mouse DNA (data not shown).
Primers for qPCR Assay
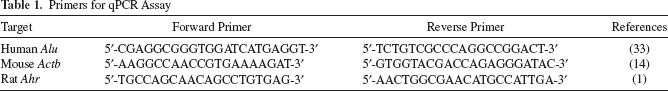
PCR was performed on a LightCycler480 (Roche Diagnostics, Penzberg, Germany). Human AluYb8 qPCR assays were performed in total volume of 25 μl containing LC480 Syber green I master mix (1χ) (Roche Diagnostics), 0.15 μM of each reverse and forward AluYb8 primers (33) (Table 1, and 5 μl of DNA. These primers hybridize with 100% sequence homology over the two primers with human Yb8 Alu sequences repeated within the genome and randomly located in untranslated regions of various genes. They also hybridize with overall 85% homology with human Alu-Sb1 subfamily and with lesser sequence homology with other Alu subfamilies. qPCR conditions were optimized as to prevent major nonspecific hybridizations. Indeed, several primer concentrations (0.05, 0.1, 0.2, 0.3, 1 μM) and annealing temperatures (from 60°C to 72°C) were tested to choose the best conditions to increase the signal over background ratio. A low primer concentration of 0.15 μM associated with annealing temperature of 62°C gave the best signal without aspecific rodent DNA amplification (data not shown). To prevent contamination by human DNA traces, sterile material was used to process in vivo samples, and we employed good laboratory practice and scrupulous attention to aseptic technique. qPCR reaction mixes were performed under a dedicated Plexiglas box to prevent airborne contamination. The box was equipped with a UV light source that was turned on before and after mix preparation in order to minimize contamination during PCR process. At least two negative controls without DNA (named “no template control”) were processed in each PCR plate to be sure the assay was free of contamination. As a result of careful optimization and handling, melting curves are effectively characterized by a single major peak (as documented in the Results section). For in vitro studies and method validation, human DNA was purchased from a commercial source (Roche Diagnostics), and a range from 10 ng to 10 fg was used. For in vivo studies, 100 ng or 200 ng of mouse/human or rat/human chimeric DNA samples were used, respectively. Reference gene qPCR assays were performed in the same conditions except that they used 1 μM of reverse and forward Actb primers for mouse DNA or 0.24 μM of reverse and forward Ahr primers for rat DNA. All primers used were synthetized by Invitrogen (Carlsbad, CA, USA). qPCR was performed by denaturation at 95°C for 10 min followed by 40 cycles of amplification at 95°C for 15 s, 62°C for 5 s, and 72°C for 15 s. Melting curves were generated immediately after PCR amplification using the following conditions: 95°C for 30 s and 60°C to 95°C with a temperature transition rate of 0.11°C/s. Results were analyzed with the LC480 Software (Roche Diagnostics) by the second derivative method, according to the Minimum Information for Publication of Quantitative Real-Time PCR Experiments guidelines for qPCR (6).
Specificity/Linear Range/Limit of Detection/Standards Curves
The specificity of the assay was first assessed by analyzing samples with 100% of rodent DNA. The limit of blank (LoB), LoD, and linearity of the qPCR assay were estimated by 10-fold dilutions of the standard human DNA in water (n = 10) or mixed in a constant amount of rodent DNA (n=3) over a range of 10 ng to 10 fg. The LoB is defined by the highest signal expected to be found when replicates of a blank sample containing no human DNA are tested (4). The LoD is defined as the lowest concentration of human DNA that gives a Cq value that can be reliably distinguished from the LoB in 95% of the replicates. PCR efficiencies were calculated according to the formula: Efficiency = 10(-1/slope) - 1 (6).
Three standards curves have been performed. (i) DNA mixing experiments: The standard curves were obtained by mixing decreasing amounts of human commercial DNA from 10 ng to 10 fg in water or in a constant amount of rodent DNA extracted from hepatic cells. (ii) Cell mixing experiments: The standard curves were obtained by mixing decreasing counts of ADHLSCs with rodent hepatic cells. A range of 105 to 50 ADHLSCs was prepared in PBS by serial dilutions and added to frozen rodent hepatic cells isolated by collagenase perfusion, to obtain 106 total cells per sample. (iii) ADHLSCs/rat liver mixing experiment: A range of 105 to 50 ADHLSCs was directly mixed in 25 μg of rat liver. DNA was then extracted from cell mixes or cell and tissue mixes using QIAamp DNA blood or tissue mini kits (Qiagen).
The approximate hepatic cell number, constituting of 25 μg liver tissue, was extrapolated based on the mean of 50 χ 106 hepatic cells/g of liver mass (2,15,28,35). Quantification of human cells was done based on cell mixing standard curves according to Cq value for AluYb8 amplification. Human cell percentages were thus calculated as the ratio of the number of human cells over an estimated number of 1.25 χ 106 rodent cells.
In Vivo Experiments
ADHLSCs were transduced at the second passage with lentivirus containing either the enhanced green fluorescent protein (kind gift from Dr. Karine Breckpot, Vrije Universiteit Brussel, Belgium) or a reporter protein containing monomeric red fluorescent protein (mRFP; CellSight Technologies, San Francisco, CA, USA) (23), to obtain 40% of transduced cells. Cells in culture were trypsinized (Invitrogen) after five passages, prior to injection and resuspended in DPBS (Lonza, Braine-l'Alleud, Belgium) containing 4% -N-acetyl-cystein (Lysomucil®; Zambon, Italy) at 10 χ 106 cells/ml for infusion.
Two Wistar rats were immunosuppressed by intraperitoneal injections of cyclosporine A (Neoral-Sandimmun®; Novartis, Vilvoorde, Belgium) at 5 mg/kg 2 days before and the day of cell infusion. Exactly 2.5 χ 106 and 1.5 χ 106 ADHLSCs were infused by intrahepatic route into the right median lobe and the right lateral lobe, respectively, for the first and the second rat (3). Animals were sacrificed 4 h after transplantation. Two sham controls were performed in the same condition without cell infusion.
Two groups of five Rag2-/-Il2Ry-/- mice were infused with 1 χ 106 ADHLSCs by intrasplenic route, immediately after completion of 70% hepatectomies. One group of mice was sacrificed 24 h after transplantation and the other 7 days after transplantation. Sham injections with the vehicle (formulation solution) only were performed in the same conditions. Statistical differences were determined by Student's t-test for two groups' comparison. Differences were considered significant when values of p <0.05.
Rat and mouse liver lobes were taken and either stored at −80°C prior to genomic DNA extraction or fixed for histological analysis.
Histological Analysis
Livers were removed at the time of sacrifice and fixed in formaldehyde 3.5% (Sigma-Aldrich) overnight before paraffin embedding. Then 4-um sections were depar-affinized and rehydrated in successive baths of xylol/isopropanol/95% ethanol and water. For direct analysis of fluorescence, sections were only incubated for 20 min with DNA counterstain 1:5,000 (DAPI; Sigma Aldrich) and coverslipped with ProLong® Gold Antifade Reagent (Invitrogen). The slides were observed by epifluorescence using a Zeiss Axiolmager Z1 fluorescent microscope and a 20χ objective. Images were analyzed using the Axovision 4.8 Software (Zeiss, Oberkochen, Germany).
Results
Linear Range and Specificity of the Method
Amplification and melting curves of the AluYb8 qPCR assay were analyzed and presented for one experiment in duplicate and triplicate, respectively, for human DNA (Fig. 1). Monitoring the amplification of 10-fold serial dilutions of human DNA from 10 ng to 10 fg revealed that the curves were parallel and shifted to higher Cq with decreasing amount of DNA (Fig. 1A). The assay was shown to be linear over a range of seven log magnitude. A specific amplification product was obtained, identified on Figure 1B by the peak centered at the melting temperature of 91°C.

Characteristics of AluYb8 qPCR amplifications of human and mouse DNA. (A) Amplification curves of reactions containing between 10 ng and 10 fg of human DNA by 10-fold step dilutions (curves 1 to 7) or 100 ng mouse DNA in water (curve 8) in duplicate. (B) Melting curves of AluYb8 amplification of 100 pg and 0.1 pg human DNA in triplicate, corresponding to curves 3 and 6 of (A), respectively. Curves 9 in (A) and (B) correspond to “no template control.”
As the method was designed to measure human DNA diluted within rat or mouse DNA, the specificity of the AluYb8 qPCR assay toward rat and mouse DNA had to be guaranteed. One thousand to 50 ng rat and mouse DNA were tested as template in the qPCR reaction to assess the potential cross-reactivity of the human AluYb8 primers (Table 2. Cross-reactivity of the primers toward mouse DNA was higher than toward rat DNA. In fact, aspecific detection was observed when 1,000 ng rat DNA was introduced into the reaction, while 200 ng of mouse DNA was sufficient to generate a false-positive signal (Table 2. To avoid overevaluation of samples containing low human DNA amounts, we chose 200 ng of rat DNA and 100 ng of mouse DNA as optimal input amounts.
Specificity of AluYb8 Amplification Reaction for Human DNA

Mean Cq values of AluYb8 amplification by qPCR performed in triplicate. The rat and mouse DNA concentration range was obtained by serial dilution in water. * Owing to overall inhibition of qPCR reaction by high amount of DNA, only one Cq value could be measured over the triplicate.
Repeatability and Reproducibility
Intra- and interassay precision were determined using 100, 1, and 0.1 pg of standard commercial human DNA. Intra-assay precision or repeatability was calculated by testing 10 replicates of each concentration in a single run (Table 3. Standard deviations were of 0.07, 0.16, and 0.31 at 100, 1, and 0.1 pg of input DNA, respectively. Interassay precision was assessed by repeating the testing of the same three amounts of input DNA over 20 separate experiments on different days. The intermediate dilutions of the stock DNA were done independently on the day of the assay. Standard deviations were 0.23, 0.30, and 0.56 for 100, 1, and 0.1 pg human DNA, respectively, demonstrating a very high precision between qPCR assays.
Repeatability and Reproducibility of the Method
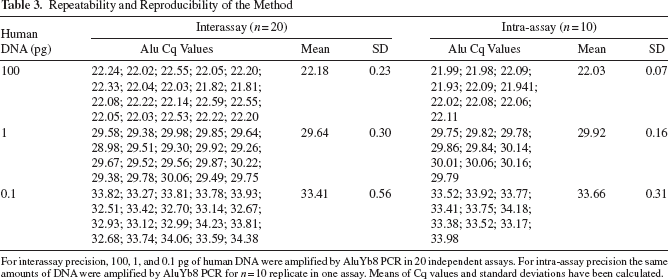
For interassay precision, 100, 1, and 0.1 pg of human DNA were amplified by AluYb8 PCR in 20 independent assays. For intra-assay precision the same amounts of DNA were amplified by AluYb8 PCR for n = 10 replicate in one assay. Means of Cq values and standard deviations have been calculated.
Limit of Detection and Standard Curves for Human Cell Quantification
Standard curves of human DNA in water (n = 10) or mixed in a constant amount of rodent DNA (n=3) were generated, where Cq values were plotted versus DNA amounts shown on a logarithmic scale (Fig. 2). DNA standard curves in water or in rodent DNA were highly similar. Standard curves were compared using a single global linear model including three intercepts (i.e., one intercept for each template) and three slopes (by including an interaction factor between the concentration and the template). Differences between intercepts were tiny [difference (95% CI) = 0.23 (-0.02, 0.48) for mice DNA vs. water DNA, difference=-0.18 (-0.40, 0.03) for RAT DNA vs. water] as well as differences between slopes [difference=-0.01 (-0.12, 0.11) for mice DNA vs. water DNA, difference=0.09 (-0.01, 0.19) for RAT DNA vs. water]. Each linear regression model showed an excellent determination coefficient (R2>0.99), and very similar slopes of −3.77, −3.78, and −3.68 were observed for the DNA standard in water, in mice, or in rat DNA, respectively (Fig. 2). This corresponds to PCR efficiencies ranging from 83.9% to 86.9%. Such low, but acceptable, efficiencies could be explained by the use of a very low primer concentration chosen so as to avoid aspecific amplification and by a moderate competition for a second target sequence as indicated by the presence of a second amplification product apparent on melting curves (smaller peak at 84.5°C in Fig. 1B). Together, these results showed that characteristics of the qPCR assay were conserved irrespective of the matrix used to dilute human DNA.

Linear regression analysis of the AluYb8 qPCR assay and comparison of standards for human cell quantification. Linear regression of Cq values for AluYb8 qPCR assay. Serial dilutions from 10 ng to 0.01 pg of human DNA per reaction were performed in water (n = 10) (A), in mouse DNA (100 ng, n = 3) (B), or in rat DNA (200 ng, n = 3) (C). Standards for human cell quantification were compared for mice (D) and rat (E, F) matrix (Alu Cq values are means of two standards performed in triplicate for each condition). Chimeric DNA per reaction, 100 ng or 200 ng, was used for mice and rat samples, respectively. Graphs D-F show standards of DNA mixing curves (circles), cell mixing curves (triangles), or human cells mixed in 25 μg of rat liver (diamonds). Mean Alu Cq values were represented as a function of human DNA quantity (pg) (A-C) and, for cell mixing, as a function of the percentage of human DNA in the sample expressed on a logarithmic scale (B-F). Limit of blank corresponds to the Cq value above which data were considered as negative. Each graph shows linear regressions in black, while gray lines indicate standard deviation. Equations of linear regressions and correlation coefficients are given on each graph.
All blank samples produced Cq values >35 (undetermined) so the LoB was defined as 35 Cq. It is of note that amplification of DNA traces occurred in the NTC giving rise to Cq >35 (curve 9, Fig. 1) because of the very high sensitivity of the method and in agreement with the literature (32). As shown in Figure 2A to C, the LoD of the standard curves in water, in mouse, or in rat DNA were estimated between 0.1 pg and 0.01 pg. At 0.1 pg human DNA, all Cq values were <35 (LoB). In contrast, amplification of 0.01 pg of human DNA produced Cq values >35, which were thus undetected.
There are several quantification methods in the literature, so DNA mixing standards were compared to cell mixing standards. Decreasing amounts of ADHLSCs were either mixed in 1 million rat or mouse hepatic cells or added to 25 mg of rat liver before proceeding to DNA extraction from various cell or cell/tissue mixes (Fig. 2D-F). AluYb8 qPCR assay was performed either with 200 ng rat/human or with 100 ng mouse/human chimeric DNA samples.
According to Figure 2, the LoD as determined by cell mixing experiments is 0.02% rather than 0.0005% or 0.001% based on DNA mixing in rat or mice matrix, respectively. The range is linear up to 200 human cells, and regression lines up to this point have a slope of −4.77 and −4.86 for rat and mice standard, respectively (R2>0.98 in both cases). We found that the standards obtained with 1 million isolated hepatic cells or a piece of 25 mg rat liver were essentially equivalent as the two curves were superimposed (Fig. 2F) with similar slopes of −4.77 and −4.72. Standard curves generated from dilution of human cells in rat cells and in rat liver were compared using a single global linear model including two intercepts and two slopes. Differences between intercepts were tiny [-0.58 (-0.99, 0.17)] as well as differences between slopes [0.06 (-0.33, 0.45)]. This confirmed that 25 μg of liver corresponds to approximately 1.25 χ 106 hepatic cells and that the two standard curves are equivalent.
PCR efficiencies decreased from around 85% for DNA mixing down to around 62% for cell mixing. Such differences observed between DNA mixing and cell mixing standard curves could be due to the accumulation of small systematic errors at each step of the chimeric sample preparation. Human DNA quantity and quality in cell mixing samples is more variable than in DNA mixing samples, which can dramatically affect final Cq values. The presence of inhibitory factors released from rodent hepatic cell lysis could account for this loss of efficacy. Moreover, hepatocytes are polynucleated cells. Thus, compared to direct DNA mixing, human DNA would end up more diluted in DNA extracted from rodent hepatocytes than from any other cell type. These issues will be further addressed in the Discussion. Performing cell mixing experiments with a higher number of rodent hepatic cells could potentially induce a vertical downward shifting of the standard curve and consequently decrease the LoD. However, the total number of cells is limited by the capacity of the DNA extraction column. The cell mixing standard curves estimated in the present study should therefore be used when DNA is extracted from a total number of 1 χ 106 cells or 25 μg of rodent liver.
Quantification of Human Cells in Transplanted Wistar Rats
Two doses of ADHLSCs (2.5 and 1 million cells) were transplanted by intrahepatic route in two Wistar rats that had been injected twice with cyclosporine A to minimize immune rejection. Four hours after transplantation, their liver lobes were explanted, and several pieces of the injection site and adjacent sites or lobes were sampled for DNA extraction (Fig. 3A). AluYb8 qPCR results confirmed the presence of human cells in different proportions depending on the samples. Four hours postinjection, human cell distribution appeared very heterogeneous, even over the three pieces taken at the injection sites. Indeed, in the rat transplanted with 2.5 million cells (Fig. 3B), we measured between 172,000 and 25,000 human cells at the injection site (samples RML 1.1, 1.2, and 1.3), which corresponds to 12% and 1.5% human cells in two adjacent samples of 25 μg rat liver mass. Eleven thousand and 16,000 cells were detected further in the same lobe (samples RML 2 and 3). In other lobes (samples RLL, LLL, and CL), human cells were either undetected or close to the LoD (0.02%).

Quantification of ADHLSCs in rat liver 4 h after intrahepatic transplantation. (A) Rat liver schematic, modified from Aller et al. (3), indicating locations of intrahepatic injections as performed in rat 1 with 2.5 χ 106 ADHLSCs (white arrow) and in rat 2 with 1.5 χ 106 ADHLSCs (black arrow). The different lobes are noted RML (right median), LML (left median), LLL (left lateral), RLL (right lateral), and CL (caudate). PV, portal vein; HA, hepatic artery; CBD, common bile duct. (B-C) Results of qPCR assay performed in triplicate with 200 ng of DNA extracted from 25 μg samples from rat 1 (B) and rat 2 (C), quantified according to the cell mix standard. Suffixes 1.1, 1.2, and 1.3 indicate three adjacent samples of the injection site. Suffixes 2 and 3 indicate samples from the injected lobe distal from the injection site.
Similar results were obtained with the second rat injected with a lower dose of 1.5 χ 106 cells (Fig. 3C). A maximum of 92,300 ADHLSCs (7.4%) (sample RLL 1.2) was found at the site of injection (samples RLL 1.1, 1.2, 1.3), and decreasing amounts were measured as sampling moved away from the injection site (with 0.16% and 0.02% for RLL 2 and 3, respectively). In this case, no human cells could be detected in the caudate lobe (CL). These results show a good correlation between the numbers of cells detected in the livers 4 h after transplantation and the numbers of injected cells. On average over the three samples measured at the injection site, we found 64,000 and 35,000 human cells in the rat hepatic tissue transplanted respectively with 2.5 and 1.5 million human cells, which would correspond to an average of 5.1% and 2.8% of human cells in rat liver retained only at the injection site.
To confirm qPCR results, the remaining liver of the second rat was used to visualize engrafted ADHLSCs, transduced with a reporter gene expressing mRFP, by histological analysis (Fig. 4). Human cells were more represented in the lobe of injection (RLL) and appeared organized in clusters (Fig. 4D). Less than 10 scattered ADHLSCs were detected in the LLL section (Fig. 4C), and no cells were observed in the control and CL sections (Fig. 4A, B). These figures, in accordance with each other and with qPCR results, confirm that AluYb8 amplification allows specific quantification of the presence of human cells in rat liver with a quantification limit as low as 0.02% of the total hepatic cells mass.
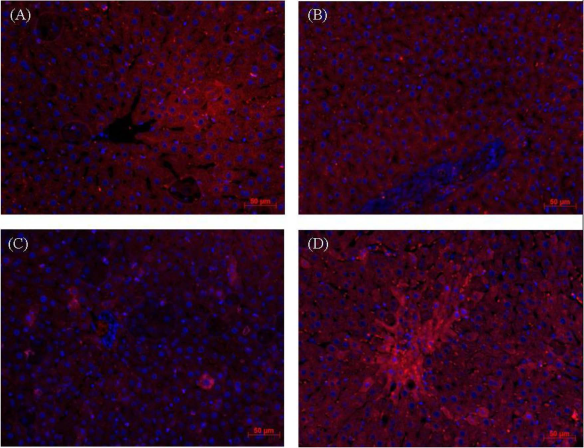
Detection of human cells in transplanted rat liver tissue by histological analysis. Rat livers were harvested 4 h after transplantation. Sections were stained with DAPI. mRFP expressed by transduced ADHLSCs administered via intrahepatic transplantation in rat 2 right lateral lobe (RLL) was visualized at 568 nm (original magnification 20χ). (A) Control: uninjected rat liver. (B) Caudate lobe of rat 2. (C) Left lateral lobe of rat 2. (D) Injected lateral lobe (RLL) of rat 2.
Quantification of Human Cells in Rag2-/-Il2RY-/- Mice
Rag2-/-Il2R7-/- mice were subjected to 70% partial hepatectomy to induce hepatic recovery. Mice were transplanted by intrasplenic route right after hepatectomy with 1 χ 106 ADHLSCs, that is, 1.6% of the total liver mass. One group of five mice was sacrificed 1 day after transplantation, and one group of five mice were sacrificed 7 days after transplantation. Eight mice were actually injected in this group to compensate early mortality resulting from large hepatectomy followed by cell transplantation. Human cell retention in the liver was quantified by AluYb8 qPCR (Fig. 5). One day after transplantation, between 21,000 and 59,000 human cells were measured in 25 μg of mouse liver, which would correspond to 2.14% and 3.88% of human cells. One week after transplantation, we quantified between 5,200 and 27,000 remaining human cells in mouse livers, that is, 0.66% to 1.71% when reporting human cells to mouse hepatic cells. All mice in the sham group had no detectable human DNA signal, which makes the results at day 1 and day 7 highly significant. The percentage of ADHLSC engraftment in the mouse liver decreased significantly between the first and the seventh day, dropping from an average of 2.53% (2.14-3.88%) to 1.00% (0.66-1.71%; p=0.0036; CI=95%) (Fig. 5). These results suggest that ADHLSCs transplanted by intrasplenic route in immunodeficient mice have been brought to the liver by the portal blood flow but have not yet achieved irreversible engraftment 1 day after transplantation. At this timepoint, exogenous cells might rather be trapped into the fine vasculature and in the sinusoids where they still could be cleared from by Kupffer cells. This confirms previous observations made in the laboratory although they were made in mice that had not been subjected to a regeneration stimulus (11). In this case, a large proportion of ADHLSCs would still be eliminated between 7 days and 1 month after transplantation. In the presence of chemoattractants released in response to a regeneration stimulus, it is likely that, 7 days posttransplantation, a majority of cells will effectively have integrated into the parenchyma, but this requires formal demonstration.
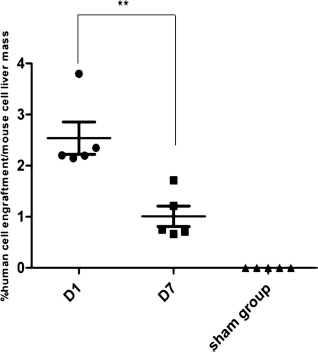
Quantification of human progenitor cells in mice liver 1 day and 1 week after intrasplenic transplantation. The liver of transplanted mice were explanted 1 day (D1) and 7 days (D7) after transplantation of 1 million ADHLSCs and compared to the sham group (five mice per group). DNA was extracted from 25 μg of sample, and 100 ng DNA was amplified by qPCR assay. Mean of Alu Cq values over the five mice of each group were used to calculate human cell numbers in mouse liver samples according to the standard of human cells mixed in 1 million mouse hepatocytes as shown in Figure 2D. The rate of human cell engraftment between D1 and D7 group was significantly decreased (**p = 0.0036) according to a t-test.
Discussion
Measuring engraftment following xenotransplantation of human cells in rodent models requires a robust quantification method to detect very low levels of implanted cells. High sensitivity qPCR based on repeated sequence detection appears as a method of choice. Despite high background levels, Alu-based qPCR was used successfully to support the detection of human cells in mice transplanted with human tumor cells (25). In that case, human cell proliferation in vivo led to data significantly above background, which is not applicable in our case where nontumorigenic cells are transplanted.
In the present study, we developed a SybrGreen qPCR assay based on AluYb8 amplification. It allows detection and quantification of low percentages of ADHLSCs in mouse and rat xenotransplantation models. To improve the assay sensitivity over what was reported for previous Alu qPCR assays, the background levels had to be drastically reduced. This was achieved by optimization of the PCR mix using a low concentration of specific primers. We also paid attention to parameters as well as by tight control over all possible human DNA contamination in steps going from tissue sampling to reaction mix preparation by using good laboratory practice, aseptic technic, and UV irradiation before PCR process. As a result, we achieved a detection limit of 0.1 pg of human DNA in water or in rat or mice DNA. The amount of input DNA was chosen as the highest amount resulting in no background amplification.
The DNA mixing standard indicates that 0.1 pg human DNA could theoretically be detected in 200 or 100 ng rat or mouse DNA respectively, that is, 0.00005% or 0.0001% human DNA (Fig. 2B, C). Such a high sensitivity has not been reported so far and thus confirms the suitability of the present method to quantify low amount of human material in rodent tissues. If one considers that human mouse and rat genomes are equivalent in mass (approximately 6 pg genomic DNA per cell), this would translate, in cell equivalents, into a detection limit of 5 to 10 human cells in 1 million rodent hepatic cells. Considering that one cell contains approximately 6 pg of genomic DNA, our method thus allows the detection of the equivalent of 1/60 of a human genome, which is only made possible because it targets a highly repeated sequence. A majority of reports have considered that DNA mix standards were sufficient to extrapolate human cell proportions (7,16,30). However several groups concerned about low engraftment quantification have attempted to compare DNA mix standard curves with actual percentages of human cells engrafted in rodent tissues. Using a DNA mix standard curve, McBride et al. have found 10-fold lower engraftment of mesenchymal stem cells in neonatal mouse brains than that previously reported on the basis of in situ hybridization with a Y chromosome probe (16). Sixty days posttransplantation, they measured engraftment rates that did not reach more than 0.05%, although previous experiments showed large numbers of BrdU-labeled MSCs by immunostaining (13). Using SRY or TSPY for male cell detection into female background, Wang et al. also reported that their LoD dropped from 0.001% to 0.01% when using a cell mix instead of a DNA mix standard curve (34). Human DNA seemed underrepresented when DNA extraction was performed from a cell mixture containing a low proportion of human cells. Such an issue had been previously noticed, and to circumvent the problem and generate a cell mixing standard curve, Funkhouser et al. prepared separate lysates of human and mouse cells and extracted DNA once these lysates were mixed in known proportions (10).
A robust standard curve is the main element to allow correct quantification of human cell in rodent samples; thus, we compared DNA and cell mixing standards as the second type of standard better reflects ex vivo sampling. Indeed, decreasing amounts of ADHLSCs were either mixed in 1 million rat or mouse hepatic cells or added to 25 μg of rat liver (Fig. 2D-F) before proceeding to DNA extraction from various cell or cell/tissue mixes. Such a standard showed that no detection could be achieved for less than 200 human cells dispersed into 1 million rat or mouse hepatic cells, corresponding to a LoD of 0.02%. This result is highly satisfactory in view of the objective to achieve detection of human cells in proportions lower than 1%. However, the percentages of human cells are one to two logs off from the values obtained according to the DNA mixing curve (Fig. 2) and the LoD rises from 0.0001% to 0.02%. In addition, the different linear regressions are not parallel as indicated by the slopes of −4.77 for the cell mixing and −3.78 for the DNA mixing curves, confirming a higher loss of sensitivity at high dilutions and a decrease in qPCR efficiency.
Such a discrepancy could be partly explained by the fact that the liver parenchyma in which we measure human cell engraftment is made of a large proportion of polynucleated hepatocytes. Indeed, yields of DNA extraction from ADHLSCs were lower than from rat hepatocytes (not shown). In addition, the different steps necessary to obtain sampling from cells or tissues increase systematic error risks. Cell clumping, for instance, will make cell dilutions less accurate than DNA dilutions. It is known that DNA extraction yield is cell-type dependent. Isolated ADHLSCs dispersed into rodent cells or rodent tissue might deliver less DNA or DNA of a lesser quality/purity than rodent hepatic cells. One could think that some component released by massively present hepatic rodent cells would hinder human DNA extraction. Indeed, biological samples could contain inhibitory factors (heme or bilirubin, for example) that influence PCR reaction by inhibiting the polymerase, lead to nucleic degradation or capture, or even interfere with cell lysis during the DNA extraction step. Inversely, human DNA easily extracted from isolated cells might be too harshly treated by extraction conditions required for tissue digestion resulting in degraded human DNA. All factors would add up to result in the observed underrepresentation of human DNA into the DNA mix, which will reduce qPCR performance (22,29). DNA extraction and purification is a crucial step that largely influences qPCR results. Further studies will therefore need to assess and compare other methods of cell lysis (chemical, physical, combined or not with enzymatic system) and DNA purification (with and without columns).
The difference in LoD could be also due to the limitation of the DNA extraction column, which allows processing of a maximum of 1 million cells or 25 μg tissue. If cell mixes were performed in a higher number of rodent hepatic cells, one could potentially induce a vertical downward shift of the standard curves and consequently decrease the LoD. In any case, to be as close as possible to the ex vivo sampling conditions of the analysis, DNA mixing cannot be used as a relevant standard to quantify human DNA within a rodent DNA matrix. Only standards of human cells mixed in rodent hepatic cells, performed in the same conditions as ex vivo samples, should be used.
In this report, we successfully used the AluYb8 qPCR assay to quantify the proportion of human cells retained in two xenotransplantation models at early and later timepoints after transplantation. At 4 h after intrahepatic transplantation in rats, our results show that human cells represented 2.8% and 5.1% of the host liver mass in the samples collected at the injection site for the doses of 1.5 χ 106 and 2.5 χ 106 cells, respectively. At such a short timepoint posttransplantation, these values need to be considered more as retention than engraftment percentages. At this stage, a large proportion of these cells could still be eliminated by the inflammatory response. Indeed, we performed a small quantitative study in mice after 70% hepatectomy and confirmed that if 2.53% of human cells were still retained in the mouse liver 24 h after intrasplenic transplantation, this proportion significantly decreased to 1% 7 days after transplantation of 1 million cells (n = 5). In this case, the use of a large hepatectomy model results in proportions of human cells rising above 1%. Indeed our laboratory has previously estimated, based on immunohistological staining, that, in the absence of a regeneration stimulus, these cells represented only 0.05% of the liver mass of SCID mice 7 days after intrasplenic transplantation (11). Our data are also in agreement with the literature, since in a classical immunodeficient mouse model, subjected to diverse regeneration stimuli, repopulation of the liver was found to be about 1% (27). These percentages have to be gauged considering that the number of infused cells represent 1% or 2% of the whole liver mass. Thus, in the absence of injury and proliferation stimulus, if human cells were able to engraft homogeneously in mouse liver they could not represent more than 1% of total mouse liver. By contrast, in the 70% hepatectomy model, implantation and subsequent proliferation seem thus to be highly effective. AluYb8 qPCR-based results thus correlate well with histological analysis, confirming that this method, relying on genomic DNA analysis only quantifies live cells and not residues of human genomic DNA. Indeed, DNA fragmentation is induced by lysosomal acid DNAse(s) of phagocytic cells immediately after the apoptotic cells are engulfed (17). Moreover, various stimuli lead to the induction of a caspase-activated DNase that degrades chromosomal DNA in apoptotic cells (9). Thus, it is admitted that the presence of dead cells does not skew live cell quantification.
The major limitation of the present technique holds in sample size constraints. Indeed, as 25 μg of liver is the upper limit for the DNA extraction step to avoid column saturation, we found divergent results in terms of human cell proportions in different samples of the same liver lobe. This is not only due to the early timing of analysis but also linked with the intrahepatic transplantation route because the same phenomenon was observed in rats 1 week after intraportal vein transplantation (data not shown). Heterogeneity of the portal flow has been elegantly demonstrated, and heterogeneity of the transplanted cell distribution is thus naturally expected (31). In consequence, to obtain a global representation of human cell percentage over the whole liver, numerous 25 μg samples should be taken and analyzed by qPCR to average the numbers of human cells over all these samples. We are currently working on upgrading the method to be able to process and quantify larger pieces of liver if not whole mouse livers.
In conclusion, we describe here a robust and validated qPCR-based quantification of human cells and its standardization, making it amenable to support cell transplantation studies in rat and mouse models.
Footnotes
Acknowledgment
The current study was supported by the Région Wallonne and Promethera Biosciences SA. Julie Prigent is a FNRS recipient. The authors would like to thank Pr. Jean-Luc Gala for helpful discussions and for the use of the LightCycler®480 and the FastPrep®-24 instruments; Charles De Pierpont, Mayuri Sadoine, and Joachim Ravau for their technical help; Dr. Mustapha Najimi for the characterization of ADHLSCs; Dr. Catherine Lombard for reviewing the manuscript; and Dr. Karine Breckpot for her kind gift of lentivirus. The authors declare no conflicts of interest.