
Abstract
Previous studies showed that transplantation of cultured neural stem/progenitor cells (NSPCs) could improve functional recovery for various neurological diseases. This study aims to develop a stem cell-based model for predictive toxicology of development in the neurological system after acrylamide exposure. Treatment of mouse (KT98/F1B-GFP) and human (U-1240 MG/F1B-GFP) NSPCs with 0.5 mM acrylamide resulted in the inhibition of neurosphere formation (definition of self-renewal ability in NSPCs), but not inhibition of cell proliferation. Apoptosis and differentiation of KT98 (a precursor of KT98/F1B-GFP) and KT98/F1B-GFP are not observed in acrylamide-treated neurospheres. Analysis of secondary neurosphere formation and differentiation of neurons and glia illustrated that acrylamide-treated KT98 and KT98/F1B-GFP neurospheres retain the NSPC properties, such as self-renewal and differentiation capacity. Correlation of acrylamide-inhibited neurosphere formation with cell-cell adhesion was observed in mouse NSPCs by live cell image analysis and the presence of acrylamide. Protein expression levels of cell adhesion molecules [neural cell adhesion molecule (NCAM) and N-cadherin] and extracellular signal-regulated kinases (ERK) in acrylamide-treated KT98/F1B-GFP and U-1240 MG/F1B-GFP neurospheres demonstrated that NCAM decreased and phospho-ERK (pERK) increased, whereas expression of N-cadherin remained unchanged. Analysis of AKT (protein kinase B, PKB)/β-catenin pathway showed decrease in phospho-AKT (p-AKT) and cyclin D1 expression in acrylamide-treated neurospheres of KT98/F1B-GFP. Furthermore, PD98059, an ERK phosphorylation inhibitor, attenuated acrylamide-induced ERK phosphorylation, indicating that pERK contributed to the cell proliferation, but not in neurosphere formation in mouse NSPCs. Coimmunoprecipitation results of KT98/F1B-GFP cell lysates showed that the complex of NCAM and fibroblast growth factor receptor 1 (FGFR1) is present in the neurosphere, and the amount of this complex decreases after acrylamide treatment. Our results reveal that acrylamide inhibits neurosphere formation through the disruption of the neurosphere architecture in NSPCs. The downregulation of cell-cell adhesion resulted from decreasing the levels of NCAM as well as the formation of NCAM/ FGFR complex.
Keywords
Introduction
Stem cells are found in many tissues and are of crucial importance for maintaining tissue homeostasis and for tissue repair after injury (43). Neural stem/progenitor cells (NSPCs) are a subset of undifferentiated precursors that retain the ability to proliferate and self-renew and have the capacity to differentiate to both neuronal and glial lineages (49). NSPCs of rodent or human origin can be selectively expanded in serum-free medium supplemented with fibroblast growth factor (FGF) and epidermal growth factor (EGF) as neurospheres in vitro (31,38,45,46). Previous studies showed that transplantation of cultured NSPCs could improve functional recovery for various neurological diseases (9,13,21,26,27).
Self-renewal and differentiation of stem cells were regulated by the specialized microenvironment, or niche, in which these cells reside. Sonic hedgehog (Shh), Wnt/β-catenin, and receptor tyrosine kinase [RTK, e.g., fibroblast growth factor receptor (FGFR)] signaling pathways have been implicated to play a role in the process (19,49). Self-renewal is one property of neurospheres. Thus, neurosphere formation is frequently used as a standard for evaluating self-renewal ability in NSPCs and glioblastoma stem-like cells (GBM-SCs) from different origins, including human fetal brain or GBM tissues (22), as well as developing and adult mouse brains (38). The GBM-SCs share many properties with NSPCs that were isolated from either human or mouse brains (23).
The mechanisms of neurosphere formation are related to the cell proliferation and cell-cell adhesion, which means that neurospheres can form from the clonal progeny of single NSPCs, and/or from the adhered cells by cell-cell interactions initiated between NSPCs (17,41,10). Neural cell adhesion molecule (NCAM) is a member of the immunoglobulin-like superfamily, which mediates intercellular and cell-matrix interactions and activates FGFR-associated signaling pathways, such as extracellular signal-regulated kinase (ERK), protein kinase C, cAMP-dependent protein kinase, phosphatidylinositide 3-kinase (PI3K)/v-akt murine thymoma viral oncogene homolog (AKT), Fyn oncogene, and focal adhesion kinase (30,40). Downregulation of NCAM of murine melanoma cells and GBM-SCs resulted in sphere formation inhibition by NCAM siRNA or chemical treatment, which was related to FGFR-associated signaling pathways (4,30). Cross talk between adhesion molecules and RTK has important functional implications, and its deregulation can play a pathogenic role in a number of diseases, including cancer and neurological disorders (40).
Acrylamide, a water-soluble vinyl monomer, has been recognized as a neurological and a reproductive toxicant in humans and laboratory animals. It is frequently used in many applications in industry and in laboratories. It can be found in food processed at high temperatures and in tobacco smoke (15,37,47,51,54). The toxic effects of acrylamide on neurons have been investigated intensively, including the reduction of cell proliferation, the induction of apoptosis, the phosphorylation of p53 and ERK, the formation of perikaryal inclusion bodies, and the transduction of neurodegeneration-related signals (28,32,36,50). Acrylamide at high concentrations could inhibit cell proliferation and cyclin D1 expression of GBM cell lines (6,56).
Children are exposed to two to three times more acrylamide than adults (approximately 0.5 mg/kg body weight) (18,35,55). In addition, acrylamide has been identified in breast milk and can cross the human placenta, resulting in deficits in development and motor coordination before weaning (52). However, the developmental toxicity of acrylamide remains unclear. We demonstrated that pheochromocytoma, when treated with 0.5 mM acrylamide, would have a significant reduction of their neurite outgrowth (unpublished results). This in vitro observation seems to recapitulate the acrylamide-induced neuropathy observed in animal studies. Therefore, here, we developed a stem cell-based model for predictive toxicology of development in the neurological system after acrylamide exposure.
In the present study, mouse KT98 and two NSPCs, including KT98/F1B-GFP cells (human F1B promoter-derived mouse KT98 cells) and U-1240 MG/F1B-GFP cells (human F1B promoter-derived human U-1240 MG cells), were used to examine the neurosphere formation efficiency after acrylamide treatment. We have investigated the cytotoxic effects of acrylamide and the molecular mechanisms that are affected by acrylamide in neurosphere formation of NSPCs. The information obtained from this study should contribute to the understanding of how neurotoxins might perturb the interactions of NSPCs, and the system could be expanded for other neurotoxins that might impair the neurological system.
Materials and Methods
Reagents and Antibodies
Acrylamide, dimethyl sulfoxide (DMSO), ethanol, formaldehyde, sodium citrate, propidium iodide, Triton X-100, Tween 20, and ethidium bromide were purchased from Sigma-Aldrich (St. Louis, MO, USA); 3-(4,5-dimethylthiazol-2-yl)-5-(3-carboxymethoxyphenyl)-2-(4-sulfophenyl)-2H-tetrazolium (MTS) was from Promega (Madison, WI, USA); PD98059 was from Calbiochem (Gibbstown, NJ, USA); Tris (base) was from J.T. Baker (Phillipsburg, NJ, USA); skim milk powder was from Anchor (Auckland, NZ); HyQtase was from Thermo (South Logan, UT, USA); and RNase A was from Fermentas (Vilnius, Lithuania). All cell culture reagents and saline buffers were from Gibco (Rockville, MD, USA). Antibodies against sex-determining region Y-box 2 (Sox2), Musashi, and glial fibrillary acidic protein (GFAP) were from Chemicon (Billerica, MA, USA); β-catenin and NCAM were from BD Biosciences (San Jose, CA, USA); N-cadherin was from Invitrogen (Grand Island, NY, USA); dephospho-β-catenin (dp-β-catenin) and horseradish peroxidase (HRP)-conjugated secondary antibodies were from Millipore (Bedford, MA, USA); p-AKT, AKT, pERK, ERK, phospho-FGFR (pFGFR), phosphoglycogen synthase kinase 3 β (p-GSK3β), and cyclin D1 were from Cell Signaling Technology (Beverly, MA, USA); procaspase 3 was from Santa Cruz Biotechnology (Santa Cruz, CA, USA); FGFR1 was from Bioss (Woburn, MA, USA); glyceraldehyde 3-phosphate dehydrogenase (GAPDH) was from NOVUS (St. Charles, MO, USA); nestin, β III tubulin (β-tubulin III), and β-actin were from Abcam (Cambridgeshire, UK). The antibody against b III tubulin is commonly referred to as clone TuJ1.
Cell Culture
KT98 cells were a cell line derived from the brain of a 2-month-old male F1B-Tag (promoter 1B of FGF1 gene dictates the brain-specific expression of SV40 T antigen; Department of Internal Medicine, The Ohio State University, Columbus, OH, USA) transgenic mouse (7,38), about which we have previously published (23,38). U-1240 MG cells, a human GBM cell line, was provided by Dr. Bengt Westermark (Uppsala University, Uppsala, Sweden). KT98 and U-1240 MG cells were transfected with pF1B-GFP [promoter 1B of FGF1 gene dictates expression of the green fluorescent protein (GFP)], about which we have previously published (23,24), and the GFP-positive cells were isolated using fluorescence-activated cell sorting and are designated KT98/F1B-GFP cells and U-1240 MG/ F1B-GFP cells, respectively. KT98 cells were cultured in Dulbecco's modified Eagle's medium (DMEM)/F12 (1:1) containing 10% fetal bovine serum (FBS) and penicillin/ streptomycin. KT98/F1B-GFP cells were cultured in the KT98 medium and 500 μg/ml G418 (an antibiotic; Merck, Whitehouse Station, NJ, USA). U-1240 MG/F1B-GFP cells were cultured in minimal essential medium containing 10% calf serum and penicillin/streptomycin and 250 μg/ml G418. All cells were cultured at 37°C with 5% CO2.
Cell Treatments
Acrylamide stock solution (1 M) was prepared with water and filter sterilized (filters were purchased from Pall Corporation, Ann Arbor, MI, USA). Cell media containing different acrylamide concentrations (0, 0.1, 0.5, 1, 2, and 5 mM) were prepared and added to cells. The treated cells were cultured at 37°C with 5% CO2 for different time periods (0, 6, 12, 24, 48, and 72 h for MTS assay; 7 days for neurosphere assay). To determine the involvement of ERK phosphorylation in regulating acrylamide-inhibited neurosphere formation, cells were pretreated with 20 and 50 μM PD98059 for 1 h and were then treated with 0.5 mM acrylamide for another 7 days (for KT98 and KT98/F1B-GFP cells) or 10 days (for U-1240 MG/F1B-GFP cells) at 37°C with 5% CO2.
Cell Proliferation Assay
Cell proliferation was evaluated by MTS assay. Briefly, cells were plated in a 96-well microtiter plate (Corning Inc., Corning, NY, USA) at a density of 1 × 10³ cells per well in a final volume of 100 μl of culture medium. These cells were treated with different acrylamide concentrations (0, 0.1, 0.5, 1, 2, and 5 mM) for different time periods (0, 6, 12, 24, 48, and 72 h) at 37°C with 5% CO2. After the acrylamide treatment, 20 μl MTS was added to the cells in each well for 2 h. The enzymatic reduction of MTS to formazan was quantified by Spectra MAX190 photometer (Molecular Devices, Sunnyvale, CA, USA) at 490 nm.
Neurosphere Assays
Cells were seeded at a density of 1,000 per dish [60 mm (Corning)] with neurosphere medium (DMEM/F12 supplemented with B27, 20 ng/ml EGF, 20 ng/ml FGF2, and 2 μg/ml heparin) with or without acrylamide for 7 days (for KT98 and KT98/F1B-GFP cells) or 10 days (for U-1240 MG cells) in vitro. The neurospheres (termed primary spheres) larger than 100 μm in each dish were counted by microscope observation. For secondary sphere formation (resphering experiment), single cells were harvested after HyQtase dissociation, which dissociated from 0 and 0.5 mM acrylamide-treated primary neurospheres. Cells were seeded at a density of 1,000 per dish (60 mm) with neurosphere medium (DMEM/F12 supplemented with B27, 20 ng/ml EGF, 20 ng/ml FGF2, and 2 μg/ml heparin) without acrylamide for 7 days (for KT98 and KT98/F1B-GFP cells) or 10 days (for U-1240 MG cells) in vitro. The neurospheres larger than 100 μm in each dish were counted by microscope observation (Olympus, Tokyo, Japan).
Neural Differentiation Assays
After the neurospheres were treated with acrylamide, single cells were dissociated from the acrylamide-treated neurospheres using HyQtase and then harvested. These cells were cultured in chamber slides (Nalge Nunc International, Naperville, IL, USA) with neural cell differentiation medium (DMEM/F12 supplemented with 2% FBS) in the absence of acrylamide for 10 days at 37°C with 5% CO2. After 10 days, neuron and glia cell verification was determined by using immunofluorescence staining.
Live Cell Image Observation
Neurosphere formation of KT98 and KT98/F1B-GFP cells with or without acrylamide treatment was observed using time-lapse video microscopy (Olympus). Cells were incubated in neurosphere medium with or without acrylamide for 7 days and placed on the stage of an inverted motorized microscope (IX81; Olympus) in a cage incubator at 37°C. Phase-contrast images were collected every 30 min over a 168-h (7-day) period.
Cell Cycle Analysis
Cell cycle phase distribution was analyzed using a hypotonic lysis method (34) by flow cytometry. Single cells were obtained from acrylamide-treated primary neurospheres by HyQtase dissociation and were used in cell cycle analyses. To determine the cell cycle profiles, 1 × 10⁶ cells were harvested and washed once with cold phosphate-buffered saline (PBS). The cell pellet was harvested by centrifugation (300 × g, 5 min), and supernatant was removed. The cell pellet was treated with 500 μl hypotonic lysis buffer (0.1% sodium citrate, 0.1% Triton X-100, 100 μg/ml RNase A, and 50 μg/ml propidium iodide) at 4°C for 20 min in the dark. Finally, cells were analyzed for DNA content with a BD FACS/Calibur flow cytometer (BD Bioscience, Miami, FL, USA). The data were analyzed with the BD CellQuest Pro software (BD Bioscience).
Reverse Transcription-PCR
Expression of mRNA levels was evaluated by reverse transcription-polymerase chain reaction (RT-PCR), which was carried out according to our previous protocol (24). Total RNA extracted (500 ng per sample) from acrylamide-treated KT98 or KT98/F1B-GFP neurospheres was primed with oligo (dT) primer and reverse-transcribed using SuperScriptII reverse transcription (Invitrogen) according to the manufacturer's instructions. The cDNA levels from RNA were amplified using specific primer pairs with Taq DNA polymerase (Roche Applied Science, Indianapolis, IN, USA) under the conditions of initial denaturing at 95°C for 10 min, followed by 30 cycles denaturing at 95°C for 30 s and extension at 57°C for 30 s, and finally extension at 72°C for 1 min for completing the polymerization. The specific primer pairs used in the PCR were as follows: mouse Sox2, 5′-AGAACCCCAAGA TGCACAA-3′ and 5′-ATGTAGGTCTGCGAGCTGGT-3′; nestin, 5′-GCGCTGGAACAGAGAT TGGA-3′ and 5′-AGGTTGGATCATCAGGGAAG TG-3′; β-tubulin III, 5′-CGAGACCTACTGCATCGACA-3′ and 5′-GG GATCCACTCCACGAAGTA-3′; microtubule-associated protein 2 (MAP2), 5′-GGATGGGCTTGTGTCTGATT-3′ and 5′-CTGGACCCACTCCACAAACT-3′; GAPDH, 5′-AACTTTGGCATTGTGGAAGG-3′ and 5′-CCCTGT TGCTGTATCCGTAT-3′. The PCR products were size fractionated on an agarose gel (Invitrogen) and visualized by ethidium bromide staining and photographed.
Western Blot Analysis
Antibodies against procaspase 3 (1:500), Sox2 (1:1,000), nestin (1:1,000), Musashi (1:1,000), NCAM (1:2,000), N-cadherin (1:1,000), pERK (1:1,000), ERK (1:2,000), p-AKT (1:1,000), AKT (1:1,000), p-GSK3β (1:1,000), dp-β-catenin (1:1,000), β-catenin (1:1,000), cyclin D1 (1:1,000), pFGFR (1:1,000), GAPDH (1:2,000), and β-actin (1:2,000) were used to detect the corresponding protein levels by the immunoblotting method in acrylamide-treated neurospheres in three NSPCs. Protein samples from acrylamide-treated neurospheres were harvested by radioimmunoprecipitation assay lysis buffer (Millipore, Billerica, MA, USA) supplemented with 100 μl/ml of protease inhibitor cocktail (Sigma-Aldrich). Protein concentrations were determined by a Bio-Rad Laboratories protein assay reagent kit (Hercules, CA, USA). Protein (20 or 40 μg) was resolved by a discontinuous 5% stacking and 8% running sodium dodecyl sulfate-polyacylamide gel and transferred to a polyvinylidene fluoride membrane (Bio-Rad Laboratories). Thereafter, membranes were blocked in 5% skimmed milk or 5% bovine serum albumin (Bio Basic, Markham Ontario, Canada) blocking buffer for 30 min at room temperature. The membranes were then incubated with specific primary antibodies in either 5% skimmed milk or 5% bovine serum albumin blocking buffer followed by incubation with corresponding HRP-conjugated secondary antibodies (1:20,000). Protein levels were detected with a Western lightning kit (PerkinElmer, Boston, MA, USA) with GAPDH or β-actin as an internal control.
Immunofluorescent Staining
Cells were grown on chamber slides (Nunc, Naperville, IL, USA) at 37°C with 5% CO2. For immunofluorescent staining, cells were washed with PBS and fixed with 3.7% (v/v) formaldehyde in PBS for 15 min at room temperature. Cells were then permeated with 0.3% (v/v) Triton X-100 in PBS for 5 min at room temperature. Thereafter, cells were incubated with primary antibody against β-tubulin III (1:500) and GFAP (1:500) in culture medium for 3 h at room temperature. Subsequently, the cells were incubated with fluorescein isothiocyanate-conjugated secondary antibody (1:200; Millipore) in culture medium with 0.3% 4′,6-diamidino-2-phenylindole (DAPI) (Invitrogen) for 45 min at room temperature and observed under a fluorescent microscope (Olympus).
Coimmunoprecipitation
Neurosphere lysate (250 mg) was incubated with 2.5 μg of rabbit anti-FGFR1 antibody on a roller mixer overnight at 4°C. After that, 20 μl of protein G sepharose (Amersham Biosciences, Little Chalfont, Buckinghamshire, UK) was added and incubated on a roller mixer at 4°C for 4 h. The samples were centrifuged at 12,000 × g for 30 s and were washed with tris-buffered saline three times. The samples were boiled in 20 μl of 5× sample buffer (Bionovas, Toronto, Canada) for 5 min. Proteins were collected by centrifugation at 12,000 × g for 1 min for Western blotting analysis.
Statistical Analysis
The data are expressed as mean ± SD. The statistical significance was determined by the one-way analysis of variance (ANOVA) followed by the Bonferroni multiple comparison test by a statistical package for the social science 13.0 software (SPSS, IBM, Armonk, NY, USA). The differences were considered statistically significant when p < 0.05.
Results
Acrylamide Inhibited Proliferation in KT98 and KT98/F1B-GFP Cells
Concentrations of acrylamide-inhibited cell proliferation were evaluated by MTS assay in the cell culture, wherein cells were attached on the plate and grown in cell culture medium with acrylamide (0, 0.1, 0.5, 1, 2, and 5 mM) for 72 h. Significant inhibition of MTS assay was found in both cell types when treated with acrylamide for 72 h at concentrations of 1, 2, or 5 mM (p < 0.001) (Fig. 1). The results showed that acrylamide treatments inhibited the proliferation of KT98 and KT98/F1B-GFP cells in a time- and dose-dependent manner.

Acrylamide inhibited proliferation of KT98 and KT98/F1B-GFP cells. Acrylamide inhibited the proliferation of the KT98 and KT98/F1B-GFP cells in a time (0, 6, 12, 24, 48, and 72 h)- and concentration (0, 0.1, 0.5, 1, 2, and 5 mM)-dependent manner when analyzed by MTS assay. Results are presented as the mean ± SD from three independent experiments. Statistical differences of each acrylamide concentration with the control (0 mM) are shown as *p < 0.05, **p < 0.01, ***p < 0.001.
Neurosphere Formation Capacity Is Inhibited by Acrylamide Cotreatment in Mouse NSPCs
Based on the MTS assay results, the two lowest doses of acrylamide (0.1 and 0.5 mM), which showed no cell proliferation inhibition, were chosen for neurosphere formation evaluation. The 0, 0.1, and 0.5 mM acrylamide-treated KT98 and KT98/F1B-GFP single cells were collected and transferred to neurosphere medium without acrylamide to evaluate neurosphere formation efficiency, respectively. Results showed no significant difference among the 0, 0.1, and 0.5 mM acrylamide-treated cell samples in neurosphere number of both cell types (Fig. 2). The results revealed that the 0, 0.1, and 0.5 mM acrylamide treatment caused no proliferation inhibition and no neurosphere formation efficiency reduction in mouse NSPCs.

Neurosphere-formation efficiency was not affected when KT98 and KT98/F1B-GFP cells were pretreated with acrylamide. Results are presented as the mean ± SD from three independent experiments. Statistical differences are shown as *p < 0.05, **p < 0.01, ***p < 0.001. Abbreviation: ACR, acrylamide.
To test the acrylamide effects on self-renewal of NSPCs, we evaluated the neurosphere formation efficiency by different concentrations (0, 0.1, 0.5, and 1 mM) of acrylamide cotreatments in neurosphere formation. In the experiment, 1 mM acrylamide cotreatment was used as a control group. At this concentration, there is a complete cell proliferation inhibition, which results in no self-renewal as evaluated by neurosphere formation. The neurosphere formed from single cells and induced by neurosphere medium with or without acrylamide for 7 days in mouse KT98 and KT98/ F1B-GFP cells. In this experiment, we used cotreated cells as opposed to using pretreated cells in Figure 2. As shown in Figure 3A, neurosphere number was significantly reduced at 1 mM acrylamide treatment of KT98 cells (from 108 to 0, p < 0.001) and at 0.5 mM and 1 mM acrylamide treatment of KT98/F1B-GFP cells (from 53 to 23.6, p < 0.05; from 53 to 0, p < 0.001) when compared with untreated control (0 mM). Consistently, results from neurosphere morphology and neurosphere-forming images observed under the microscope in both cells types also showed that 0.5 mM acrylamide treatment produced much fewer and smaller neurospheres than the untreated controls (Fig. 3B, C; the video from live cell image microscope observation is available upon request).

Neurosphere formation efficiency was inhibited by acrylamide treatments in mouse NSPCs. Neurosphere number decreased by treatment with different acrylamide concentrations (0, 0.1, 0.5, and 1 mM) using neurosphere formation assay (A). Representative images of neurospheres with different acrylamide concentrations (0, 0.1, and 0.5 mM) are shown (scale bar: 200 μm) (B). The time-lapse video pictures under different concentrations (0 and 0.5 mM) of acrylamide treatments are presented. Arrows indicate the presence of neurospheres (C). Results are presented as the mean ± SD from three independent experiments. Statistical differences are shown as *p <0.05, **p <0.01, ***p < 0.001. Abbreviation: ACR, acrylamide.
Taken together, these results indicated that neurosphere formation efficiency of mouse NSPCs was significantly reduced by acrylamide treatment in neurosphere formation.
Acrylamide Inhibits Neurosphere Formation Without Apoptosis and Differentiation in Mouse NSPCs
Based on previous results, the effects on cell proliferation and differentiation resulted in reduction of sphere formation efficiency in GBM-SCs and melanoma cells (4,30). Cell cycle arrest in GBM cells was also found after acrylamide treatment (56). We used two different methods to evaluate the apoptosis in acrylamide-treated neurospheres. The first method was to assay if genomic DNA of cells that were accumulated at the sub-G1 phase of the cell cycle was degraded into DNA fragments of ~200 bp. The second method was to determine the protein expression levels of procaspase 3, a reliable caspase cascade marker of signal transduction for cells in apoptosis when cellular proteins were degraded (11). The effect of acrylamide on the cell cycle of KT98 and KT98/F1B-GFP neurospheres was analyzed using flow cytometry. Acrylamide-treated (0, 0.1, and 0.5 mM) neurosphere-derived single cells were used for quantitative analyses in each phase of the cell cycle, which are summarized in Figure 4A. The acrylamide (0.5 mM) treatment resulted in significant decreases in the G0/G1 phase cells (from 60.7% to 53.1%; p < 0.05) and caused a nonsignificant increase in the S and G2/M phase cells in KT98/F1B-GFP cells. Furthermore, the results demonstrated that 0.5 mM acrylamide significantly decreases the number of cells in the G0/G1 phase of KT98/F1B-GFP cells, but not in KT98 cells. However, acrylamide-treated KT98 and KT98/F1B-GFP neurospheres showed no sub-G1 phase accumulation in cell cycle analysis (Fig. 4A). In procaspase 3 protein expression evaluation, protein samples were extracted from 0, 0.1, and 0.5 mM acrylamide-treated KT98 and KT98/F1B-GFP neurospheres. As indicated in Figure 4B, protein levels of procaspase 3 showed no changes in KT98 and KT98/F1B-GFP neurospheres after acrylamide treatment. These results suggested that apoptosis did not occur in 0, 0.1, and 0.5 mM acrylamide-treated neurospheres of mouse NSPCs.

Acrylamide-inhibited neurosphere formation of mouse NSPCs is not accompanied by apoptosis. Quantification data of the cell cycle from neurosphere under different acrylamide concentrations treatment (0, 0.1, and 0.5 mM) of the KT98 and KT98/F1B-GFP cells by flow cytometry analysis are expressed as the percentage of each phase (A). Procaspase 3 protein expression in neurospheres treated with 0, 0.1, and 0.5 mM acrylamide was analyzed with Western blot analysis (B). Results are presented as the mean ± SD from three independent experiments. Statistical differences are shown as *p < 0.05, **p < 0.01, ***p < 0.001. Abbreviation: NSPCs, neural stem progenitor cells; ACR, acrylamide; ND, not detectable; GAPDH, glyceraldehyde 3-phosphate dehydrogenase.
Furthermore, the expression of mRNA and/or protein levels of NSPC (Sox2, nestin, and Musashi) and differentiation (GFAP, β-tubulin III, and MAP2) markers were examined in acrylamide-treated neurospheres of KT98 and KT98/F1B-GFP cells. In Figure 5, the F1B-GFP-isolated cells showed higher Sox2 and nestin expression of NSPC markers in both mRNA and protein levels. Figure 5 shows that there were no changes of Sox2, nestin, and β-tubulin III mRNA levels, and Sox2, nestin, and Musashi protein levels in KT98 and KT98/F1B-GFP neurospheres after acrylamide treatment. Interestingly, a decrease in MAP2 mRNA levels was observed in 0.5 mM acrylamide-treated KT98 neurospheres. The results demonstrated that 0.5 mM acrylamide treatment reduces the sphere formation efficiency in mouse NSPCs and did not result in differentiation of these cells.

The mRNA and/or protein expression levels of the markers for NSPCs and differentiation in acrylamide-treated mouse neurospheres. The mRNA and/or protein expression levels of the markers for NSPCs (Sox2, nestin, and Musashi) and differentiation cells [GFAP, β-tubulin III (TuJ1 clone), and microtubule-associated protein 2 (MAP2)] were examined in acrylamide-treated neurospheres. There were no changes of Sox2, nestin, and TuJ1 mRNA levels, and Sox2, nestin, and Musashi protein levels in KT98 and KT98/F1B-GFP neurospheres after acrylamide treatment. Results are examined in three independent experiments. Abbreviation: ACR, acrylamide.
Differentiation of Neuron and Glia of Acrylamide-Treated Neurospheres Are Restored After Acrylamide Removal
To further characterize the acrylamide-treated neurospheres, immunofluorescence cytochemistry was performed for the staining of immature neuron marker (β-tubulin III) and glia marker (GFAP) in differentiated KT98 and KT98/F1B-GFP cells, which are differentiated from acrylamide-treated neurospheres in differentiation medium without acrylamide (Fig. 6). The results showed that cells from acrylamide-treated neurospheres could be further differentiated into neurons and glia when acrylamide was withdrawn from the differentiation medium. The results suggested that acrylamide-treated neurospheres retain the differentiation capacity of NSPCs.

Acrylamide-treated neurospheres of mouse NSPCs retains differentiation capacity of NSPCs. Differentiation of acrylamide-treated primary spheres to neuron (β-tubulin III expression) and glia (GFAP expression) was analyzed by immunofluorescence staining (scale bar: 100 μm). The results showed that cells from an acrylamide-treated neurosphere could be further differentiated into neuron and glia when acrylamide was withdrawn from the differentiation medium. Abbreviation: ACR, acrylamide.
Inhibition of Neurosphere-Forming Efficiency by Acrylamide Correlates with Cell-Cell Aggregation in Mouse NSPCs
Using live cell imaging microscope observation, we showed that the cells proliferate with weak cell-cell adhesion in the neurosphere-forming medium containing 0.5 mM acrylamide (Fig. 3C). Therefore, neurosphere formations under various exposure regimens of acrylamide were carried out to determine if acrylamide-inhibited neurosphere-forming efficiency correlates with cell-cell adhesion. First, neurosphere formation efficiency was analyzed by acrylamide (0, 0.1, 0.5, and 1 mM) treatment, which was added at day 3 of the neurosphere formation in both cell types (Fig. 7A). The results indicated that acrylamide inhibited neurosphere formation, which had been induced by EGF and FGF2 for 3 days. As shown in Figure 7A, neurosphere number was significantly reduced at 1 mM acrylamide in KT98 and KT98/F1B-GFP cells when compared with the untreated control. Interestingly, 0.1 mM acrylamide treatment showed significant increases in KT98 cells, but not in KT98/F1B-GFP cells (Fig. 7A). Furthermore, the acrylamide withdrawal experiment was performed in acrylamide-treated primary neurospheres. In the acrylamide withdrawal experiment, neurosphere formation efficiency of secondary spheres (resphere formation) was carried out from 0 and 0.5 mM acrylamide-treated primary neurospheres by using neurosphere medium without acrylamide for secondary sphere formation (Fig. 7B). The results demonstrated that the number of secondary spheres from 0.5 mM acrylamide-treated primary spheres of KT98/ F1B-GFP cells is more than its primary spheres and untreated control (Fig. 7B). In KT98 cells, no significant difference was observed in secondary spheres from 0 and 0.5 mM acrylamide-treated primary spheres (Fig. 7B). These results suggested that the inhibition of neurosphere-forming efficiency by acrylamide may correlate with cell-cell adhesion in neurosphere formation. Additionally, the results from the resphere experiment also provided the evidence that acrylamide-treated neurospheres regain the self-renewal property of the NSPCs when acrylamide is removed.

Neurosphere formation efficiency by various treatment regimens of acrylamide in the KT98 and KT98/F1B-GFP cells. The neurosphere numbers were evaluated by 0, 0.1, 0.5, and 1 mM acrylamide treatments, which were initiated at day 3 of neurosphere medium-induced neurosphere formation (A). Secondary sphere numbers were formed from 0 and 0.5 mM acrylamide-treated primary spheres (B). Results are presented as the mean ± SD from three independent experiments. Statistical differences are shown as *p < 0.05, **p < 0.01, ***p < 0.001. Abbreviation: ACR, acrylamide.
Inhibition of NCAM Expression and Induction of ERK Phosphorylation Are Involved in Acrylamide-Treated Neurospheres in Mouse NSPCs
As revealed by previous studies, NCAM expression, ERK, and β-catenin pathways participate in sphere formation inhibition (4,30). In the present study, protein expression levels of cell adhesion molecules (NCAM and N-cadherin), ERK, and AKT/β-catenin pathway in acrylamide-treated neurospheres were analyzed by Western blot (Fig. 8). The results demonstrated that protein expression of NCAM decreased, and pERK increased in 0.5 mM acrylamide-treated neurospheres in both cells, whereas expression of N-cadherin increased in KT98, but not in KT98/F1B-GFP cells (Fig. 8A). Protein expression of the AKT/β-catenin pathway, the signal transduction between cell adhesion molecules to β-catenin, showed serine-9 phosphorylated glycogen synthase kinase-3β (p-GSK3β), dp-β-catenin (Ser 33 and 37 dephosphorylated β-catenin), and the downstream effector cyclin D1 expression increased in 0.5 mM acrylamide-treated KT98 neurospheres (Fig. 8B). However, p-AKT and cyclin D1 expression decreased in KT98/F1B-GFP neurospheres after 0.5 mM acrylamide treatment (Fig. 8B). These results indicated that acrylamide-inhibited neurosphere formation in mouse NSPCs mainly correlated with NCAM inhibition and ERK phosphorylation. Additionally, NCAM inhibition by acrylamide further provided evidence that acrylamide-inhibited neurosphere formation resulted from the loss of cell-cell adhesion.
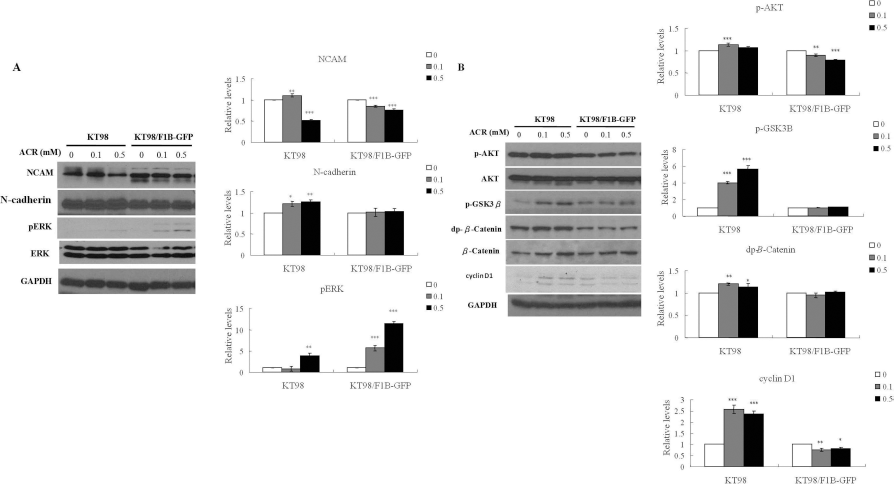
Protein expression levels of cell-adhesion molecules (NCAM and N-cadherin), ERK, and AKT/β-catenin pathway in acrylamide-treated neurospheres. Protein expressions of cell adhesion molecules (NCAM and N-cadherin) and ERK (pERK and ERK) (A) and β-catenin pathway (p-AKT, AKT, p-GSK3β, dp-β-catenin, β-catenin, and cyclin D1) (B) in different concentrations (0, 0.1, and 0.5 mM) of acrylamide-treated neurospheres were analyzed by Western blot. Results are presented as the mean ± SD from three independent experiments. Statistical differences are shown as *p < 0.05, **p < 0.01, ***p < 0.001. Abbreviation: ACR, acrylamide.
ERK Phosphorylation Contributes to Cell Proliferation in Acrylamide-Treated Mouse NSPCs
This study used PD98059, an ERK phosphorylation inhibitor, to address the possible involvement of ERK phosphorylation in the regulation of neurosphere-forming inhibition of mouse NSPCs in response to acrylamide treatments. As shown in Figure 9A, sphere number of PD98059 and 0.5 mM acrylamide cotreatment in KT98/ F1B-GFP cells showed no significant difference when compared with 0.5 mM acrylamide-treated control. Analysis of cell proliferation by MTS assay indicated that cell proliferation of cells with 50 μM PD98059 and 0.5 mM acrylamide cotreatment was significantly decreased in KT98/ F1B-GFP cells when compared with 0.5 mM acrylamide-treated control (Fig. 9B). Additionally, similar results of sphere number and MTS assay were observed in PD98059 and 0.5 mM acrylamide cotreatment of KT98 cells (data not shown). These results suggested that acrylamide-induced ERK phosphorylation contributed to the cell proliferation but did not contribute to the decrease in neurosphere number in acrylamide-treated mouse NSPCs.

Acrylamide-induced ERK phosphorylation of mouse NSPCs contributes to cell proliferation in acrylamide-treated neurospheres. The neurosphere numbers were evaluated by different treatment of acrylamide cotreated with PD98059 (A). Cell proliferation was evaluated by different treatment of acrylamide cotreated with PD98059 (B). Acrylamide treatment, 0.5 mM, is indicated with “+”; 20 or 50 μm PD98059 treatments are indicated with “+” and “++,” respectively. DMSO treatment is a control for PD98059 treatment (D). Results are presented as the mean ± SD from three independent experiments. Statistical differences are shown as *p < 0.05, **p < 0.01, ***p < 0.001. Abbreviations: ACR, acrylamide; D, DMSO.
Interaction of NCAM and FGFR1 in Acrylamide-Treated Neurospheres of Mouse NSPCs
Interactions of NCAM and FGFR that elicit downstream signaling had been reported previously (5,8,53). This study examines whether FGFR is involved in the acrylamidelinhibited neurosphere formation. To verify this result, coimmunoprecipitation experiments were performed in acrylamide-treated KT98/F1B-GFP neurospheres. As shown in Figure 10A, FGFR1 is able to associate with NCAM in both neurospheres with or without acrylamide treatment. FGFR1 and NCAM association was decreased in KT98/ F1B-GFP by 0.5 mM acrylamide treatment. Immunocytochemistry observation from neurospheres revealed the colocalization of NCAM with FGFR1 (Fig. 10B). Furthermore, Western blotting of phospho-FGFR1 (pFGFR1) showed no changes in acrylamide-treated mouse neurospheres (Fig. 10C). These findings clearly demonstrated that the decrease in NCAM and FGFR1 complex formation is involved in the mechanisms of acrylamide-inhibited neurosphere formation in mouse NSPCs.

NCAM/FGFR1 complex is reduced in mouse neurospheres when treated with 0.5 mM acrylamide. NCAM interacts with FGFR1 by coimmunoprecipitation with anti-FGFR1 (A). Immunocytochemistry results indicated the colocalization (yellow) of NCAM (red) with FGFR1 (green) (scale bar: 50 μm). Arrows indicate the colocalization (yellow) of NCAM with FGFR1 in the neurospheres (B). Protein expression of tyrosine-phosphorylated FGFR1 was analyzed by Western blot (C). Results are examined in three independent experiments. Abbreviations: ACR, acrylamide; pFGFR, phospho-FGFR.
Acrylamide Inhibits Neurosphere Formation in Human NSPCs
To clarify acrylamide effects on neurosphere formation in human NSPCs, U-1240 MG/F1B-GFP cells were applied to cell proliferation assays, neurosphere formation assays, and Western blot analyses after acrylamide treatment. Results from the MTS assay (Fig. 11A) showed that acrylamide treatments significantly increased cell proliferation at 0.1 and 0.5 mM acrylamide treatments and significantly inhibited it at 1 and 2 mM acrylamide treatments. Neurosphere formation assays (Fig. 11B) revealed that neurosphere numbers of U-1240 MG/F1B-GFP cells were significantly decreased (31.6 to 8.0, p < 0.01) in primary spheres by 0.5 mM acrylamide treatment. Moreover, secondary sphere formations of U-1240 MG/F1B-GFP cells showed no significant difference between primary and secondary sphere numbers under 0 and 0.1 mM acrylamide treatment, but showed a significant increase under 0.5 mM acrylamide treatment. The neurosphere morphology of microscopic observation is also displayed in Figure 11C. Furthermore, a significant NCAM decrease and pERK increase at 0.5 mM acrylamide treatment were also observed in U-1240 MG/ F1B-GFP cells (Fig. 11D). These results demonstrated that neurosphere formation was inhibited by acrylamide treatment not only in mouse NSPCs but also in human NSPCs.

Acrylamide inhibited neurosphere formation efficiency in human NSPCs. Acrylamide inhibited the proliferation by MTS assay in human NSPCs (A). Acrylamide treatment decreased neurosphere number by neurosphere formation assay (B). Representative images of neurospheres with different acrylamide concentrations are shown (scale bar: 200 μm) (C). Protein expression of cell adhesion molecular (N-cadherin and NCAM), MAPK-ERK (pERK and ERK) was analyzed by Western blot (D). Results are presented as the mean ± SD from three independent experiments. Statistical differences are shown as *p < 0.05, **p < 0.01, ***p < 0.001. Abbreviation: ACR, acrylamide.
Discussion
In this study, KT98/F1B-GFP and U-1240 MG/F1B-GFP cells were used as models of mouse and human NSPCs. KT98 cells were derived from F1B-Tag transgenic mouse brain tumors and had shown the self-renewal and multipotent characteristics of NSPCs (33,38). U-1240 MG cells are a human GBM cell line and are FGF1B-positive cells (7). Alam et al. (1) reported that FGF1B expression is restricted to sensory and motor nuclei in the brain stem, spinal cord, and the areas that are known to be abundant for NSPCs (42). Our previous studies have further isolated KT98/F1B-GFP and U-1240 MG/F1B-GFP cells as NSPCs by using human F1B promoter directing the GFP reporter gene (F1B-GFP) (1). Both KT98/F1B-GFP and U-1240 MG/F1B-GFP have been shown to possess self-renewal and multipotent capacities of NSPCs (23,38). In Figure 5, markers of NSPCs (Sox2 and nestin) were detected in KT98 and KT98/F1B-GFP cells by mRNA and protein expression, and the F1B-GFP-isolated cells showed higher Sox2 and nestin expression. In addition, transplantation of KT98/F1B-GFP cells in mouse sciatic nerve injury demonstrated that the cells could facilitate the repair of sciatic nerve injury (23,39) (T. Y. Hsu and I. M. Chiu, unpublished results). Thus, these cells allow for NSPC studies in toxicology in vitro.
Acrylamide is an environmental neurotoxin and has been classified as a “probable human carcinogen” by the International Agency for Research on Cancer (47). The average daily intake of acrylamide for adults is approximately 0.5 mg/kg body weight; children may have two to three times more intake than adults (18,38,55). Wilson et al. reported that the mean intake of acrylamide for humans is 10-40 mg/day (57). The Scientific Committee of the Norwegian Food Control Authority in 2002 estimated an additional carcinogenic risk of 1 per 10,000 exposed people at a lifelong intake of 0.08 mg/kg body weight/day (47). Rodriguez-Ramiro et al. have shown that smaller doses of acrylamide can act as toxicant when administered in long-term exposure (48). Therefore, it cannot be ruled out that daily exposure to a lower dose of acrylamide may bring forth a risk factor of toxicity in humans. Our data showed that 0.5 mM acrylamide treatment, which is a low concentration in comparison with other in vitro investigations of acrylamide, caused significant inhibition of neurosphere formation by decreasing NCAM. One of the primary targeting sites of acrylamide in humans is the NSPCs in the olfactory bulb. We estimated that the 0.5 mg/kg body weight is quite comparable to the 0.5 mM concentration that was used in the cell culture. The ablation of the expression of NCAM resulted in the disruption of the tumor tissue architecture (40), and its downregulation is observed in the development of colon cancer, myeloma, and neuroblastoma (3,14,25). NCAM is also known to mediate several neuronal functions in the central nervous system (20). Thus, the effect of acrylamide on tumor progression and in neuronal functions warrants further investigation.
We showed that acrylamide treatment resulted in neurosphere formation inhibition through decreasing cell-cell adhesion by NCAM inhibition in NSPCs, without the negative proliferation and differentiation effects of acrylamide. Neurospheres form from the clonal progenies of single NSPCs and/or the self-assembly of cells and/or neurospheres (16). Neurosphere formation efficiency significantly decreases in 0.5 mM acrylamide treatment of mouse and human NSPCs (Figs. 3 and 11). Live cell image observation showed that the formation of 0.5 mM acrylamide-treated neurospheres exhibited weak cell-cell adhesion in mouse NSPCs (Fig. 3C). Results from neurosphere formations by various treatment regimens of acrylamide (Figs. 7 and 11) and protein expression of NCAM decreased in acrylamide-treated neurospheres (Figs. 8 and 11). It was evident that acrylamide-inhibited neurosphere forming efficiency correlates with cell-cell adhesion.
Moreover, the results from the proliferation experiment (MTS assay) and apoptosis (sub-G1 phase accumulation of cell cycle analysis and procaspase 3 expression) indicated that no cytotoxic effects were involved in 0.1 and 0.5 mM acrylamide-treated neurospheres (Figs. 1 and 4). Together, these results suggested that acrylamide exhibited an inhibitor property of neurosphere formation in NSPCs.
The mechanisms of acrylamide-inhibited neurosphere formation correlate with the interaction of NCAM and FGFR1 in mouse NSPCs. In a previous study, RTK signaling had been implicated in regulation of neural stem cell proliferation and self-renewal, and FGF acts primarily through FGFR (49). NCAM modulates cell adhesion to matrix by inducing FGFR signaling, which is activated by the formation of the NCAM/FGFR4/N-cadherin complex (53). Liu et al. revealed that colony formation inhibition of murine B16F0 melanoma cells by NCAM silencing requires the function of FGFR and GSK3β but is independent of the mitogen-activated protein kinases (MAPK)/ERK and PI3K/AKT pathways (40). Sunayama et al. reported that targeted inactivation of MAPK kinase alone using pharmacological inhibitors or siRNAs resulted in reduced sphere formation and induced AKT phosphorylation in human GBM-SCs (54). Our results showed that FGFR1 associated with NCAM in both neurospheres, with or without acrylamide treatment of mouse NSPCs (Fig. 10). Acrylamide treatment resulted in reduction of neurosphere numbers, which was accompanied by lower levels of NCAM, p-AKT, and cyclin D1, as well as NCAM/FGFR reduction (Figs. 8 and 10). Therefore, these results suggest that acrylamide reduces NCAM expression and the formation of the NCAM/FGFR complex, which in turn reduces the signal transduction of PI3K/AKT pathway and the number of neurospheres. In addition, we noted that there are NCAM/FGFR double-positive cells and NCAM-positive cells that do not express FGFR. It is worthy of further exploration for those two populations of NCAM+ cells.
The decrease of NCAM expression may contribute to the disruption of neurosphere architecture by acrylamide treatment in vitro. Expression of NCAM was decreased in acrylamide-treated neurospheres of mouse and human NSPCs (Figs. 8 and 11). NCAM is a member of Ca2+-independent adhesion molecules and comprises five immunoglobulin (Ig)-like domains and two fibronection type III repeats in the extracellular parts. It is widely expressed in the central nervous system and mediates several neuronal functions, such as intercellular adhesion, neurite outgrowth, cell migration, proliferation, and survival (20). In Rip1Tag2 [rat insulin promoter directs expression of the SV40 Large T antigen transgene (TAg) to β-cells] transgenic mice, ablation of the expression of NCAM resulted in the disruption of the tumor tissue architecture (12,44,53,58). In in vitro studies, downregulation of NCAM expression either by siRNA silencing or chemical treatment causes colony formation inhibition (4,30). Therefore, the results presented in this study suggest that acrylamide treatment may hamper the effectiveness of central nervous system development or contribute to the disruption of the tumor tissue architecture by decreasing NCAM expression.
In Figure 8B, p-AKT protein of 0.1 mM acrylamide treatment and p-GSK3β, dp-β-catenin, and cyclin D1 protein of 0.1 and 0.5 mM acrylamide treatment showed an increase in KT98 neurospheres. However, different results were observed in 0.1 and 0.5 mM acrylamide-treated KT98/F1B-GFP neurospheres. Wnt/β-catenin signaling is relevant in promoting cell proliferation and sphere formation. The Wnt/β-catenin pathway causes GSK3β inactivation through Ser 9 phosphorylation and further activates the β-catenin and downstream genes. Phosphorylated β-catenin has been shown to be phosphorylated by GSK3β at serine 33 and 37, which leads to its degradation (40). Taken together, these results demonstrated that the number of neurospheres increased in KT98 cells after acrylamide treatment through the Wnt/β-catenin pathway. The result may explain why the 0.5-mM acrylamide treatment caused a significant reduction of neurosphere number in KT98/F1B-GFP, but not in KT98 cells.
As shown in Figure 7A, 0.1-mM acrylamide treatment showed an increase in KT98 cells but not in KT98/F1B-GFP cells. Based on previous studies, acrylamide has been claimed to induce tumors at many organ sites in animals (16,29). It has also been reported that acrylamide promotes astrocytic cell proliferation and astrogliosis of astrocytic cells, which has been shown to be associated with brain tumors (2). Therefore, acrylamide-induced astrogliosis is worth further investigation.
Moreover, we noted that a decrease in MAP2 mRNA levels was observed in 0.5 mM acrylamide-treated KT98 neurospheres, but not in acrylamide-treated KT98/F1B-GFP neurospheres. The paradoxical observation that MAP2 expression is reduced after KT98 cells were treated with 0.5 mM acrylamide is worthy of further exploration.
In conclusion, this study aimed to determine the neurosphere formation capacity that was affected by acrylamide by using mouse and human NSPCs, particularly brain-specific 1B promoter-selected KT98/F1B-GFP and U-1240 MG/F1B-GFP cells. Results from the 0.5-mM acrylamide treatment of mouse and human NSPCs showed high correlations of neurosphere formation inhibition with decreased levels of NCAM expression, cell-cell adhesion, and the formation of NCAM/FGFR complex. Therefore, this in vitro study clearly demonstrates the critical role of cell adhesion molecule, NCAM, in the regulation of acrylamide-inhibited neurosphere formation of both mouse and human NSPCs. We also highlighted the stem cell-based model feasibility for predictive toxicology of development in the neurological system after exposure to neurotoxins. As transplantation of cultured NSPCs has been shown to improve functional recovery for various neurological disorders, our demonstration of the effect of acrylamide in inhibiting neurosphere formation in NSPCs will provide an additional tool to dissect the function of NSPCs in neuroregeneration.
Footnotes
Acknowledgments
This study was supported by grants from National Health Research Institutes and National Science Council (NSC 101-2325-B-400-02) of Taiwan. The authors declare no conflicts of interest.