
Abstract
Human amniotic epithelial cells (hAECs) have been the object of intense research due to their potential therapeutic use. In this paper, we present molecular evidence of a bona fide epithelial to mesenchymal transition (EMT) undergone by hAECs. Amniotic membrane (AM)-derived hAECs showed the presence of typical epithelial markers such as E-cadherin and cytokeratins. hAECs in culture, however, underwent morphological changes acquiring a mesenchymal shape. Epithelial cell markers were lost and typical mesenchymal markers, such as vimentin and α-SMA, appeared. Several genes associated with EMT, such as SNAI1, MMP9, PAI1, or ACTA2, increased their expression. The expression of the transcription activators KLF4 or MTA3 was consistent with the downregulation of CDH1. We have shown that hAECs undergo EMT due to the autocrine production of TGF-β. Furthermore, the addition of the TGF-β receptor I (ALK5) inhibitor SB-431542 or TGF-β neutralizing antibody to hAECs prevented EMT and preserved the hAECs' epithelial phenotype. Altogether, these results suggest that cultured hAECs undergo EMT through the autocrine production of TGF-β.
Keywords
Introduction
Amniotic membrane (AM) integrity is essential for correct fetal development (8). AM contains an epithelial layer made of simple, continuous, cuboid, or flat cells, known as human amniotic epithelial cells (hAECs), their apical pole being in direct contact with the amniotic fluid. hAECs sit over a resistant well-defined basement membrane, the basal lamina, connected to the amniotic mesoderm where a netting of fibroblastic or mesenchymal cells can be identified (30). hAECs originate from the epiblast, which is a very early structure in embryo development that gives rise to the three embryonic layers (8). The important features of hAECs (32) are thought to be due to this early origin. hAECs have been the object of intense research due to their potential therapeutic use (19,36). hAECs express antigens associated with embryonic stem cells (ESCs) such as stage-specific embryonic antigen 3 (SSEA 3), SSEA 4, Trafalgar 1-60 (TRA 1-60), and TRA 1-81 (20,31, 32,36). hAECs also express molecular markers of pluripotent stem cells, such as octamer-binding protein 4 (OCT-4), sex-determining region Y box 2 (SOX-2), and Nanog, which are also expressed in the epiblast, embryo carcinoma cells, and embryonic germinal cells (30,32). Mitotic division causes the rapid surface growth of the amniotic epithelium; nevertheless, by 180 days of gestation, mitosis is rarely observed (25). hAECs and human amniotic mesenchymal stromal cells (hAMSCs) can be released from the respective layers by differential enzymatic digestion (30,36). Isolated hAECs can be cultured showing robust proliferation with numerous mitotic events and forming a confluent single layer with typical cuboid epithelial morphology (17,30,32). hAECs at the amniotic epithelium express the epithelial markers cytokeratin (2) and E-cadherin (36). When hAECs are cultured, they turn into mesenchymal stromal-like cells. In vitro cultivation of hAECs for several passages induces changes in the distribution of filamentous actin (F-actin) (4). Additionally, although initially negative for the mesenchymal marker vimentin, a type 3 intermediate filament normally expressed in mesenchymal cells (29), hAECs become vimentin-positive during cell culture (32). These changes had been interpreted by some authors as dedifferentiation (32) and by others as epithelial to mesenchymal transition (EMT) (4,38–40). However, to the best of our knowledge, in-depth analysis to identify the cause or precise nature of these changes has not yet been performed.
EMT is defined as a basic cellular process in which epithelial cells lose their epithelial properties (e.g., their polarized organization and cell–cell junctions) (14,23). Polarized epithelial cells are characterized by cortical filamentous actin bundles that are connected with intracellular juxtamembranous components of cell adherent junctions (44). Remodeling of the actin cytoskeleton from cortical to stress fibers is a hallmark of migratory mesenchymal cells, resulting in the loss of apico-basolateral polarity and dissociation of intercellular junctions (44). E-cadherin belongs to a large family of adhesion proteins expressed in epithelial cells and is a key molecule in their polarized architecture. E-cadherin is located at the core of the adherent junctions (13). The disruption of adherent junctions, together with the delocalization and downregulation of E-cadherin is a central regulatory event in EMT (5,6,9).
Members of the transforming growth factor-β (TGF-β) family of growth factors can initiate and maintain EMT in a variety of biological systems by activating major signaling pathways and transcriptional regulators integrated in extensive signaling networks (44). TGF-β activates signaling by initiating the assembly of a tetrameric complex made up of type 1 and type 2 serine/threonine kinase receptors. Upon receptor complex assembly, receptor-regulated mothers against decapentaplegic homolog 2 (Smad2) and Smad3 get phosphorylated and they bind to Smad4, the common mediator Smad. The formed Smad complex accumulates in the nucleus, where it regulates the transcription of genes that contribute to EMT (28,33). Essential roles of Smad2 and/or Smad3 have been demonstrated in EMT (44). TGF-β1 is expressed in AM (15) where TGF-β2 and 3 had also been detected but at much lower levels (26). TGF-β1 has also been detected in cultured hAECs (39).
The TGF-β transcriptional program that elicits EMT requires both the Smads and several transcription factors that act together to activate the complex gene machinery that produces EMT (33). For instance, human Snail homologue 1 (Drosophila) protein (Snail1) cooperates with Smads in the repression of CDH1 (E-cadherin) (42). During EMT, the resultant cells increase secretion of extracellular proteases and alter the expression of extracellular matrix (ECM) proteins and their receptors, resulting in a migratory cell phenotype (23). Among these extracellular proteases, TGF-β induces the expression of matrix metallopeptidase 9 (MMP9) (44).
In this article, we present molecular evidence of a bona fide EMT in hAECs induced by the autocrine production of TGF-β. These data are sustained through the study of different molecular markers. Among them, we have characterized the cell surface and cytoskeleton protein markers and transcription factors involved in EMT. Firstly, cultured hAECs lost their epithelial morphology that correlated with the loss of E-cadherin and gain of vimentin and α-smooth muscle actin (α-SMA). During hAEC EMT, we studied the expression of SNAI1 (Snail1) and other EMT key regulators for CDH1. We have also seen that hAECs produced TGF-β1 in an autocrine fashion. hAEC EMT is a TGF-β-dependent phenomenon, as the usage of either a TGF-β receptor I (ALK5) inhibitor (SB-431542) or TGF-β neutralizing antibody (TGF-β-na) prevented EMT and preserved the hAEC epithelial phenotype. Finally, even though hAECs were grown to form a tight compact epithelium by using SB-431542, the cells still underwent EMT upon TGF-β signaling restoration. All these data suggest that cultivated hAECs undergo a bona fide EMT by autocrine production of TGF-β.
Materials and Methods
Isolation and Cultivation of Human Amniotic Epithelial Cells (hAECs)
The collection of placentas after cesarean section was approved by the Hospital Ethical Committee, and written informed consent was obtained from the donors. The fetal membranes were washed in physiological saline solution (PSS) (B. Braun Melsungen AG, Melsungen, Germany) supplemented with 50 μg/ml amphotericyn (Bristol-Myers Squibb S.L., Madrid, Spain), 48 μg/ml clotrymazol (Almirall-Prodefarma S.A., Barcelona, Spain), 50 μg/ml tobramicyn (Laboratorios Normon S.A., Madrid, Spain), and 50 μg/ml vancomicyn (Laboratorios Hospira S.L., Madrid, Spain). For the purification of hAECs, we used a standardized procedure (4,17,31) with some modifications. Briefly, AM was peeled off from the underlying chorion layer, washed extensively with phosphate-buffered saline (PBS) (Gibco, Life Technologies, Paisley, UK), and cut into small tissue fragments that were digested three times during 40 min at 37°C with 0.05% trypsin-EDTA solution (Sigma, Madrid, Spain). Each trypsin digest was inactivated with two volumes of cold complete DMEM: standard Dulbecco's modified Eagle's medium (DMEM), supplemented with 10% fetal bovine serum (FBS), 1% penicillin/streptomycin, and 1% l-glutamine (all from BioWhittaker, Lonza, Basal, Switzerland). Then cells were filtered and decanted by centrifugation, and the three digests were pooled together (n = 6). At this point, the cells were labeled as freshly isolated cells (FI). The identity and purity of the population of isolated hAECs was assessed by cytokeratin flow cytometry as described by Ilancheran et al. (17). A typical purification of hAECs (n = 6) yielded more than 99% keratin-positive cells when stained for pan-cytokeratin (AE1/3) (Dako, Glostrup, Denmark). Purified hAECs were cultivated as described in the literature (4,17,31). Briefly, FI hAECs were seeded at a density of 1 × 10⁵ cells/cm2 with Complete DMEM and incubated in a humidified atmosphere at 37°C with 7.5% CO2. When reaching a confluence of 95%, the cells were detached by 0.05% trypsin/EDTA treatment. At this point, cells were called Passage 0 cells (P0). Subsequently, hAECs were subcultured at a density of 1 × 10⁴ cells/cm2 in Complete DMEM. They were labeled according to subculture as Passage 1 (P1), Passage 2 (P2), etc. (n = 6). Before subculturing, a phase-contrast picture of growing cells was taken with a Motic AE31 inverted optical microscope (Barcelona, Spain). We observed differences in the growing efficiency of different hAEC batches, as previously described (4), which causes variations in the time equivalence for passages of different experiments. These time variations were no more than 20-30%. For cells cultured with SB-431542 (TGF-β receptor I inhibitor; Sigma), the inhibitor at 10 μM was added immediately after cell plating and maintained until the end of the treatment (n = 4). The inhibitor was refreshed every 3 days as described (18). Cells treated this way were labeled with the passage number followed by the letters SB, P0SB. For TGF-β assays on SB-431542-treated cells, the inhibitor was washed out to reactivate TGF-β receptors by double PBS wash and readdition of fresh medium. Then, TGF-β (2 ng/ml; Preprotech, London, UK) was added. For EMT reinduction, SB-431542 was washed out from P1SB cells, trypsinized, and split in two, for cell expansion. Cells obtained this way were incubated in either 10 μM SB-431542 supplemented Complete DMEM or nonsupplemented Complete DMEM. The resulting next cell passages were named P2SB or P2SBRm, respectively (n = 3). Finally, cells were harvested after they had grown for several days. The TGF-β neutralizing antibody (TGF-β-na) (R&D Systems, Minneapolis, MN, USA) required a neutralizing concentration (20 μg/ml) that was determined following manufacturer instructions. AM freshly extracted hAECs were cultivated in the presence of 20 μg/ml of anti-TGF-β1, 2, 3 for 17 days and compared to both SB-431542-treated and nontreated cells. The antibody was supplemented every other day (n = 3).
HaCaT Cell Treatment with a Conditioned Medium from hAECs AM Treatment with SB-431542
When AM tissue fragments were used, AM was isolated following the procedure described above but excluding trypsin treatment and subsequent steps (19). For AM conditioning of the medium, an AM fragment of 4 by 4 cm was incubated in 10 ml of Complete DMEM for 24 h. A hAEC-conditioned medium was the result of 2 ml of Complete DMEM that had been conditioned by 1×10⁵ hAECs for 3 days. In both cases, the conditioned medium was fast-frozen in liquid nitrogen and stored at −80°C until use. HaCaT cells (7), a human spontaneously immortalized keratinocyte cell line, were a kind gift from Dr. Caroline S. Hill (London Research Institute, Cancer Research, UK). We assayed the biological activity of hAEC secreted TGF-β on HaCaT cells grown in Complete DMEM. Briefly, 5×10⁵ HaCaT cells were seeded in 5-cm diameter dishes and cultivated for 48 h. Twelve hours before treatment, cells were treated with 10 μM SB-431542. For conditioned medium assay, the inhibitor was washed out to reactivate TGF-β receptors by a double PBS wash (3). Then, HaCaT cells were incubated in conditioned medium for 2 h before being fixed and prepared for immunofluorescence. For AM SB-431542 treatment, AM tissue fragments were cultured in Complete DMEM with or without 10 μM of SB-431542 for 24 h. Finally, AM fragments were processed for immunofluorescence.
Cell Cycle Analysis
hAECs isolated from either AM or in culture were fixed with ice-cold 70% ethanol, washed three times with cold PBS, and stained for cell cycle analysis with propidium iodide (Sigma) following standard methods. Cells were analyzed by flow cytometry using a FACS Calibur 1 (Becton Dickinson, Madrid, Spain).
Western Blot
AM tissue sample or cells in culture were harvested and lysed with 20 mM HCl-Tris pH 7.5, 150 mM NaCl, 5 mM EDTA, 1.2 mM MgCl2, 0.5% NP-40 (IGEPAL), and 10% glycerol, 10 mM Na-butyrate, 1 mM DTT, 25 mM NaF, and 25 mM β-glycerophosphate supplemented with phosphatase inhibitors (I and II) and protease inhibitors (all from Sigma). Protein extracts were analyzed by sodium dodecyl sulfate polyacrylamide electrophoresis (SDS-PAGE; Bio-Rad, Madrid, Spain) followed by Western blot. Images of Western blot were taken with a ChemiDoc™ XRS System (Bio-Rad).
Antibodies and TGF-β1 ELISA
The following commercial antibodies were used: phospho-extracellular regulated kinase 1/2 (ERK1/2) and phospho-Smad2 (both from Cell Signaling Technology, Danvers, MA, USA); E-cadherin, vimentin, Snail1 (H130), and β-actin (all from Santa Cruz Biotechnology, Dallas, TX, USA); α-SMA (Sigma); pan-cytokeratin (AE1/3) and Ki-67 (both from Dako); Smad2/3 (BD Biosciences, San Jose, CA, USA); and TGF-β neutralizing antibodies (R&D Systems). Alexa fluor 594-labeled phalloidin was used to reveal actin filaments (Molecular Probes, Invitrogen, Eugene, OR, USA). For TGF-β1 detection, conditioned media from hAECs or AM was analyzed using a human-TGF-β1 ELISA commercial kit (eBioscience, San Diego, CA, USA).
Gene Expression Analysis by qPCR
For gene expression assay, RNA from AM tissue fragments or cultured cells was extracted using RNeasy Mini Kit (Qiagen, Hilden, Germany). Typically, 1 μg of RNA was retrotranscribed by GeneAmp (AppliedBiosystems, Foster City, CA, USA) or by an iScript cDNA synthesis kit (Bio-Rad), and the resulting cDNA was used for qPCR following the SYBR premix ex Taq kit (Takara-Bio, Shiga, Japan) according to manufacturer's instructions. The primers used for gene amplification were as follows: plasminogen activator inhibitor 1 (PAI1): CATGGGGCCATGGAACAAGG PAI-1-F, CTTCCTG AGGTCGACTTCAG PAI-1-R; Krüppel-like factor 4 (KLF4): CCCACACAGGTGAGAAACCT KLF4-F, ATGTGTAAGGCGAGGTGGTC KLF4-R; glyceraldehyde 3-phosphate dehydrogenase (GAPDH): ACCA CAGTCCATGCCATCAC GAPDH-F, TCCACCACC CTGTTGCTGTA GAPDH-R (all from Sigma). The rest of the genes were amplified using QuantiTect Primer Assay (www.quiagen.com/GeneGlobe): E-cadherin Hs_CDH1_1_SG (QT00080143); α-SMA Hs_ACTA2_1_SG (QT00088102); Snail1 Hs_SNAI1_1_SG (QT00010010); MMP9 Hs_MMP9_1_SG (QT00040040); metastasis-associated 1 family, member 3 (MTA3) Hs_MTA_3_SG (QT00064988); vimentin Hs_VIM_1_SG (QT00095795); TGF-β1 Hs_TGFB1_1_SG (QT00000728). Gene expression was referred to as a ratio to GAPDH expression. Gene expression values were represented as a percentage of the highest value.
Immunofluorescence
AM tissue fragments were fixed for 2 h at 4°C with 4% formaldehyde (Sigma)/PBS immediately after cesarean labor. Cultured hAECs on round cover glass were fixed for 10 min with 4% formaldehyde/PBS at room temperature (RT). Both AM and hAECs were permeabilized with 0.3% Triton X-100 (Sigma) in PBS for 15 min and then incubated with blocking buffer [0.3% bovine serum albumin (Santa Cruz), 10% fetal calf serum (Gibco), 0.1% Triton X-100 in PBS] supplemented with 5% skim milk (Difco, Sparks, MD, USA). Subsequently, samples were incubated with the appropriate primary antibody diluted in blocking buffer and washed three times with 0.1% Triton X-100/PBS. After primary antibody, samples were stained with the appropriate secondary antibodies together with Alexa fluor 594-labeled phalloidin and Hoechst 33258 (Fluka, Biochemika, Buchs, Switzerland) that was used for nuclei detection. Finally, samples were examined, and images were taken using a confocal microscope LSM 510 META (Zeiss, Jena, Thüringen, Germany).
Results
hAECs From Term AM Proliferate in Culture and Experience a Change in Morphology
We isolated hAECs from AM and put them into culture. After 3 days, hAECs at P0 exhibit the typical phenotype that has been previously described (4,38–40) (P0) (Fig. 1A). A wider separation between cells was observed at P2 (Fig. 1A). Interestingly, with further passages, cells changed morphology acquiring a more fibroblast-like appearance that was more evident at P5 (P3 and P5) (Fig. 1A). We determined the proliferation rate of hAECs derived from the AM using cell cycle distribution analysis. Freshly isolated (FI) cells were mainly at the G1 phase of the cell cycle (95.5%) (Fig. 1B). However, hAECs grown in culture for a few days (P0) were proliferating (Fig. 1C). Consistently, cells at the amniotic epithelial layer were neither showing any mitotic event nor expressing the Ki-67 (12) antigen (Fig. 1D), while hAECs P0 showed clear staining for Ki-67 (Fig. 1E). This is in accordance with the observation that cells at the amniotic epithelial layer do not proliferate after day 180 (25,32), whereas hAECs resumed proliferation when they were cultured (Fig. 1C, E). Our data indicate that, although hAECs were cell cycle arrested at the AM, when put into culture, they were able to proliferate and experienced a change in their morphology from cuboid to spindle cells.
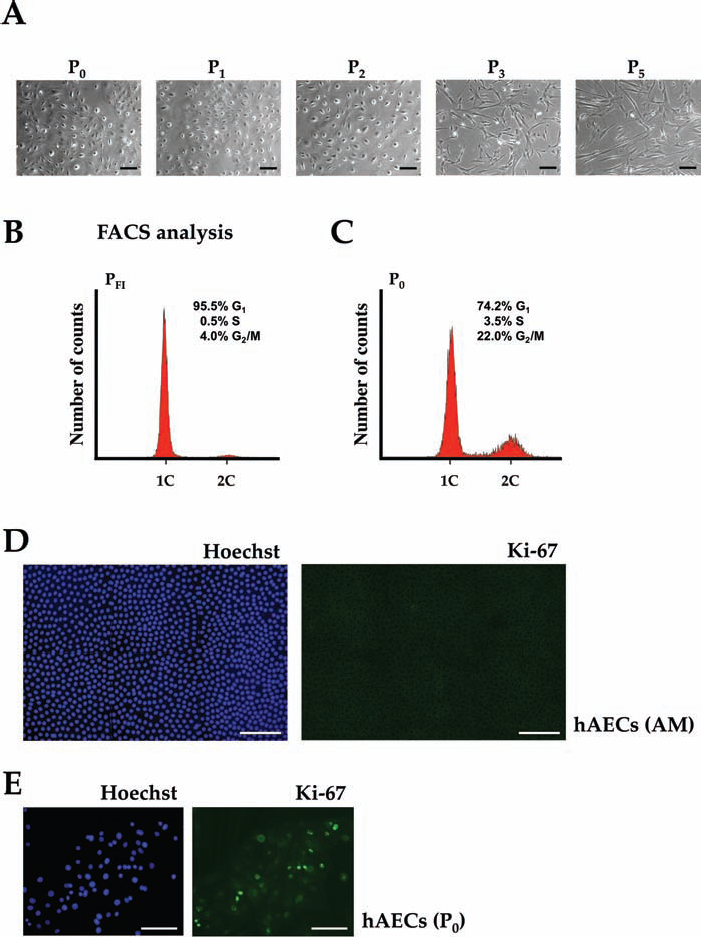
hAECs from term AM proliferate in culture and experience a change in morphology. (A) Morphology of primary cultured human amnion epithelial cells (hAECs) in different passages. Phase-contrast images of subconfluent hAECs are shown in different passages (P0 to P5) at 10× magnification (Scale bar: 100 μm). (B, C) DNA content of freshly isolated or cultured P0 hAECs. Cells were analyzed by fluorescence-activated cell sorting (FACS). (B) The histogram shows cells at the G0/G1 stage (1C, single copy) and at the G2/M stage (2C, two copies). Freshly isolated hAECs (FI) were quiescent, and all were at the G1/G0 phase of the cell cycle. (C) In culture, hAECs (P0) were rescued from quiescence and entered the cell cycle. (D) A fragment of amniotic membrane (AM) was fixed and stained for Ki-67 or Hoechst 33258 to reveal nuclei. An image composition of 3 (width) by 2 (height) consecutive confocal microscopy fields is shown. Scale bar: 100 μm. (E) Cultured hAECs at P0 were immunostained for Ki-67. Nuclei were revealed with Hoechst 33258. Scale bar: 100 μm.
hAECs in Culture Lose Their Epithelial Morphology Correlating with Gain of Mesenchymal Markers
In order to understand the nature of the changes experienced by hAECs, cell cultures were analyzed at different passages for well-established epithelial and mesenchymal cell markers. hAECs at P0 showed a discontinuous distribution of E-cadherin at the plasma membrane that was limited to places where adjacent cells were contacting with each other (Fig. 2A). With more passages, the expression of E-cadherin became cytosolic and limited to only a few cells; finally by P5 it had disappeared (Fig. 2A). When hAECs were put into culture, vimentin expression could already be detected at P0 showing a radial distribution; vimentin expression increased with higher passages adopting a spindle-shaped distribution (Fig. 2B). Moreover, F-actin staining evidenced the loss of cell cohesion that was patent as early as at P0 and increased with further passages. F-actin was cortical at P0 and became progressively more transcytoplasmic to end up as stress fibers at P5 (Fig. 2A, B). The decrease of E-cadherin expression together with the increase of vimentin correlated with a change in actin fiber distribution (P3 and P5) (Fig. 2A, B). Western blot analysis of all hAEC passages showed that E-cadherin protein levels were high at early passages and became undetectable by P3 and P5 (Fig. 2C), in contrast to the progressive increment of vimentin expression. Interestingly, vimentin expression from the AM tissue sample was very high (Fig. 2C). Keratins of different molecular weight were identified by Western blot and immunofluorescence in different hAEC passages (Fig. 2C, D), which is consistent with P5 cells having an epithelial origin. Snail1 expression was very low from the AM sample and in the early passages. Strikingly, protein levels increased in the late passages (Fig. 2C). Although phosphorylation of ERK 1 and 2 was high at AM, it was decreased by P1 and increased further with higher passage numbers (Fig. 2C). α-SMA protein was barely present at P0 and P1 hAECs; however, as the number of passages increased, the presence of α-SMA became more abundant and colocalized with phalloidin-stained stress fibers (Fig. 2E, F). Thus, there was a change in the organization of actin fibers in hAECs during EMT with α-SMA colocalizing with F-actin at later passages. Altogether, the above results suggest that hAECs obtained at P5 result from an EMT process.

hAECs lose epithelial cell features and gain mesenchymal cell features with increasing number of passages. hAECs in culture show cytokeratins throughout all passages. (A, B) Cultured hAECs in different passages were immunostained for E-cadherin (A) and vimentin (B) and costained for F-actin. Nuclei were revealed with Hoechst 33258. (C) Immunoblot of total cell lysates from hAECs in different passages confirmed the loss of epithelial cell markers and the gain of mesenchymal cell markers. Analyzed proteins are indicated. β-actin was used as a protein loading control. Different bands at pan-Keratin blot are due to detection of several acidic (type 1) and basic (type 2) cytokeratins. (D) Cultured hAECs in different passages were immunostained for pan-cytokeratins and costained for F-actin; nuclei were revealed with Hoechst 33258. Immunofluorescent staining revealed the presence of cytokeratins in all the passages confirming the epithelial origin of hAECs. (E) Total protein from hAECs in different passages was analyzed by Western blot for α-smooth muscle actin (α-SMA). β-actin was used as loading control. (F) hAECs grown for different passages were immunostained for α-SMA and costained for F-actin. Nuclei were revealed with Hoechst 33258. Stress fibers were noticeable in P3 and P5 and corresponded to a stronger expression of α-SMA. (A, B, D, F) F-actin staining shows the clear appearance of stress fibers at high passages of the culture. All cell images were adquired by confocal microscopy. Scale bar: 50 μm. Snai-1, snail1; p-ERK2, phosphorylated extracellular signal-regulated kinase 2.
During EMT hAECs Change the Expression of EMT Marker Genes
A transcription factors genetic expression program is common to different EMTs and is responsible for the loss of CDH1 (E-cadherin) expression, among others. Our study of E-cadherin showed that it was lost by P3 (see Fig. 2A, C). Accordingly, CDH1 had its maximum expression by P1; however, its expression was lost by P3 (Fig. 3A). To understand CDH1 gene regulation during EMT, we studied the expression of three different known transcription factors involved in its regulation: SNAI1 (Snail1), metastasis-associated 1 family, member 3 (MTA3), and Krüppel-like factor 4 (KLF4). SNAI1 had a very poor expression at freshly isolated or early passaged hAECs, but it increased by P3 and P5 (Fig. 3A). However, the expression of SNAI1 was very strong at the AM, likely due to the contribution of mesodermal layer cells. The expression of MTA3 in hAECs showed a steep downregulation (Fig. 3A) that correlated with SNAI1 upregulation. KLF4 was highly expressed at AM and FI hAECs, but it was rapidly downregulated by P3 (Fig. 3A). When looking through the passages, VIM (vimentin) expression increased with higher passage numbers (Fig. 3A).

Genes associated with EMT get upregulated with high passage numbers in cultured hAECs. RNA from AM, freshly isolated hAECs (FI), or different culture passages hAECs was analyzed by qPCR for different gene expression that were represented as a ratio to glyceraldehyde 3-phosphate dehydrogenase (GAPDH). (A) qPCR showed downregulation of the epithelial marker gene E-cadherin (CDH1) as well as a positive E-cadherin promoter regulator gene Krüppel-like factor 4 (KLF4) with an increasing number of hAEC passages. SNAI1 increased its expression with a higher number of passages together with the mesenchymal marker gene vimentin (VIM). Metastasis-associated 1 family, member 3 (MTA3) became highly expressed at hAECs P1 and became progressively downregulated at later passages. (B) qPCR showed upregulation of plasminogen activator inhibitor 1 (PAI1) by P0. Expression of α-SMA (ACTA2) increased with progressive hAEC passages. qPCR showed a strong expression of matrix metallopeptidase 9 (MMP9) in P1 hAECs; in the following passages, MMP9 expression was lost. EMT, epithelial mesenchymal transition.
TGF-β occupies a central role in controlling EMT (1). In fact, abolishing its signaling is sufficient in some cell systems to prevent EMT (34). We investigated the expression of TGF-β target genes such as plasminogen activator inhibitor 1 (PAI1), ACTA2 (α-SMA), and MMP9, all three related to EMT (24). Expression of PAI1 was very low at both AM and freshly extracted hAECs. However, in P1 its expression dramatically increased and remained high for the rest of the passages (Fig. 3B). ACTA2 expression showed a clear increase from P2 onwards and reached its maximum by P3 and P5 (Fig. 3B), in accordance with its protein expression (see Fig. 2E). MMP9 only had a very acute expression at P1 (Fig. 3B). All the above gene expression analysis data suggest that hAECs are experiencing a TGF-β-regulated EMT process.
TGF-β Is Involved in hAEC EMT
To investigate the possible involvement of TGF-β in hAEC EMT, isolated cells were put into culture with Complete DMEM supplemented with the TGF-β receptor I inhibitor SB-431542 that prevents TGF-β signaling (18) and compared to isolated cells grown in nonsupplemented Complete DMEM. Already at P1, cells treated with SB-431542 were more compact with a cobblestonelike distribution compared to nontreated cells that exhibit gaps among them (Fig. 4A). At the subcellular level, SB-431542 treatment caused a cortical, sharp, continuous E-cadherin distribution, while untreated cells showed an irregular E-cadherin distribution (Fig. 4B). SB-431542-treated hAECs did not show any signs of vimentin in clear contrast to nontreated control cells (Fig. 4B). F-actin had a cortical distribution in SB-431542-treated cells compared to an irregular distribution in nontreated cells (Fig. 4B), where it showed the lack of intercell cohesion. Moreover, F-actin formed a ribbon located at the cells on the periphery of the islands in SB-431542-treated cells (Fig. 4B, see arrows). Cells treated with SB-431542 showed the absence of basal Smad2 phosphorylation, while hAECs grown without SB-431542 inhibitor showed a high basal level of Smad2 phosphorylation (Fig. 4C). In both cases, and upon SB-431542 washout to reactivate TGF-β receptor I, treatment with TGF-β caused a strong Smad2 phosphorylation in both SB-431542-treated and nontreated cells (Fig. 4C). Consistently, hAECs in a Complete DMEM nonsupplemented medium showed a nuclear localization of Smad2/3 that further intensified upon TGF-β treatment.

The inhibition of TGF-β signaling pathway preserves the epithelial architecture of the hAECs. P1 hAECs grown in Complete Dulbecco's modified Eagle's medium (DMEM) supplemented with 10 μM SB-431542 [transforming growth factor (TGF)-β receptor I inhibitor] had a compact epithelial morphology. (A) Phase-contrast images of P1 hAECs cultivated in the presence or absence of SB-431542 revealed different cell morphology. Scale bar: 100 μM. (B) Cells as in A were immunostained for E-cadherin and vimentin and costained for F-actin, and nuclei were revealed with Hoechst 33258. Yellow arrows indicate ribbons of F-actin at the periphery of the cell islands. Images were taken by confocal microscopy. Scale bar: 50 μm. (C) P1 hAECs as in A were treated with TGF-β (1 h), then total protein extracts were analyzed by Western blot for indicated proteins. Before TGF-β stimulation, the inhibitor was washed out from the cells grown in the presence of SB-431542. (D) P1 hAECs grown in standard culture medium were treated with 2 ng/ml of TGF-β (1 h), 10 μM SB-431542 (4 h), or left untreated. Cells were immunostained for mothers against decapentaplegic homolog 2/3 (Smad2/3) and costained for F-actin; nuclei were revealed with Hoechst 33258. Images were taken by confocal microscopy. Scale bar: 50 μm. In all cases, Complete DMEM supplemented with 10 μM of SB-431542 (SB) or without it (-) is indicated.
In contrast, SB-431542 treatment prevented Smad2/3 nuclear localization (Fig. 4D). All these results suggest that TGF-β is involved in hAEC EMT.
hAECs Produce TGF-β1 in an Autocrine Way
AM is a source of TGF-β1 (15). In order to determine whether hAECs produce autocrine TGF-β1, we assayed condition medium (CM) from AM and hAECs P0 by ELISA and found a robust production of TGF-β at P0 hAECs (Fig. 5A). Moreover, qPCR expression analysis of AM and hAECs in different passages revealed a strong production of TGF-β1 at P0 that decreased with further passages (Fig. 5B). HaCaT cells are human spontaneously immortalized keratinocyte epithelial cells (11) that respond to TGF-β by phosphorylating Smad2 and 3 and translocating them into the nuclei (18,37). We performed a TGF-β biological test by assaying hAECs P1 conditioned medium (CM) on HaCaT cells. CM(P1) induced the nuclear translocation of Smad2/3 that was inhibited by SB-431542 (Fig. 5C), thus confirming the data obtained by ELISA and qPCR. Altogether, these data indicate that hAECs produce TGF-β1 in an autocrine fashion.

hAECs produce TGF-β endogenously causing the phosphorylation of Smad2 and its translocation to the nucleus. AM epithelial cells express epithelial but not mesenchymal markers. (A) Conditioned medium from AM or hAECs P0 was analyzed for TGF-β1 content by ELISA. TGF-β1 concentration produced by 6×10⁴ cells was represented. (B) AM, freshly isolated hAECs (FI), or indicated hAEC RNA cultured passages were analyzed by qPCR for TGF-β1 gene expression that was represented as a ratio to GAPDH. (C) HaCaT cells were stimulated with conditioned medium coming from hAECs at P1, CM(P1), and the same conditioned medium supplemented with 10 μM SB-431542. Additionally, another set of cells was stimulated with 2 ng/ml of TGF-β or TGF-β together with SB-431542. After 2-h incubation, cells fixed and immunostained with Smad2/3 antibody and costained for F-actin; nuclei were revealed with Hoechst 33258. Images were taken by confocal microscopy. Scale bar: 50 μm. (D-G) complete fragments of AM were stained for E-cadherin (D), vimentin (E), α-SMA (F), and pan-cytokeratin (G) and costained for F-actin. Nuclei were revealed with Hoechst 33258. Two overlapping distant optical planes of the same area containing either hAECs or human amniotic mesenchymal stromal cells (hAMSCs) were acquired by confocal microscopy. The amniotic epithelium (amniotic epithelium optical plane) and the amniotic mesoderm (amniotic mesoderm optical plane), labeled Amn. Epith. and Amn. Mes., respectively, are shown side by side. Scale bar: 50 μm.
Cells in the AM Epithelial Layer Express Epithelial But Not Mesenchymal Markers
Cultured hAECs at P0 exhibited a clear expression of vimentin and α-SMA; additionally, E-cadherin showed a discontinuous distribution. In order to determine the native state of hAECs at the AM, we studied epithelial and mesenchymal markers for the epithelial and mesenchymal cells of the AM by immunostaining. Cells in the amniotic epithelial layer were forming a compact monolayer epithelium, whereas cells at the amniotic mesoderm were more disperse with a typical mesenchymal shape (Fig. 5D–G). E-cadherin had a continuous cortical distribution at cells at the amniotic epithelial layer and was absent at mesodermal layer cells (Fig. 5D). Vimentin and α-SMA proteins were abundant in cells at the mesodermal layer; however, they were virtually absent from cells at the amniotic epithelial layer (Fig. 5E, F). Additionally, cells in the AM epithelial layer showed a strong cytosolic staining for pan-cytokeratin that was lacking in cells at the amniotic mesodermal layer (Fig. 5G). In both types of cells, F-actin was present, but while F-actin in cells in the amniotic epithelial layer had a cortical distribution and was very close to E-cadherin, F-actin in cells in the mesodermal layer was evenly distributed at the whole cell (Fig. 5D, E). All these results indicate that cells in the epithelial layer of the AM constitute a bona fide epithelium. However, culturing hAECs induces an EMT that is dependent on autocrine TGF-β signaling. Inhibition of TGF-β signaling clearly prevents hAECs spontaneous EMT.
SB-431542-Treated hAECs Experienced EMT Upon Removal of the Inhibitor
hAECs experience EMT upon TGF-β autocrine production. The use of SB-431542 prevented these changes and kept cells within their original epithelial characteristics. We cultured hAECs in either an SB-431542-supplemented or normal medium until P1. hAECs with SB-431542 at P1 (P1SB) were split into two groups; SB-431542 treatment was removed in one of them, whereas the inhibitor was kept in the other. Both cultures were grown for one more passage. Resulting cells were called P2SBRm or P2SB and were compared to P2 cells (Fig. 6A). P2SBRm cells lost E-cadherin neatness at cell boundaries and were more similar to P2 cells in contrast to P2SB cells that showed a sharp, cortical distribution of E-cadherin (Fig. 6B). Additionally, vimentin, absent in P1SB (see Fig. 4B) and P2SB (Fig. 6B) cells, was expressed at P2BRm (Fig. 6B). Furthermore, Smad2/3 subcellular distribution was mainly nuclear in P2SBRm as in P2 cells, in contrast to P2SB cells (Fig. 6B). Notably, P2SBRm cells exhibited a significant basal level of Smad2 phosphorylation while it was not phosphorylated at P2SB cells (Fig. 6C). Treatment of both P2SBRm and P2SB cells with TGF-β, after SB-431542 washout, induced a strong phosphorylation of Smad2 (Fig. 6C). Treatment of HaCaT cells with conditioned medium from cells where the TGF-β inhibitor had been removed, CM(P2SBRm), localized Smad2 to the nucleus, and this was prevented by the presence of SB-431542 (Fig. 6D). The expression analysis of PAI1, MMP9, VIM, or ACTA2 showed that gene expression was prevented in P0SB, P1SB, and P2SB hAECs (Fig. 6E). In contrast, P0 and P1 cells showed the previously described pattern of expression (see Fig. 3A, B). Strikingly, when SB-431542 was removed from the P1SB cells, all the genes that had a low expression in P1SB cells, turned out to be upregulated in the next passage (P2SBRm) (Fig. 6E). All the data above suggest that removal of the ALK5 inhibitor induces the resetting of TGF-β signaling and subsequently induces EMT that could be detected at the molecular and genetic levels.
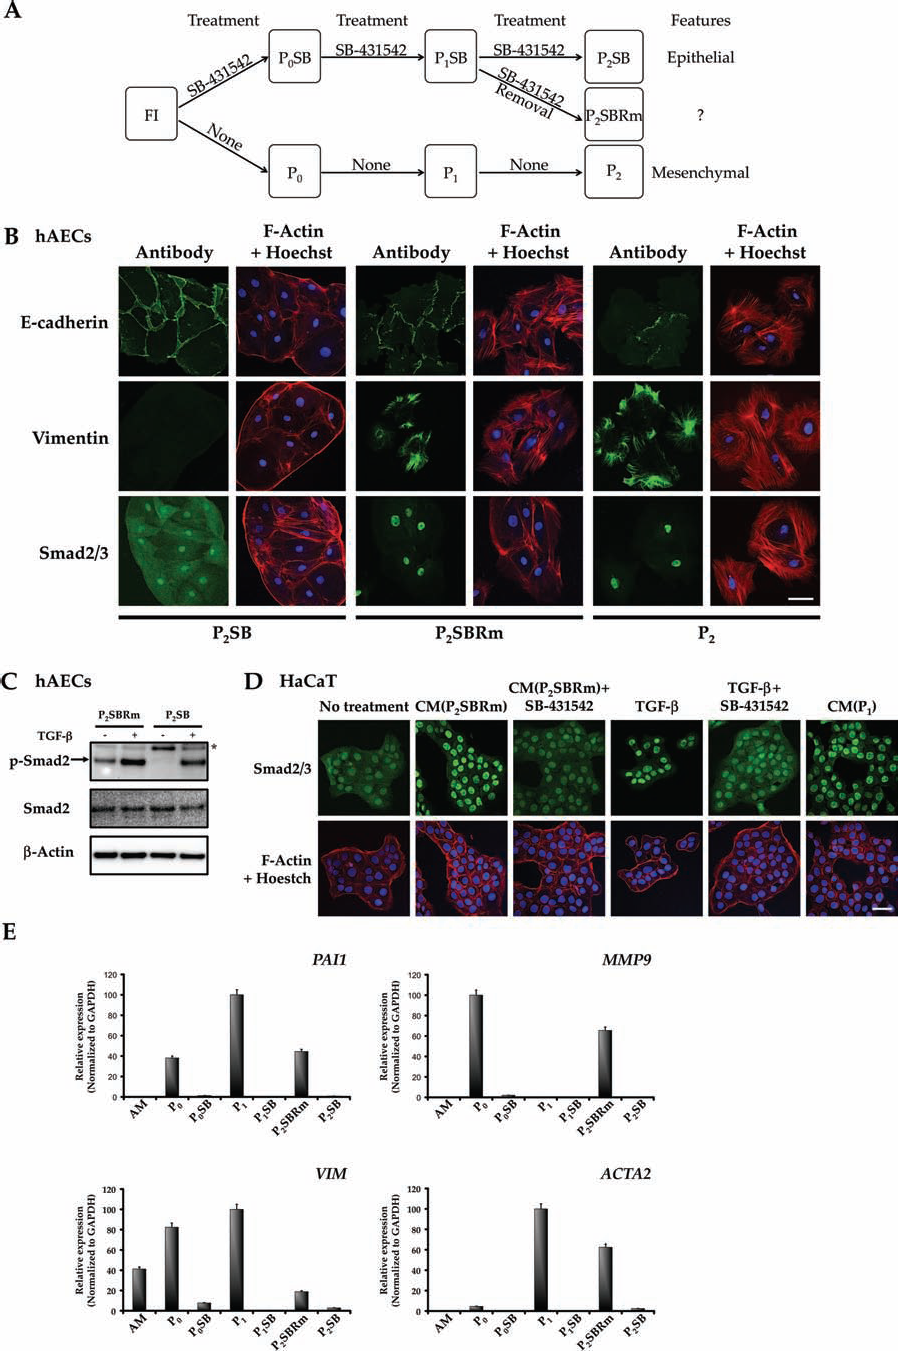
Removal of SB-431542 from P1SB hAECs induces EMT. (A) FI hAECs were grown in SB-431542 supplemented Complete DMEM or Complete DMEM for two passages. P1SB were passaged to either 10 μM SB-431542 supplemented Complete DMEM or Complete DMEM. Cells were called P2SB and P2SBRm, respectively. Both types of cells were grown for 10 days before protein extraction or immunostaining (n = 3). (B) P2SB, P2SBRm, or P2 hAECs were immunostained for E-cadherin, vimentin or Smad2/3 and costained for F-actin; nuclei were revealed with Hoechst 33258. Scale bar: 50 μm. (C) Either P2SB or P2SBRm hAECs were stimulated or not with TGF-β (1 h). Immunoblot of total cell lysates for phospho-Smad2; Smad2 and β-actin were used as loading controls. *Nonspecific band. (D) Conditioned medium from P2SBRm hAECs [CM(P2SBRm)] either supplemented or not with 10 μM SB-431542 was used on HaCaT cells for 2 h. Additionally conditioned medium from hAECs at P1 [CM(P1)] was used as a control. Moreover, HaCaT cells were treated for 2 h either with TGF-β or TGF-β together with SB-431542. Cells were immunostained for Smad2/3 and costained for F-actin; nuclei were revealed with Hoechst 33258. Scale bar: 50 μm. (E) Genes associated with EMT get upregulated after SB-431542 removal from the P1SB hAECs. AM or different culture passage hAECs RNA were analyzed by qPCR for PAI1, MMP9, VIM, or ACTA2 genes. Gene expression is represented as a ratio to GAPDH.
A Compact Epithelium Does Not Prevent TGF-β-Induced EMT
Epithelial cells at AM form a compact epithelium (see Fig. 5D–G). To study whether a compact epithelium is sufficient to prevent autocrine TGF-β-induced EMT, hAECs were grown in medium supplemented with SB-431542, which caused them to form a P1 confluent compact epithelium (data not shown). Then, SB-431542 was removed, and cells were cultivated for 5 more days, while in parallel a control group kept the inhibitor. In 5 days, cells where ALK5 inhibitor had been removed became bigger, flatter, less compact, and exhibited intercellular gaps compared to cells grown with SB-431542 that continued being smaller and more compact (Fig. 7A). E-cadherin distribution in SB-431542-treated cells was sharp, cortical, and neatly localized at cell boundaries, and vimentin was absent (Fig. 7B). Furthermore, Smad2/3 had a clear cytoplasmic localization (Fig. 7B). In contrast, untreated hAECs showed a notched and serrated E-cadherin distribution with cells showing clear gaps between them (Fig. 7B). Remarkably, vimentin was present in these cells (Fig. 7B). Moreover, Smad2/3 was clearly localized at the nucleus in contrast to SB-431542-treated hAECs (Fig. 7B). Therefore, even when hAECs form a tight compact epithelium similar to AM epithelium, TGF-β signaling activation prompts the cells to undergo EMT.

A compact epithelium does not prevent TGF-β-induced EMT. (A) Confluent hAECs maintain a bona fide epithelial morphology when treated with SB-431542. hAECs grown in Complete DMEM either supplemented or not with 10 μM SB-431542 were examined by phase-contrast microscopy. Scale bar: 100 μm. (B) hAECs were grown to full confluence in the conditions mentioned above. Cells were immunostained for E-cadherin, vimentin, or Smad2/3 and costained for F-actin; nuclei were revealed with Hoechst 33258. Scale bar: 50 μm. Complete DMEM supplemented with 10 μM of SB-431542 (SB) or without it (-) is indicated. Immunofluorescence images were taken by confocal microscopy.
AM Epithelial Cells Are Sensitive to TGF-β
Cultured hAECs had an autocrine production of TGF-β and were sensitive to this cytokine. To investigate whether AM epithelial cells were sensitive to TGF-β, we studied AM fragments cultured in the presence or absence of SB-431542. Immunofluorescence analysis of AM fragments revealed a clear exclusion of Smad2/3 from the nuclei of AM epithelial cells treated with SB-431542, while the presence of Smad2/3 was clearly nuclear in the nontreated ones (Fig. 8A). This is in accordance with AM TGF-β production reported in the literature (15,26). It also indicates that AM epithelial cells are sensitive to TGF-β.

AM produces TGF-β and is sensitive to it. (A) AM was incubated in complete DMEM or DMEM supplemented with SB-431542 for 24 h. Complete fragments of AM were stained for Smad2/3 and costained for F-actin. Nuclei were revealed with Hoechst 33258. Images were acquired by confocal microscopy. Scale bar: 20 μm. (B) AM isolated hAECs were cultivated in Complete DMEM or Complete DMEM supplemented with SB-431542 or TGF-β-neutralizing antibody (na) (indicated as α-TGF-β). Phase-contrast images (original magnification: 10×, scale bar: 100 μm) of subconfluent hAECs are shown for the three different treatments. (C) Immunoblot of total cell lysates from hAECs cultivated in Complete DMEM (-) or Complete DMEM supplemented with TGF-β-na (α-T) or SB-431542 (SB) were analyzed for the indicated proteins. Smad2 was used as a protein loading control. *A nonspecific band. Western blot bands for phospho-Smad2 were quantified and represented as a ratio to Smad2. (D) RNA from hAECs as in (C) was analyzed by qPCR for PAI1, MMP-9, or VIM genes. Gene expression is represented as a ratio to GAPDH. (E) hAECs as in (B) were immunostained for either E-cadherin, vimentin, or Smad2/3 and costained for F-actin; nuclei were revealed with Hoechst 33258. Images were acquired by confocal microscopy. Scale bar: 50 μm.
The TGF-β Neutralizing Antibody Prevents hAECs EMT
We explored further the relationship between hAECs EMT and autocrine TGF-β production by using a TGF-β1, 2, and 3 neutralizing antibody (TGF-β-na). Already at P0, AM freshly isolated hAECs cultured in the presence of TGF-β-na exhibited an epithelial morphology similar to the SB-431542-treated cells and different from nontreated hAECs (Fig. 8B). Western blot of TGF-β-natreated hAECs revealed an important decrease in the amount of phosphorylated Smad2 (Fig. 8C). We studied the effect of the neutralizing antibody on the expression of PAI1, MMP9, and VIM at P0 cells. All genes showed a strong expression in control nontreated cells that was either substantially decreased by TGF-β-na treatment or completely abolished by SB-431542 (Fig. 8D). At the subcellular level, the study of Smad2/3 confirmed a moderate effect of TGF-β-na on Smad2/3 translocation (Fig. 8E). However, hAECs treated with TGF-β-na had a continuous, sharp, cortical distribution of E-cadherin similar to SB-431542-treated cells but in clear contrast to nontreated cells (Fig. 8E). Moreover, F-actin staining highlighted the presence of gaps between cells in the control hAECs when compared to TGF-β-na- or SB-431542-treated ones (Fig. 8E). Finally, expression of vimentin was virtually absent from both SB-431542- and TGF-β-na-treated cells (Fig. 8E). Thus, the blockade of TGF-β with a specific neutralizing antibody had similar consequences as the inhibition of ALK5 with SB-431542. All these results indicate the direct involvement of TGF-β as the cytokine responsible for hAEC EMT.
Discussion
We have shown that hAECs undergo morphological changes in culture that are consistent with an EMT. Several groups have reported data suggesting that hAECs in culture experience EMT (4,38–40). To our best knowledge, this is the first report showing a detailed subcellular and molecular characterization of changes produced by the autocrine production of TGF-β occurring during hAEC cultivation. We have determined the characteristics of hAECs in AM immediately after elective caesarean delivery to preserve the original features of AM cells. Our data indicate a clear epithelial nature of cells at the amniotic epithelial layer. In contrast, the observation of cells at the amniotic mesodermal layer showed clear mesenchymal features.
Although cells at the amniotic epithelium are cell cycle arrested (our results) (25), hAECs in culture proliferate forming a confluent single layer that, when cultivated for only a few passages, evolved into a clear mesenchymal morphology. Freshly isolated hAECs and cultured hAECs at all passages expressed cytokeratins. Additionally, hAECs grown in SB-431542 did not exhibit any mesenchymal features. All these facts strongly suggest an EMT process during hAEC cultivation and ruled out the possibility that P5 mesenchymal cells were the consequence of the outgrowth of some rare or contaminant hAMSCs present after isolation.
Nonpolar or cytoplasmic expression of E-cadherin protein or transcriptional repression of its mRNA are hallmarks of EMT (16). In the present study, culturing of hAECs caused an abnormal distribution of E-cadherin. With further passages, E-cadherin expression was lost. Regulation of expression of CDH1 (E-cadherin) is under several positive and negative transcription regulators. Among them is Snail1, the master regulator of EMT (45) that is positively regulated by TGF-β (35). SNAI1 expression at the AM must be due to the contribution of cells from the mesodermal layer, since freshly isolated (FI) hAECs had very low SNAI1 expression. In hAECs in culture, the loss of expression of CDH1 correlated well with the increased expression of SNAI1 and the acquisition of mesenchymal features. Altogether, our data suggest that the EMT observed in cultured hAECs is due to an increase of SNAI1 expression.
MTA3 plays a role in the maintenance of the normal epithelial architecture and selectively represses SNAI1(10). Loss of MTA3 expression had been correlated with downregulation of E-cadherin in human breast cancer (10). Notably, the expression of MTA3 increased when hAECs were put into culture, but it decreased rapidly after cells were cultured for a few passages. The downregulation of MTA3 observed following progressive passages of hAECs is consistent with the upregulation of SNAI1. Transcription factor KLF4 is a positive regulator for CDH1 (43). KLF4 has also been identified as a TGF-β-regulated gene during the process of EMT (41). AM and FI hAECs had strong KLF4 expression that decreased as the number of passages increased and eventually it disappeared. Thus, the combined downregulation of KLF4 together with the upregulation of SNAI1 can easily explain the observed downregulation of CDH1 and suggest a cooperative effect of both factors to regulate the expression of CDH1 in hAECs during EMT.
The presence of vimentin has been suggested as a critical marker to distinguish true complete EMT from cell scattering or partial EMT (21). Additionally, expression of vimentin on its own has proven to be sufficient to induce changes in cell shape, motility, and adhesion during the epithelial to mesenchymal transition in epithelial cells (29). Importantly, epithelial cells at the AM did not show any vimentin staining. In the present study, the upregulation of vimentin expression was already noticeable after the first round of hAEC cultivation and it increased after several passages. The increase of vimentin expression correlated with E-cadherin downregulation. Additionally in hAECs, TGF-β receptor inhibitor prevented vimentin expression indicating that vimentin was induced during cultivation.
TGF-β is a major inducer of EMT in vivo (1). PAI-1, MMP9, and α-SMA are part of the EMT proteome (22), and the three of them are inducible by TGF-β (24). The expression of these three genes suggested an involvement of TGF-β in hAEC EMT. Moreover, hAECs cultivated in the presence of SB-431542 exhibited a bona fide epithelial phenotype and conditioned medium from hAECs was able to elicit TGF-β signaling responses in HaCaT cells. AM and hAECs had an autocrine production of TGF-β1. When compared to the AM, the expression level of the TGF-β1 gene increased when hAECs were put into culture although it decreased with increasing passaging. Recently, Pratama et al. observed the same reduction of TGF-β1 production with progressive passages (39). The decrease of TGF-β production may be a consequence of the EMT. Nevertheless, the importance of TGF-β signaling in the first stages of hAEC EMT is critical because TGF-β signaling inhibition with SB-431542 or neutralizing antibodies (TGF-β-na) is sufficient to prevent hAEC EMT. In Madin-Darby canine kidney (MDCK) cells, TGF-β neutralizing antibodies are able to prevent TGF-β-induced EMT (27). Similarly, in our study, the addition of TGF-β-na to hAECs in culture preserved their epithelial AM phenotype. Although TGF-β-na only decreased by half the levels of phosphorylated Smad2 or other tested TGF-β-inducible genes, it still prevented hAEC EMT. All these data indicate that autocrine TGF-β1 is the inducer of hAEC EMT.
Besides autocrine TGF-β, epidermal growth factor (EGF) family members contribute to EMT via autocrine production (16). Cooperation of both active TGF-β and Ras signaling is required for EMT; separately they induce scattering but not a true EMT (21,22). The AM secretes additional cytokines and growth factors such as EGF, TGF-β, keratinocyte growth factor (KGF), hepatocyte growth factor (HGF), and basic fibroblast growth factor (bFGF) (26) that could be responsible for the activation of the Ras/mitogen-activated protein kinase (MAPK) pathway. The AM conditioned medium (19) and AM tissue fragments were able to induce the phosphorylation of ERK1 and 2 in HaCaT cells (19). Throughout different hAEC passages, we saw a progressive increase of ERK1 and 2 phosphorylation. Taking into account the ongoing TGF-β signaling, the combination of both signals may cause the EMT process observed in hAECs during cultivation.
The epithelial phenotype induced by the presence of SB-431542 is reversible; the removal of the inhibitor causes a reentry of hAECs into the EMT program and the reexpression of several TGF-β dependent genes indicating that the reinstatement of TGF-β signaling enrolls cells into the EMT gene expression program. This is dependent on autocrine TGF-β production as the conditioned medium obtained from hAECs P2SBRm cells induced Smad2/3 nuclear translocation in HaCaT cells.
Stem cell markers are present on the surface of hAECs, and additionally, these cells express molecular markers of pluripotent stem cells (20,30–32,36). An important question that needs to be addressed is whether the EMT experienced by cultured hAECs affects their stem cell characteristics.
hAECs grown in the presence of SB-431542 are able to form a tight compact epithelium. However, once the inhibitor was removed, this epithelium acquired mesenchymal features. Also, we have shown that AM produces TGF-β and epithelial cells at the AM are responsive to it. An important issue is that despite all these facts, hAECs at the AM epithelium do not undergo EMT during gestation (our results) (2,30). The lack of EMT at the AM is not due to the fact that cells form an epithelium. However, we favor that the absence of EMT at the AM epithelium may be explained by an interaction of hAECs with the basal lamina, where hAECs establish interactions (2). In lung epithelial cells, for instance, the interaction of integrins with proteins at the basal lamina is an important mechanism that prevents TGF-β-induced EMT (24). Finally, even though TGF-β is produced by hAECs and epithelial cells at the AM are sensitive to TGF-β, the interaction of these cells with proteins at the basal lamina may preserve hAECs' epithelial morphology. This may be critical for the role they play during fetal development. Therefore, it is crucial to study the interaction of hAEC integrins with basal lamina proteins as the possible cause of the absence of TGF-β induced EMT at AM epithelial cells.
Footnotes
Acknowledgments
This work was supported by a grant from the Spanish Ministry of Education and Science, a grant from the Fundación Séneca de la Región de Murcia, and a grant from the Instituto de Salud Carlos III, Fondo de Investigaciones Sanitarias. E.M.G.-V. was granted a fellowship from Fundación Séneca de la Región de Murcia. A.A. received a fellowship of the Spanish Ministry of Science and Innovation. F.J.N. was supported by the Ramón y Cajal programme of the Spanish Ministry for Education and Science and the Fundación para la Formación e Investigación Sanitarias de la Región de Murcia. We are indebted to the Hospital Universitario Virgen de la Arrixaca that strongly supported this research. We thank Dr. Caroline S. Hill and Dr. Pablo Pelegrín for useful comments on the manuscript. The authors declare no conflict of interest.