
Abstract
In contrast to the application of human mesenchymal stem cells (hMSCs) in regenerative medicine, only a limited number of studies are addressing their use in anticancer therapy. As the latter may represent a new hope to improve the survival of patients with glioblastoma multiformae (GBM), the most common and malignant form of the brain tumors, we aimed to investigate the interactions of hMSCs and GBM cells under in vitro conditions. Four hMSC clones and three different GBM cell lines were used to study their mutual paracrine interactions in cocultures compared to their monocultures, where cells were grown under the same experimental conditions. The effects on cell growth, proliferation, and invasion in Matrigel were quantified. Further, bioinformatics tools were used to relate these results to the data obtained from cytokine macroarrays and cDNA microarrays that revealed proteins and genes significantly involved in cellular cross-talk. We showed that hMSCs are responsible for the impairment of GBM cell invasion and growth, possibly via induction of their senescence. On the other hand, GBM cells inversely affected some of these characteristics in hMSCs. We found CCL2/MCP-1 to be the most significantly regulated chemokine during hMSC and U87-MG paracrine signaling in addition to several chemokines that may account for changed cocultured cells' phenotype by affecting genes associated with proliferation (Pmepa-1, NF-κB, IL-6, IL-1b), invasion (EphB2, Sod2, Pcdh18, Col7A1, Gja1, Mmp1/2), and senescence (Kiaa1199, SerpinB2). As we functionally confirmed the role of CCL2/MCP-1 in GBM cell invasion we thereby propose a novel mechanism of CCL2/MCP-1 antimigratory effects on GBM cells, distinct from its immunomodulatory role. Significant alterations of GBM phenotype in the presence of hMSCs should encourage the studies on the naive hMSC use for GBM treatment.
Introduction
Glioblastoma multiformae (GBM) is the most aggressive brain cancer that is due to its highly infiltrative nature inherently resistant to conventional therapy and displays a high recurrence rate. For its effective treatment one should target glioma tumor cell growth and the invasive glioma cell subpopulation, a “guerilla spread,” which is recognized as a single cell infiltrate in the brain parenchyma (35,45). Several mediators of the invasive tumor cell phenotype have been identified in different cancer models. These include epidermal growth factor (EGF), insulin-like growth factor 2 (IGF2), and platelet-derived growth factor (PDGF) promoting cell mobilization (61), all known to be upregulated in primary and secondary glioma. The signaling pathways result in the activation/ inhibition of proliferation, migration, and adhesion genes (8,27,38). Conceivably, induction of antimigratory ligand/ receptor expression in GBM cells could provide new interventions for human glioma in the clinic and may prove valuable in early prognosis before glioma malignization (i.e., the onset of GBM cell infiltration).
For noninvasive GBM therapy, strategies designed in the past on animal models relied on antibodies, nanoparticles, drug liposomes, or viral vehicles to be injected at the tumor site and cause tumor growth inhibition (2). While the majority of those strategies failed to be effective in vivo (49), the multipotent human mesenchymal stem cells (hMSCs) (2) and dendritic cells (5) as delivery vehicles have become implicated in many further studies. The inherent tumor tropic behavior of hMSCs enables them to find and distribute efficiently within the invasive tumor, suggesting that hMSCs upon implantation could migrate and deliver a therapeutic substance to the parts of the glioma that are otherwise inaccessible to surgery (4,19).
There are a number of potential (side) stimuli that hMSCs can encounter within the tumor microenvironment resulting in their pro- or antitumor activity. This way, naive genetically unmodified hMSCs have been shown to promote growth of certain tumor types (6,21,65), but to suppress it in others including glioblastoma (22,37,44,48). It is therefore important to resolve the molecular mode of communication between hMSCs and glioma cells in order to merit their successful translation into the clinic.
As the use of hMSC therapy in GBM tumors is restricted due to the lack of knowledge on molecular mechanisms regulating hMSC/GBM cross-talk, our aim was to analyze the molecular communication between these two cell types in the in vitro coculture model. Previously, we and others have reported that chemokines and growth factors, such as vascular endothelial growth factor (VEGF), interleukin-8 (IL-8), transforming growth factor-β (TGF-β), and neurotrophin-3 (NT-3), secreted by glioma cells mediate homing of hMSCs to gliomas (3,24,54). But none of those chemokines alone was responsible for the observed impairment of GBM cell growth and invasion in hMSC coculture (25) as we describe here.
We therefore hypothesized that additional mediators exist and may be revealed by the transcriptomic analysis and cytokine profiling of the cocultured hMSC and GBM cells. Based on in-depth bioinformatics approach we indeed found a key regulator, chemokine (C-C motif) ligand 2/monocyte chemotactic protein-1 (CCL2/MCP-1), and its signaling pathway to regulate the invasion of GBM cells in the coculture. Furthermore, functional association of cytokine CCL2/MCP-1 with other cellular processes based on our transcriptomic data is also proposed in this work.
Materials and Methods
Cell Lines
Human MSCs derived from bone marrow of healthy volunteers were purchased from Lonza Bioscience, Walkersville Inc. (hMSC1: male, age 36, 7F3458; hMSC2: male, 19, 6F4393; hMSC3: female, 22, 7F3677; hMSC4: male, 33, 6F4085). After resuscitation cells were plated and grown according to the manufacturer's recommendations. Briefly, hMSCs were grown in Dulbecco's medium (DMEM, Sigma 5921,) and 10% fetal bovine serum (FBS, PPL), supplemented with 100 U penicillin, 1000 U streptomycin, 2 mM l-glutamine, Na-pyruvate, and nonessential amino acids. They were medium changed three times a week and passaged further after reaching 75% confluence at the density 5,000 cells/cm2. Human brain tumor cell lines (U-87MG, U-251, U-373) were purchased from the American Type Culture Collection (ATCC; Manassas, VA, USA). They were cultured in the same medium as hMSCs, passaged at 75% confluence, and seeded at the density 15,000 cells/cm2. hMSCs of passage 7 and glioma cell lines of passage 40 were used in the experiments.
In Vitro Proliferation Assay Using Ki67 Antibody
The proliferation assays of cocultured cells were performed using 24-well Transwell cell culture inserts (Costar, Cornig Inc., NY) with 0.4 μm pore size. No cell crossing of the membrane was detected in the test experiment when the bottom side of the membrane was stained with 0.5% cresyl violet for cell inspection. For proliferation studies thus 5,000 hMSC or GBM cells were seeded in a 50-μl drop on the poly-l-lysine (20 ng/ ml, Sigma)-coated cover slips. The respective cocultured cells (GBM or hMSC) were seeded into the inserts at the density of 10,000 cells/200 μl and left to attach for 2 h in separate cultures before being put together and fed by 800 μl of the medium. Proliferation rate was measured 72 h later with Ki-67 staining. Briefly, cells were fixed at 4°C with 70% methanol for 30 min, permeabilized with 0.1% Triton-X for 10 min, and blocked with 4% bovine serum albumin (BSA) for 15 min. Primary mouse Ki-67 antibody diluted 1:100 (Abcam, Cambridge, UK) and secondary anti-mouse Alexa-Fluor 488-labeled antibody (Molecular probes, Paisley, UK) diluted 1:500, together with Hoechst (5 μg/ml, Sigma-Aldrich, USA) were added and incubated for 1 and 1.5 h, respectively. Cover slips were mounted with Antifade reagent (Life Technology, USA) and the ratio between Ki-67 granularly fluorescent-stained nuclei and total nuclei (stained with Hoechst) was scored for each experiment in at least 500 cells. All the experiments were performed in duplicates and repeated three times. The ANOVA test with post hoc Dunnett's test was used to compare percentages of proliferating cells in the control and cocultures; a value of p < 0.05 was considered significant.
In Vitro Matrigel Invasion Assay
The invasion potential of three different GBM cell lines (U-87MG, U-251, U-272) in response to four different hMSC lines (hMSC1: 7F3458; hMSC2: 6F4393, hMSC3: 7F3677; hMSC4: 6F4085) and vice versa was studied in Matrigel coated Boyden chambers. The upper surface of the chamber (12-well polycarbonate filter inserts) with 12-μm pores (Costar, Corning Inc., NY) was coated with Matrigel (50 μg/well, Becton Dickinson, Franklin Lakes, USA) prepared in serum free medium (SFM) (DMEM supplemented only with 100 U penicillin, 1000 U streptomycin, 2 mM l-glutamine, Na-pyruvate, and nonessential amino acids). The inserts were dried overnight and reconstituted with 0.2 ml of SFM 1 h prior to cell seeding. All cell lines were trypsinized and seeded in triplicate either into inserts at a density of 20,000 cells/insert in 0.2 ml of normal medium or into wells in 0.8 ml of normal medium. In controls no cells were seeded in the wells. After 72 h cell inserts were transferred to fresh medium and MTT reagent [3-(4,5-dimethylthiazol-2-yl)-2,5-diphenyltetrazolium-bromide; Sigma, St. Louis, USA] at 0.5 mg/ml final concentration was added to both chambers. Three hours later the media with formazan crystals were collected separately from the upper and lower chamber, pelleted by centrifugation, dissolved in 200 μl of dimethyl sulfoxide, and pipetted in duplicates into a 96-well plate. The optical density (OD) of each well was measured at 570 nm (reference filter 690 nm) using a microplate reading GENios spectrofluorimeter (Tecan, Salzburg, Austria). Two individual Boyden chambers were set up for each coculture condition and all experiments were repeated three times. Invasion potential was calculated as the ratio of the absorbance in the lower compartment to the sum absorbance of both compartments. The results were expressed as the mean values and statistically evaluated with ANOVA and post hoc Dunnett's test; a value of p < 0.05 was considered significant.
Cell Senescence
U87-MG cells were cultured as monoculture or hMSC coculture in the modified Boyden chamber set up as described above. After 72 h the morphology and the proportion of U87-MG cells positive for the senescence associated β-galactosidase (SA-β-Gal) activity were evaluated at pH 6.0 as described by Heo et al. (16) and the results were tested with Student's t-test, where a value of p < 0.05 was considered significant.
Coculture Experiment and Conditioned Medium Collection
hMSC4 and U87-MG lines were chosen for further analysis. The cocultures were set up in duplicates using six-well Transwell inserts (Costar, Corning Inc.) with 0.4-μm pore size. In the bottom chamber the hMSCs were plated at the density of 105 cells in 2 ml, whereas the U87-MG cells were always plated in the insert at the density of 80,000 cells/ml. Cells were left to adhere for 3 h before being put together for 72 h. Conditioned media for the experiments were prepared by conditioning the media for 24 h on the subconfluent cells. Harvested conditioned media were centrifuged at 1,500 × g, stored at −70°C, and diluted in 1:1 ratio with fresh medium prior use.
Detection of Cytokine Release
After 72 h media from the monocultures and coculture set-up as well as the medium control were used to detect multiple cytokine expression levels with the use of RayBiotech Human Cytokine Antibody Array (Ray Biotech Inc., USA), that allows for a detection of 79 different cytokines according to the manufacturer's protocol. Briefly, cytokine antibody array membranes were blocked at room temperature (RT) for 30 min and incubated with 1 ml of (cell) media overnight at 4°C. The array membranes were washed with provided buffers and incubated with 1 ml of diluted biotin-conjugated antibodies for 2 h at RT. After second wash they were incubated for 2 h with 2 ml of 1,000x diluted horse radish peroxidase streptavidin. Chemokine signals were revealed by enhanced chemiluminescence produced with ECL Plus Western Blotting Detection Reagents (Amersham Biosciences, UK) and 1-min exposure to the X-ray film. After scanning the films, the image analysis was performed using ArrayPro Analyser (MediaCybernetics). The net spot intensity was calculated as trimmed mean raw spot intensity with subtracted trimmed mean background spot intensity. Further, media control values were subtracted, and signal intensities were normalized against the average of positive controls printed on the macroarray. Low intensity spots (net intensity less than 1.5-fold of average background spot net intensity) were excluded from the analysis. Differences in concentrations of chemokines were evaluated using Student's t-test statistics with p-values corrected for multiple comparisons using adjusted Bonferroni method and visualized in TMeV software (53).
Gene Expression Microarrays
Total RNA was isolated from three biological replicates of monocultured and cocultured hMSCs (hMSC1, hMSC3, hMSC4) and GBM cells (U373, U251, U87) using Trizol reagent (Invitrogen Limited, Paisley, Scotland UK) following the manufacturer's instructions. RNA was column purified with RNAeasy Mini Kit (Qiagen, UK) and integrity confirmed using the Agilent 2100 Bioanalyzer (Agilent Technologies, USA). The isolated RNA samples of hMSC4 and U87-MG were further labeled with Illumina TotalPrep RNA Amplification Kit (Ambion) and subsequently hybridized to HumanWG-6 v3 Expression BeadChip (Illumina). After scanning, image acquisition was performed with Bead Studio version 3.3.7 software (Illumina). Data processing was performed in an R statistical environment (51), using the lumi software package (9) for data import, quality control, and a robust spline normalization of log2 transformed data. Pairwise microarray (MA) plots, density plots of signal intensity, as well as boxplots were inspected for each microarray, both on raw and normalized data as a part of quality control. In order to reduce the extent of false-positive results, unexpressed genes with detection value of p < 0.01 were filtered out. For probe annotation, annotate, lumiHumanAll.db, and GO.db Bioconductor software packages were used. Data were first inspected by hierarchical clustering (HCA) to get an overview of the sample variability. Statistical testing was performed using linear models with false discovery rate (FDR) correction for multiple testing [Bioconductor software package limma (56)] to evaluate the effect of coculture conditions on hMSCs and glioma cells in terms of differentially expressed genes between them. Two lists of differentially expressed genes were obtained, one showing the differences between U87-MG cells grown in coculture with hMSCs and U87-MG cells grown in monoculture (supplemental material Table S1; supplementary material can be viewed and downloaded from: http://www.nib.si/eng/index.php/oddelki/oddelek-za-genetsko-toksikologijo-in-biologijo-raka/raziskovalni-programi-in-projekti/mednarodni-projekti.html?view=details&id=75) and the other showing the differences in hMSCs (supplemental material: Table S2; supplementary material can be viewed and downloaded from: http://www.nib.si/eng/index.php/oddelki/oddelek-za-genetsko-toksikologijo-in-biologijo-raka/raziskovalni-programi-in-projekti/mednarodni-projekti.html?view=details&id=75). Differentially expressed genes (cut-off p < 0.01) were functionally analyzed with Gene Ontology and KEGG Pathways using hypergeometric testing in GOStats Bioconductor software package (12). Separate analyses were performed for up- and downregulated genes for each individual set of differentially expressed genes. Moreover, a query in BioMine data mining tool was performed with genes of interest (18). All microarray data was deposited to the NCBI's Gene Expression Omnibus (http://www.ncbi.nlm.nih.gov/geo/query), a public functional genomics data repository (GEO series Accession Number: GSE26283).
Quantitative Real-Time PCR (qRT-PCR)
cDNA was generated from 1 μg of total RNA using High-Capacity cDNA Reverse Transcription Kit (Applied Biosystems, USA) in a 50 μl final reaction volume, according to the manufacturer's protocol. Gene expression of Ccl2/Mcp-1, Ccr2, NF-κB, and Gja/Cx43 was quantified using real-time quantitative PCR (ABI 7900 HT Sequence Detection System, Applied Biosystems, USA). Real-time PCR reactions were performed using 1:10 dilution (1 μl/well) of each cDNA added to TaqMan Universal PCR Master Mix (Applied Biosystems, USA) and TaqMan Gene Expression Assays (all from Applied Biosystems, USA): CCL2/MCP-1, Hs00234140_m1; CCR2 (chemokine, cc motif, receptor 2), Hs00356 601_m1; NF-κB (nuclear factor of κ light polypeptide gene enhancer in B-cells), Hs00765730_m1; GJA/Cx43 (gap junction protein α 1/connexin-43), Hs007484 45_s1. Amplification of glyceraldehyde 3-phosphate dehydrogenase (GADPH; Pre-Developed Taqman Assay Reagent No. 4310884E) probe was performed as internal control. The SDS v2.2 software was used to analyze the data obtained from TaqMan Gene Expression Assays with the Comparative Ct Method (AACt algorithm). Independent experiments were performed in duplicates and repeated three times. Statistical significance between monoculture and indirect cocultures was determined by two-tailed Student's t-test and a value of p < 0.05 was considered significant.
Functional Analysis: Neutralization Assay of MCP-1 and CCR2
hMSC (hMSC1, hMSC3, hMSC4) and GBM (U373, U251, U87-MG) invasion experiments were performed as described in the in vitro Matrigel invasion assay. In neutralization study cell invasion was assayed in cell monoculture, cell monoculture with antibody, cell coculture, and cell coculture with antibody. Either a rabbit anti-human-hCCL2/ MCP-1 mouse monoclonal neutralizing antibody (R&D System, MN) or a rabbit anti-human-CCR2 mouse monoclonal neutralizing antibody (R&D System, MN) was added to the lower chamber at the concentration of (10 μg/ml) and incubated with the cells.
Results
Proliferation and Invasion Potential of hMSC and GBM Cell Lines Are Impaired in Coculture
The interactions between hMSC and GBM cell lines were studied regarding cell proliferation and invasion—the hallmarks of clinical behavior of malignant brain tumors. Proliferation results demonstrated high interindividual variability among four hMSC clones, characterizing them as “fast” (hMSC2, hMSC4) or “slow” growing ones (hMSC1, hMSC3) (Fig. 1a). Likewise, the proliferative difference was observed among three different GBM cell lines with cell line U87-MG being most and U373 being least dynamically proliferating (Fig. 1b). In coculture conditions only slow growing hMSCs significantly increased their proliferation potential (Fig. 1a), implying that GBM cells had no significant impact on the proliferation of already fast proliferating hMSCs. Oppositely, all hMSC clones significantly decreased the proliferation potential of GBM cell lines studied (Fig. 1b).

Proliferation potential of (a) human mesenchymal stem cells (hMSCs) and (b) glioblastoma multiformae (GBM) cells assessed with the Ki-67 immunostaining is impaired in the cocultures of both cell types. The error bars represent the SEM. *p < 0.05, **p < 0.01; ***p < 0.001.
When analyzing the invasion potential of the hMSCs and GBM cells in cocultures or in conditioned media cultures our results showed that all hMSC clones significantly increased their invasion potential when grown with GBM (Fig. 2a) or GBM conditioned media (Fig. 2b). The difference in the invasion potential appeared less pronounced when hMSCs were subjected to conditioned media compared to cocultures (Fig. 2a, b). On the contrary, the invasion potential of U87 and U251 significantly decreased in both conditions (Fig. 2c, d). In case of GBMs the conditioned media had stronger impact on GBM's invasion than coculture. Since the impact of conditioned media on cells of other type depends on the “concentration” of chemokines produced by metabolically active cells during conditioning (hMSCs and GBM differ in their metabolic activity), we reasoned that this explains the difference in conditioned media effect on hMSCs and GBM when compared to coculture effect.

The invasion potential of (a, b) hMSC and (c, d) GBM cells. Changes in their (a, c) indirect coculture or (b, d) conditioned media culture. The error bars represent the SEM. *p < 0.05, **p < 0.01; 096368912X640547p < 0.001.
Human MSCs Induce Cell Morphology Changes and Senescence in U87-MG Cells
U87-MG cells grown with hMSCs changed their morphology (Fig. 3a, b) from slender neuron-like cells of normal U87-MG appearance toward the enlarged, flattened cells with big inflated nuclei. Human MSC coculture significantly increased the abundance of inflated nuclei in U87-MG cells and significantly decreased the number of mitotically active cells (Fig. 3a). The increase of cell's and nuclei size implicated on either cell death (senescence/apoptosis) or differentiation being induced in U87-MG cells upon hMSC coculture. With β-galactosidase staining indicative of senescence, a threefold increase in the number of blue β-gal-positive, senescent cells was confirmed in the cocultured U87-MG cells (Fig. 3c, d).
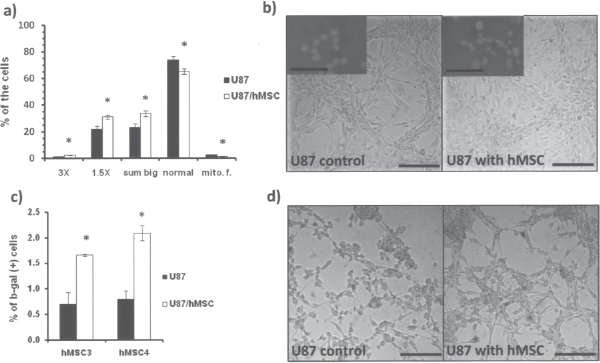
U87-MG GBM cells change their morphology and senescence in hMSC coculture. (a) A change of the U87-MG cells morphology evaluated by the nucleus size (3X, 1.5X—X times the size of the normal nuclei) and the presence of mitotic figures (mito.f.). (b) The change of U87 slender morphology into flat large cell morphology, as observed under the microscope (magnification 200x). (c) Senescent U87-MG cell quantification by β-galactosidase staining and (d) visualization under the microscope. The error bars represent the SEM. *p < 0.05. Scale bars: 20 μm.
Cytokine Analysis of the hMSC/U87-MG Coculture Media Revealed Increase in CCL2/MCP-1 Secretion
As hMSC influence on U87-MG cell proliferation, invasion, and senescence in coculture was confirmed, we went on a quest for the answer of which secreted soluble factors are causing those effects and act as key players in hMSC/U87-MG cell communication. With human cytokine antibody macroarrays we found that significantly more CCL2/MCP-1 was secreted into the coculture compared to the hMSC and U87-MG cells grown alone. Apart from CCL2/MCP-1 production (Fig. 4a), a computer-based quantitative macroarray image analysis revealed levels of chemokine (C-X-C motif) ligand 2 (CXCL2), interleukin (IL)-8, CCL2/MCP-1, vascular endothelial growth factor A (VEGF-A), hepatocyte growth factor (HGF), and insulin-like growth factor-binding protein 1 (IGFBP-1) to be significantly increased in coculture compared to hMSC monoculture (Fig. 4b), and increased levels of CCL2/MCP1, angiogenin, and tumor necrosis factor receptor superfamily, member 11b (TNRSF11B) in cocultures compared to U87-MG grown alone. Decreasing trend was observed for RANTES (Regulated upon Activation, Normal T-cell Expressed, and Secreted; CCL5), oncostatin M, platelet-derived growth factor-BB (PDGF-BB), glial-derived growth factor (GDNF), IGFBP-2, neurotrophin-3 (NT-3), and transforming growth factor (TGF)-β2. As both cell types were present in the coculture the observed increase in some chemokines could have accounted for a chemokine increase in one cell type and a decrease in the other cell type. Therefore, the cDNA microarray gene expression data of both cell types in the coculture were considered for the final interpretation of cytokine results.
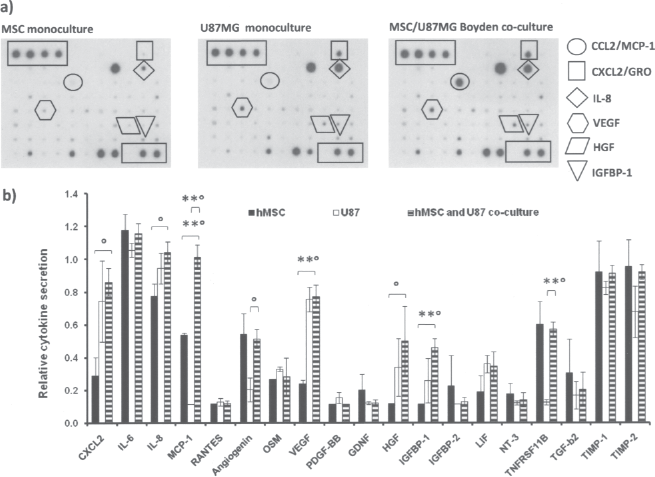
Human MSCs and U87-MG cells increase cytokine secretion in the indirect coculture. (a) Cytokine macroarray profiling of the media from hMSCs, U87-MG, and cocultured cells. Each dot on the membranes represents detection of a specific chemokine. (b) Cytokine quantifications are shown on a bar graph as relative strength of the signal dot. The error bars represent the SEM. p < 0.05 (°significant with Student' t-test; **significant after p-value correction with adjusted Bonferroni).
Gene Expression Analysis of the hMSC and U87-MG Cell Cocultures Confirmed the Enhanced Cytokine Expression
The Illumina whole genome expression microarrays data analysis revealed transcriptomic differences between mono- and cocultured cells that we provided as lists of differentially expressed genes (supplemental material: Table S1, Table S2; supplementary material can be viewed and downloaded from: http://www.nib.si/eng/index.php/oddelki/oddelek-za-genetsko-toksikologijo-in-biologijo-raka/raziskovalni-programi-in-projekti/mednarodni-projekti.html?view=details&id=75). Human MSCs grown in coculture display almost twice the number (519) of differentially expressed genes (p < 0.01) compared to U87-MG cells where only 321 genes were differentially expressed (p < 0.01) in coculture, indicating a more prominent effect of tumor cells on the normal hMSCs in the coculture than vice versa. This is consistent with the log2 fold change (Fc) difference of gene expression that was in general much higher in hMSCs (max log2 Fc difference 4.8) compared to U87-MG cells where log2 Fc values were halved.
The above became even more evident when high stringency criteria were applied that generated only 12 differentially expressed mRNA transcripts in cocultured U87-MG cells (Table 1) and 57 differentially expressed mRNA transcripts in cocultured hMSCs (Table 2). In both cell lines more upregulated than downregulated genes (Tables 1 and 2) were observed. Among the most regulated genes in U87-MG cells were the ones involved in proliferation/growth (Pmepa-1, Fap, Ereg), adhesion/ motility (EphB2, Adam19, Prss35, SerpinB2), and senescence/apoptosis (Kiaa1199, Sod2, IL24), whereas in hMSCs altered genes in cocultured hMSCs were mainly associated with immunomodulation (IL-6, IL-8, Ccl2, IL1B, Cxcl6, Lif, CfB, Tiparp, Tnfaip3, Cxcl2), adhesion/motility (Plat, Itga2, Matn2, Acan, Gap43, Pcdh18), angiogenesis (Apold1, Lypd1, Id3), and apoptosis/autophagy (Tgm2, Ier3, Zc3h12A, Dram, Akr1B10). Ccl2/Mcp-1 emerged among the top three gene transcripts that were highly differentially expressed in cocultured hMSCs.
Differentially Expressed Genes of Cocultured U87-MG Cells

The genes listed are differentially expressed genes in U87-MG cells grown in coculture with hMSCs relative to U87-MG cells grown in monoculture that passed high stringency criteria of p < 0.01, absolute log2 Fc > 1.0.
Differentially Expressed Genes of Cocultured hMSCs

Genes listed are differentially expressed genes in MSCs grown in coculture with U87-MG cells relative to hMSCs grown in monoculture that passed high stringency criteria of p < 0.01 and absolute log2 Fc > 1.0.
The coculture's gene expression data almost completely overlapped with the cytokine analysis, confirming increased expression of chemokines IL-6, IL-8, leukemia inhibitory factor (LIF), CCL2/MCP-1, and CXCL2 (compare Fig. 4b and Table 2). Moreover, when less stringent criteria were applied (p < 0.01) to transcriptomic analysis, increased VEGF-A gene expression in hMSCs and decreased IGFBP1 and TNFRSF1B gene expression in U87-MG cells were additionally confirmed (supplemental Table S2; supplementary material can be viewed and downloaded from: http://www.nib.si/eng/index.php/oddelki/oddelek-za-genetsko-toksikologijo-in-biologijo-raka/raziskovalni-programi-in-projekti/mednarodni-projekti.html?view=details&id=75).
Functional Analysis of the Microarray Data Confirmed CCL2/MCP-1 to Be the Key Mediator of hMSC/U87-MG Cellular Communication
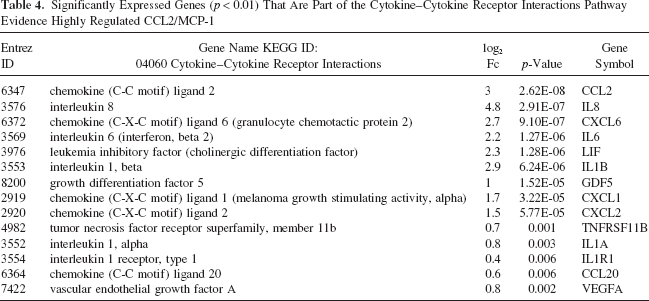
We performed Ontology enrichment analysis in KEGG and GO (gene ontology). In KEGG, the ontology terms that contained up- and downregulated hMSC genes (Table 3) identified three pathways (Nodd-like receptor signaling pathway, cytokine–cytokine receptor interactions, and chemokine signaling pathway) (Table 4), all including CCL2/MCP-1 in a combination with VEGF-A and LIF, which were identified also with cytokine macroarrays. Moreover, GO (cellular component) enrichment analysis (data not shown) identified several cell adhesion and migration-associated ontology terms, implying that hMSCs have an influence on U87-MG cell invasion.
CCL2/MCP-1 Identification in hMSC/U87-MG Communication With KEGG Pathway Analysis of Upregulated or Downregulated Differentially Expressed Genes (p < 0.01) in Cocultured hMSCs

Significantly Expressed Genes (p < 0.01) That Are Part of the Cytokine–Cytokine Receptor Interactions Pathway Evidence Highly Regulated CCL2/MCP-1
Validation of the Gene Expression Data
As CCL2/MCP-1 has been identified to be highly increased in cocultured hMSCs (p-value 2.620E08), it was validated with qRT-PCR, together with GJA1/Cx43 and NF-κB genes that showed significant upregulation in cocultured cells only at borderline value of p < 0.05 (supplemental Table S2; supplementary material can be viewed and downloaded from: http://www.nib.si/eng/index.php/oddelki/oddelek-za-genetsko-toksikologijo-in-biologijo-raka/raziskovalni-programi-in-projekti/mednarodni-projekti.html?view=details&id=75). Those two genes were chosen as it was hypothesized (29,47) that they both function in CCL2/MCP-1 signaling. With qRT-PCR we confirmed almost 12-fold increase of CCL2/ MCP-1 expression in hMSCs (Fig. 5a), whereas its expression did not change in U87-MG cells. The qRT-PCR results for NF-κB in cocultured hMSCs and GJA1/ Cx43 in cocultured U87-MG cells (Fig. 5b, c) were in accordance with the log2 Fc obtained from the cDNA microarray data analysis (supplemental Table S2; supplementary material can be viewed and downloaded from: http://www.nib.si/eng/index.php/oddelki/oddelek-za-genetsko-toksikologijo-in-biologijo-raka/raziskovalni-programi-in-projekti/mednarodni-projekti.html?view=details&id=75).

qRT-PCR analysis of (a) chemokine (C-C motif) ligand 2/monocyte chemotactic protein-1 (CCL2/MCP1), (b) nuclear factor of κ light polypeptide gene enhancer in B-cells (NF-κB, (c) gap junction protein α 1/connexin-43 (GJA1/Cx43), and (d) CCR2 mRNA levels in hMSC/GBM cells grown alone or in the indirect coculture (IC). The error bars represent the SEM. *p < 0.05.
CCL2/MCP-1 Plays a Role in the Invasion of Glioblastoma Cells
To determine whether the CCL2/MCP-1 secretion by hMSCs indeed impaired the GBM cell invasion, we performed the neutralization invasion experiment with anti-CCL2 and anti-CCR2 antibodies. The presence of the CCR2 receptor has been confirmed in all cell types by qRT-PCR (Fig. 5d). The addition of either the anti-CCL2 (Fig. 6a) or anti-CCR2 antibodies (Fig. 6b) significantly diminished hMSC's impact on GBM cell invasion, bringing the invasion potential of GBM cells back to the level of the control cells. On the contrary, when testing the impact of GBM cells on the hMSC invasion potential (Fig. 6a, b) we only noticed a nonsignificant decrease of the invasion in the presence of the neutralizing antibodies. These results suggest that CCL2/MCP-1 is important for the mediation of GBM cell invasion toward hMSCs only and does not seem to play a role in hMSC invasion toward GBM.

CCL2/MCP1 influences the invasion potential of GBM cells. (a) The impact of neutralizing CCL2/MCP-1 and (b) chemokine, cc motif, receptor 2 (CCR2) antibody on hMSC and GBM invasion potential in monocultures and cocultures. The error bars represent the SEM. *p < 0.05, **p < 0.01.
Data Mining Revealed Putative Novel Mechanisms That Can Direct Proliferation, Invasion, and Senescence of hMSC and U87-MG Cells in CoCulture
BioMine data mining visualization analysis (http://biomine.cs.helsinki.fi/search/) applied on our differentially expressed genes (Tables 1 and 2) (data not shown) revealed also EphB2 receptor gene to interact with Mmp9, Mmp2, and Vegf-A gene, of which Mmp2 was also found to be upregulated in U87-MG cells (supplemental Table S2; supplementary material can be viewed and downloaded from: http://www.nib.si/eng/index.php/oddelki/oddelek-za-genetsko-toksikologijo-in-biologijo-raka/raziskovalni-programi-in-projekti/mednarodni-projekti.html?view=details&id=75). Yet, both were found to functionally associate with CCR2 receptor that binds CCL2/MCP-1. Similarly, Kiaa1199 gene in U87-MG cells seems to interact directly with PlxnA1 gene, but only functionally associate with plasminogen activator inhibitor 2 (PAI-2) protein coded by SerpinB2 gene via GCF protein. Moreover, when checking for the existence of functional association among regulated genes in hMSCs, BioMine search revealed cytokine signaling pathways of LIF, IL-6, and oncostatin M to be functionally associated directly with CCL2 protein, known to associate with superoxide dismutase 2 (SOD2) via IL-1b. According to the data mining of our transcriptomic and cytokine macroarray data, herein we propose novel mechanisms that can direct proliferation, invasion, and senescence of hMSC and U87-MG cells, grown in indirect coculture (Fig. 7).

A generalized scheme of hMSC/U87-MG cell cross-communication in the coculture. Up- and downregulated genes in the cocultured cells (depicted with up and down arrows) were found to associate with cellular process of proliferation, survival, and invasion. CCL2/MCP-1 appears to be a key mediator of hMSC/U87-MG cell communication, where invasion impairment is possibly regulated through the presence of cell adhesion contacts (triangles).
Discussion
Human MSC homing ability toward glioma makes hMSCs attractive vehicles for delivery of therapeutic products. The idea is hampered by the lack of understanding the mechanisms of communication between hMSCs and glioma cells. Herein, we demonstrate that GBM cells enhance proliferation and invasion potential of hMSCs, whereas hMSCs decrease the proliferation and invasion of GBM cells. Our results are consistent with previously published in vivo (44) and in vitro models (25) that speak in favor of naive hMSC use in therapeutic application. In addition, we provide evidence and propose genetic links of hMSC effects on GBM cells toward less malignant phenotype by identifying several novel marker genes, associated with CCL2/MCP-1 signaling.
CCL2/MCP-1 Signaling May Play a Role in hMSC/GBM Cross-Communication
We demonstrated that hMSC/GBM paracrine communication is mediated via secretion of certain chemokines, most notably CCL2/MCP-1, whose gene expression increased up to 12-fold in cocultured hMSCs, but remained poorly expressed in GBM cells, as expected (46). CCL2/MCP-1 is primarily known to activate and recruit cells of the monocyte lineage (40) to the glioma (23), where they can promote tumor growth via increased immune cell infiltration (42) or drive metastatic cell migration (36). Yet, CCL2/MCP-1 is not restricted to immune system in vivo, but can also play a role in differentiation of human neural progenitor cells (29) and as strongly supported by our data may also regulate the hMSC/GBM cell interactions (Fig. 7).
The CCL2 and CCR2 knockout mice models confirmed that CCL2 in vivo effects depend entirely on its receptor CCR2 binding (36). CCR2 is expressed in most primary GBM specimens (20), and GBM cell lines (U87, U251-MG, U373, A172, SNB19) confirmed by us (Fig. 5) and others (20,33). We are thus speculating that hMSCs are taking the advantage of the CCL2/CCR2 signaling, to proliferate, survive, and display inhibitory effects on GBM cells.
Cell Growth Is Impaired in the Cocultures
The proliferation index of hMSCs increases in coculture with GBM cells and this seems to be a joint effect of CCL2/MCP-1 and other identified highly regulated genes. CCL2/MCP-1 is known to induce cell proliferation (32) via IL-6, NF-κB/activator protein-1 (59), and VEGF-A (31). Herein, we are speculating that CCL2/ MCP-1 might be responsible for the increased proliferation of cocultured hMSCs, where increased expression/ secretion of IL-6, NF-κB, and VEGF-A was detected.
In contrast, we found that coculture with hMSCs decreases the proliferation of U87-MG cells, in which Pmepa-1 (prostate transmembrane protein/androgen induced-1) is significantly overexpressed. PMEPA-1 is responsible for regulating protein turnover in the cells via ubiquitination/proteasome pathway, causing cell growth inhibition and this way having a prognostic impact on cancer relapse (63). When overexpressed in GBM, Pmepa-1 might thus be responsible for their decreased proliferation and may represent a novel putative marker implying on (less) tumorigenic revertant GBM phenotype.
Cellular Cross-Talk Has Impact on Cell Fitness
The induction of pro-apoptosis/senescence genes Kiaa1199, EphB2, and SerpinB2 in cocultured U87-MG cells (Table 1) may cause them to senesce as the upregulation of Kiaa1199 gene is known to induce replicative senescence in renal carcinoma cells (41), whereas the overexpression of ephrin receptor B2 (EPHB2) is known to reduce mitotic figures and increase apoptotic/senescent cells numbers in colon cancer (55). A similar effect was observed in cocultured U87-MG cells (Fig. 3). On the contrary, SerpinB2 gene (Table 1), known as PAI-2 and acting intracellular as apoptotic suppressor (64), was found downregulated in cocultured U87 cells. Collectively, changed expression of Kiaa1199, SerpinB2, and EphB2 in cocultured U87-MG cells implies a possible hMSC role in the initiation of U87-MG senescence.
In contrast, we hypothesize that increased Ccl2/Mcp1 gene expression in cocultured hMSCs may protect those hMSCs against apoptosis, possibly due to the fact that CCL2/MCP-1 elicits fibroblast and neuron/astrocytes survival through PI3K/Akt/survivin and ERK1/2-IL6-STAT3 signaling (11,34). During our study we have not observed any gross changes in hMSC morphology, implying that cocultured hMSC viability remained intact.
hMSC/U87-MG Invasive Phenotype Changes in Coculture
Cell invasion is a multistep process, which is associated with decreased cell–cell adhesion, increased motility, and the degradation of extracellular matrix (ECM). Among various types of invasive mechanisms (13) the mesenchymal type of invasion, which is associated with GBM, relies on ECM matrix degradation where proteolytic enzymes play a major role (28,30,50). Yet, our transcriptomic analysis revealed only altered expression of Serpin inhibitor, Mmp1, Mmp2, and TIMPs (supplemental Table S1; supplementary material can be viewed and downloaded from: http://www.nib.si/eng/index.php/oddelki/oddelek-za-genetsko-toksikologijo-in-biologijo-raka/raziskovalni-programi-in-projekti/mednarodni-projekti.html?view=details&id=75), out of numerous cancer degradome-related genes (10). This could be explained by proteolytic enzyme regulation at the posttranslational level as was confirmed by us (14) for lysosomal enzyme cathepsin B in GBM tumors in vivo, where despite its increased activity its mRNA expression remained unchanged. It is also consistent with the transcriptomic data published on the invasive versus stationary GBM cell phenotype by the Berens' group (8,38).
Further we showed that the addition of anti-CCL2/ MCP-1 or anti-CCR2 antibodies significantly increased the invasion potential of several GBM cell lines in the coculture, possibly by attenuating inhibitory effect of hMSCs. CCL2/MCP-1 may thus play a role in GBM migration/invasion toward hMSCs, which is in accordance with CCL2/MCP-1-mediated invasion of cancer PC3 cells (17) by yet unknown mechanism. One explanation suggests CCL2/MCP-1 to influence the adhesion of cocultured U87-MG cells (57) and is supported by our results of increased expression of Col7A1 (collagen, type VII, α1) (supplemental Table S1; supplementary material can be viewed and downloaded from: http://www.nib.si/eng/index.php/oddelki/oddelek-za-genetsko-toksikologijo-in-biologijo-raka/raziskovalni-programi-in-projekti/mednarodni-projekti.html?view=details&id=75), the main component of anchoring fibrils (39) and Gja1/Cx43 gene (Fig. 5c), which is known to influence astrocyte's adhesion/migration (47).
BioMine search (data not shown) also revealed the existence of functional association between CCL2/MCP1 and EPHB2 through matrix metalloproteinases MMP2 and MMP9. EPHB2 plays a role in cell adhesion and repulsion processes [e.g., contact guidance during neurite outgrowth (26) and colorectal tumor cell migration (55)]. Since CCL2/MCP-1 functionally associates with GJA/ Cx43 through SRC protein (BioMine data), it is possible that CCL2/MCP-1 joint regulation of the above-mentioned COL7A1, GJA1/Cx43, and EPHB2 expression is responsible for higher adhesion and lower invasion potential of cocultured U87-MG cells.
On the contrary, the enhanced hMSC invasion toward GBM cells is not only due to CCL2/MCP-1 as neither anti-CCL2/MCP-1 antibody nor anti-CCR2 antibody could abolish the GBM coculture effect on hMSC migration. As such our results are consistent with Ringe et al.'s results, confirming unresponsiveness of hMSCs to CCL2/ MCP-1 (52), but inconsistent with Xu et al., who claimed the opposite (62). Chemokines IL-8, CXCL2/GRO, and CXCL6/GCP-2 that were detected in hMSC/GBM coculture medium are known to enhance hMSC migration toward ischemic cerebral tissue (60), rat glioma cells (62), and U87-MG cells (24). Also identified up- and downregulated genes in cocultured hMSCs, manganese superoxide dismutase (Sod2) and protocadherin 18 (Pcdh18), are known to increase migration of fibrosarcoma cells (7) by reducing focal cell adhesions and enhancing cell dissociation (1), which may have occurred in cocultured hMSCs.
Even though with the above results we can quite satisfactorily explain the inhibitory effects hMSCs have on GBM cells that were observed in vitro by us and Kucerova et al. (25) and in vivo by Nakamura et al. (44), the question still remains why tumor-promoting role of hMSCs was observed in some other cancer models (2). Very likely the tumor response correlates with host stroma cell chemokine secretion and generation of a microenvironment conductive for tumor growth, invasion, and metastasis. hMSCs may contribute to it, possibly upon their tumor-induced transformation, that in vitro needs to be confirmed (43,58). In this respect our results show that CCL2/MCP-1 may represent a molecular link in the cross-talk between glioma cells and hMSCs and that a completely novel antimigratory role in cancer could be assigned to CCL2/MCP-1 besides inflammation.
In conclusion, our study provided evidence and proposed genetic links of hMSC effects on GBM cells toward less malignant (invasive) phenotype by identifying several novel gene markers associated with CCL2/MCP-1 signaling. Those markers may represent potential therapeutic targets for the treatment of GBM. CCL2/MCP-1 and various other cytokines have been identified as important regulators of glioblastoma and stem cell functions (15), so the immune system has emerged as an important regulator of neurogenic niches in the adult brain that could, if deregulated, possibly sustain/inhibit glioblastoma development.
Footnotes
Acknowledgments
This work was supported by the Systher/INREMOS project on Systems Biology Tools development for cell Therapy and Drug Development (Con. No.: 3211-06-000539; 2006–2011) and by the Slovenia Research Agency supporting the Program P1-0245 (to T.L.L.). The authors declare no conflicts of interest.