
Abstract
The introduction of cyclosporine (CsA) has improved graft survival, but it causes nephropathy, which limits its clinical utility. Recently, we reported that carbamylated erythropoietin (CEPO) protected kidneys from ischemia reperfusion injury as well as EPO. To investigate the clinical applications of CEPO, we next evaluated the long-term therapeutic effect of CEPO using a CsA-induced nephropathy model. CsA caused renal dysfunction, while EPO/CEPO administration significantly improved renal function. EPO treatment significantly increased Hb concentration, while CEPO treatment neither enhanced nor reduced Hb concentration. CsA treatment induced tubular apoptosis, while EPO/CEPO administration inhibited it and increased PI3 kinase activation and Akt phosphorylation. In parallel, morphological assessment revealed that EPO/CEPO significantly reduced CsA-induced interstitial fibrosis and inhibited interstitial macrophage infiltration. In addition, real-time RT-PCR demonstrated that cortical mRNA levels of TGF-β1 and type I collagen were suppressed in the EPO/CEPO group. These results suggest a new therapeutic approach using CEPO to protect kidneys from CsA-induced nephropathy.
Introduction
The introduction of cyclosporine (CsA) into clinical practice has resulted in marked improvement in the short-term outcome of organ transplantation, and 1-year survival of renal allograft patients has improved significantly (2,23). However, the dose-limiting adverse effect of long-term CsA administration is chronic nephropathy, which remains an unsolved problem in transplant therapy and limits the clinical utility of CsA (1,2). Chronic CsA nephropathy may progress to an irreversible renal lesion characterized by tubular atrophy, striped interstitial fibrosis, hyalinosis of the afferent arteriole, and progressive renal impairment (21,27). While acute CsA nephropathy is thought to result from intrarenal vasoconstriction, the mechanism leading to the interstitial fibrosis of chronic CsA nephropathy remains unclear. Previous studies showed that tubular epithelial cells underwent apoptosis in the course of immunosuppression with CsA (33). In addition, CsA-induced nephropathy is associated with upregulation of transforming growth factor-β1 (TGF-β1) and type I collagen; TGF-β1 is very important in the progression of CsA nephropathy (28).
Recently, the extrahematopoietic effects of erythropoietin (EPO) have been extensively investigated. The initial understanding of the biology of EPO-mediated tissue protection largely developed from the study of the nervous system (25), which is susceptible to ischemic injury due to its high basal metabolic rate. The findings derived from the nervous system studies are applicable to the kidney (11,20). The normal kidney, like the nervous system, is characterized by regions in which energy substrates are limited. Chronic renal hypoxia with subsequent tubulointerstitial injury commonly leads to endstage renal failure (22). In contrast, early treatment with EPO slows the progression of renal failure (24). In the kidney, a potential role for the nonhematopoietic activities of EPO was first suggested by the identification of the EPO receptor (EPO-R) protein that is expressed throughout the kidney, including both proximal and distal tubular cells (3). However, the affinity of these receptors (-1 nM) is well below the normal plasma EPO concentration (1–10 pM). Therefore, EPO's cytoprotective effect may require higher doses than those used to treat anemia. However, recent clinical trials have suggested that higher doses of EPO are likely to be associated with adverse effects (8). Furthermore, a recent report demonstrated that a high hemoglobin level in patients with chronic kidney disease was associated with increased risk and no incremental improvement in the quality of life (31).
Recently, a second receptor for EPO that mediates EPO's tissue protection has been identified as consisting of the EPO-R and the β-common (CD131) receptor (Cβ-R). Carbamylated EPO (CEPO) is reported to signal only through this receptor and not through the homodimeric EPO-R (18). It has been shown that CEPO does not stimulate erythropoiesis, but it prevents tissue injury in spinal cord neurons (18,26) and cardiomyocytes (4,7). We previously reported that CEPO protect the kidneys from ischemia-reperfusion injury (10,12) and unilateral obstruction injury (16). Although these observations demonstrated the short-time therapeutic effect of CEPO, long-term effects of CEPO have not been studied. The present study investigated the effects of continuous CEPO administration in the rat CsA-induced nephropathy model.
Materials and Methods
Animals and Drugs
Six-week-old male Sprague-Dawley (SD) rats (SLC Japan, Hamamatsu, Japan), initially weighing 140–170 g, were maintained in a controlled-temperature and controlled-light environment and allowed free access to a low-salt diet (0.003% sodium; CLEA Japan, Inc., Tokyo, Japan) throughout the experimental periods. Body weight was monitored weekly for adjustment of drug dosage.
CsA (kindly provided by Novartis Pharma Ltd., Tokyo, Japan) was diluted in sesame oil to a final concentration of 15 mg/ml. CEPO was synthesized from human EPO (Epoetin alfa, kindly provided by Kirin Corp., Tokyo, Japan) as previously described (18). EPO and CEPO were diluted with sterile saline and adjusted to a final concentration of 2,000 IU/ml.
Experimental Protocols
All studies were performed in accordance with the principles of the guideline for animal experimentation at Osaka University. SD rats were randomly allocated to four groups: 1) control group (n = 8), rats received sesame oil and sterile saline; 2) CsA group (n = 8), rats received CsA and sterile saline; 3) CsA/EPO group (n = 8), rats received both CsA and EPO; and 4) CsA/CEPO group (n = 8), rats received both CsA and CEPO. The control group was given a subcutaneous injection of 0.3 ml sesame oil daily for 4 weeks and an intraperitoneal injection of 0.3 ml sterile saline thrice weekly. CsA group rats were given a subcutaneous injection of 30 mg/kg CsA daily for 4 weeks and an intraperitoneal injection of 0.3 ml sterile saline thrice weekly. CsA/EPO and CsA/CEPO group rats were given a subcutaneous injection of 30 mg/kg CsA daily for 4 weeks and an intraperitoneal injection of 1,000 IU/kg EPO and CEPO thrice weekly, respectively. The dosage and method of CsA administration were chosen based on the previous report (19). On day 28, blood samples were collected, and the kidneys were removed after perfusion with 20 ml of cold PBS. The cortex was carefully dissected from the medulla and then processed for evaluation by mRNA and protein analysis, light microscopy, and immunohistochemistry. Tissues for RNA and protein extraction were frozen using liquid nitrogen, and tissues for light microscopy and immunohistochemistry were fixed with 4% paraformaldehyde overnight, dehydrated through a graded ethanol series, and embedded in paraffin.
Analysis of Plasma Samples
Serum creatinine and blood urea nitrogen (BUN) levels were measured by the creatinase-peroxidase method and the urease-ultraviolet method, respectively (SRL, Inc., Osaka, Japan).
Antibodies
To identify myofibroblasts and macrophages, anti-human α-smooth muscle actin (α-SMA) antibody (EPOS System: Dako, Hamburg, Germany) and ED-1 (CD68) antibody (1:1000, AbD Serotec, Oxford, UK) were used. To detect the pathways that protect the kidneys, the following antibodies were used for immuno-chemical testing: polyclonal phosphatidylinositol-3 kinase (PI3K) p85a antibody (1:10,000, Cell Signaling Technology, Inc., Beverly, MA, USA), polyclonal phospho-Akt (Ser473) antibody (1:10,000, Cell Signaling Technology, Inc.), and polyclonal Akt antibody (1: 10,000, Cell Signaling Technology, Inc.). Protein levels were normalized with polyclonal β-actin antibody (1:10,000, Cell Signaling Technology, Inc.).
Morphology and Immunohistochemical Staining
Tissue samples were fixed in 4% (w/v) buffered paraformaldehyde (PFA) for 16 h and embedded in paraffin. Then 3 μm of tissue sections were mounted on silane (2% 3-aminopropyltriethoxysilane)-coated slides (Muto Pure Chemicals, Tokyo, Japan) and deparaffinized with xylene. Histologic sections were stained with periodic acid-Schiff (PAS) and Masson's trichrome stains. Tubulointerstitial injury was evaluated on PAS-stained sections by the presence of lesions, including tubular casts, dilation and atrophy, thickening of tubular basement membrane, and interstitial matrix expansion. The interstitial fibrotic area was stained blue with Masson's trichrome staining, and a color image analyzer estimated the area quantitatively.
Immunohistochemical staining was done using the Envision system (Dako), according to the manufacturer's instructions. Antigen retrieval was performed for 10 min in preheated, 10 mmol/L sodium citrate (pH 7) using an autoclave. Endogenous peroxidase activities were blocked with peroxidase blocking solution (Dako) for 10 min. The first antibodies were diluted in 1% bovine serum albumin (BSA) in phosphate-buffered saline (PBS) with 0.1% Tween 20 (PBS-T) at specific concentrations, and then incubated for 12 h at 4°C. This was followed by incubation with suitable secondary antibodies (Dako). All incubations were performed in a humidified chamber. Chromogenic color was developed with 3,3′-diaminobenzidine tetrahydrochloride (DAB; Dako). Negative controls, omitting the first antibodies, were carefully examined for each reaction. The nuclei were counterstained with hematoxylin. All histological slides were examined by light microscopy using a Nikon Eclipse 80 i (Nikon, Tokyo, Japan); pictures were taken with the Nikon ACT-1 ver. 2.63. The fibrotic area and the α-SMA-positive area relative to the total area of the field were calculated as a percentage by a computer-aided manipulator (microscope) (Leitz DM IRB, software) (Quantimet 500+) (Leica, Tokyo, Japan). Large vessels were not included in the microscope fields for image analysis. The scores of 10 fields per kidney were averaged, and the mean scores for each group were then averaged. For ED-1 staining, the number of positive cell nuclei was counted in 10 random high-power fields (200×) of each slide and averaged.
RNA Extraction and Quantitative RT-PCR
To verify the different expressions of TGF-β1 and type I collagen mRNA from the renal cortex, the reverse transcription (RT)-polymerase chain reaction (PCR) was used after quantitative normalization for each gene using β-actin gene expression. Total RNA from the renal cortex was obtained using the RNAqueous kit (Ambion Austin, TX, USA), and total RNA (1 μg) was reverse transcribed to cDNA by 18-mer oligo(dt) primer and the First Strand cDNA kit (Promega, Madison, WI, USA) following the manufacturers' protocols. For real-time PCR, SYBR Premix Ex Taq (Takara Bio, Otsu, Japan) was used to detect TGF-β1 and type I collagen expression with a Dice TP 800 Thermal Cycler (Takara Bio). The primers used were as follows: β-actin (5′-GGA GAT TAC TGC CCT GGC TCC TA-3′ and 5′-GAC TCA TCG TAC TCC TGC TTG CTG-3′, product size: 150 bp), TGF-β1 (5′-TGC GCC TGC AGA GAT TCA AG-3′ and 5′-AGG TAA CGC CAG GAA TTG TTG CTA-3′, product size: 82 bp), COL1A1 (5′-CAT CTC CAT GGC CTC TGC AA-3′ and 5′-CAC ATG TGT GGC CGA TGT TTC-3′, product size: 137 bp) at optimal annealing temperatures (60°C). The value for the expression of each target gene was calculated as the relative quantity of each gene divided by the relative quantity of β-actin.
TUNEL Staining
Terminal deoxynucleotidyltransferase-mediated dUTP nick end-labeling (TUNEL) staining was performed using the in situ Apoptosis Detection Kit (Takara Bio), according to the manufacturer's instructions. Briefly, the sections were deparaffinized and treated with proteinase K (10 μg/ml) for 15 min at room temperature. They were then incubated with peroxidase blocking solution (Dako) for 10 min, which was followed by incubation with TdT enzyme solution for 60 min at 37°C. The reaction was terminated by incubation in a stop/wash buffer for 30 min at 37°C. Chromogenic color was developed with DAB. The number of TUNEL-positive cell nuclei was counted in 10 random high-power fields (200×) of each slide and averaged.
Western Blot Analysis
Kidney tissue was homogenized in a radioimmunoprecipitation (RIPA) Lysis Buffer with phenylmethylsulfonylfluoride (PMSF) solution, sodium orthovanadate solution, protease inhibitor (Santa Cruz Biotechnology, Inc., CA, USA), and phosphatase inhibitor (Sigma-Aldrich Corporation, St. Louis, MO, USA). Homogenates were centrifuged (12,000 × g for 10 min at 4°C), and the supernatant total protein was measured using the Lowry protein assay (Bio-Rad, Hercules, CA, USA). Total protein lysate (15 μg) containing 1:1 denaturing sample buffer was boiled for 3 min and resolved on 10.0% SDS-polyacrylamide gels and electrophoretically transferred onto an immobilon PVDF membrane (Millipore, Bedford, MA, USA). The filter was blocked with 2% ECL Advance Blocking Agent (Amersham Bioscience Corp., Piscataway, NJ, USA) in 10 mM Tris-buffered saline with 0.1% Tween 20 (TBS-T), followed by overnight incubation at 4°C with diluted primary antibodies in blocking buffer. After washing five times in TBS-T, the filter was incubated with secondary antibody (1:10,000) (Cell Signaling Technology, Inc.) in blocking buffer for 60 min at room temperature and developed to detect specific protein bands using ECL advance reagents (Amersham Bioscience Corp.). The band density was analyzed using NIH image software.
Statistical Analysis
The data are expressed as means ± SD. Statistical analysis was performed using the Tukey test for parametric multiple comparisons and the Steel-Dwass test for nonparametric multiple comparisons. Differences were considered statistically significant at p < 0.05.
Results
Effect of EPO/CEPO on Body Weight, Erythropoiesis, and Renal Function
The effects of EPO/CEPO on body weight, erythropoiesis, and renal function in CsA-treated rats are summarized in Table 1. At baseline, there was no difference in body weight among the groups. At the end of the treatment period, CsA-treated rats weighed 15% less than those in the control group (CsA group, 187 ± 11 g vs. control group, 221 ± 20 g; p < 0.01), while additional treatment with EPO/CEPO ameliorated the weight gain disturbance (208 ±12 and 204 ± 9 g, respectively; not significant vs. control group). CsA alone significantly reduced weight gain (CsA group, 17.5 ± 4.4% of baseline vs. control group, 32.4 ± 9.7% of baseline; p < 0.01), while EPO/CEPO treatment significantly improved weight gain (29.4 ± 5.3% and 29.5 ± 6.5% of baseline, respectively; p < 0.01 vs. CsA group). There was no significant difference in weight gain between the control group and the EPO/CEPO group.
Effect of EPO and CEPO on Body Weight, Erythropoiesis, and Renal Function

The data are expressed as means ± SD. CsA, cyclosporine; EPO, erythropoietin; CEPO, carbamylated EPO; BUN, blood urea nitrogen.
p < 0.01 versus control group.
p < 0.05 versus EPO group.
p < 0.01 versus CsA group.
p < 0.01 versus CEPO group.
p < 0.05 versus CsA group.
Compared to saline treatment, EPO treatment significantly increased Hb concentration (CsA group, 16.5 ± 1.2 g/dl vs. EPO group, 20.4 ± 0.9 g/dl; p < 0.01). On the other hand, CEPO treatment neither enhanced nor reduced Hb concentration (15.9 ± 0.7 g/dl; p = 0.44 vs. CsA group), suggesting that CEPO, unlike EPO, does not stimulate erythropoiesis. CsA-treated rats had increased serum creatinine levels (CsA group, 1.17 ± 0.24 mg/dl vs. control group, 0.21 ± 0.02 mg/dl; p < 0.01), while treatment with EPO/CEPO significantly suppressed the creatinine increase (EPO group, 0.82 ± 0.11 mg/dl; p < 0.01 vs. CsA group; CEPO group, 0.73 ± 0.21 mg/dl; p < 0.05 vs. CsA group).
Effect of EPO/CEPO on Tubulointerstitial Injury
PAS staining revealed that CsA treatment induced characteristic histological changes, including tubular atrophy and dilation, inflammatory cell infiltration, and severe interstitial fibrosis. However, EPO/CEPO administration alleviated these tubulointerstitial manifestations (data not shown). The interstitial fibrotic area was stained blue on Masson's trichrome staining (Fig. 1a, A–D), and a color image analyzer estimated the area quantitatively (Fig. 1b). The CsA group showed progression of interstitial fibrosis (CsA group, 12.2 ± 2.0% vs. control group, 3.1 ± 1.2%; p < 0.01) (Fig. 1a, B). In parallel with the findings on PAS staining, EPO/CEPO administration significantly suppressed the development of interstitial fibrosis (7.2 ± 2.6% and 6.7 ± 2.7%, respectively; p < 0.01 vs. CsA group) (Fig. 1a, C, D).

Renal histopathology and immunohistochemistry. (a) Representative photomicrographs show the renal morphologic changes seen on Masson's trichrome staining (A–D) and immunohistochemistry α-smooth muscle actin (α-SMA) (E–H) and ED-1 (I–L) in the control group (A, E, I), the CsA group (B, F, J), the CsA/EPO group (C, G, K), and the CsA/CEPO group (D, H, L) on day 28. (b–d) Quantitative analysis of interstitial fibrosis with Masson's trichrome staining (b), phenotypic alteration of interstitial myofibroblasts with α-SMA staining (c), and the number of infiltrated macrophages (d) are summarized. The data are expressed as means + SD. ##p < 0.01 versus control group; #p < 0.05 versus control group; **p < 0.01, *p < 0.05. CsA, cyclosporine; EPO, erythropoietin; CEPO, carbamylated EPO. Scale bars: 100 μm.
Phenotypic Alteration and Macrophage Infiltration
Phenotypic alteration into myofibroblasts, which was estimated by immunohistochemical staining of α-SMA, leads to extracellular matrix accumulation. After 4 weeks of CsA treatment, a significant increase was noted in α-SMA (CsA group, 9.7 ± 2.9% vs. control group, 1.0 ± 0.5%; p < 0.01) (Fig. 1a, E–H). Expression of α-SMA occurred in the interstitial areas mainly adjacent to the degenerated tubules (Fig. 1a, F). However, α-SMA expression was significantly suppressed by EPO/CEPO administration (4.4 ± 0.8% and 3.4 ± 1.4%, respectively; p < 0.01 vs. CsA group) (Fig. 1a, G and H, 1c).
CsA treatment induced marked infiltration of ED-1-positive macrophages. Accumulation of ED-1-positive cells was observed around the damaged tubules and within the interstitium (Fig. 1a, I–L). The number of macrophages increased persistently in the CsA group (CsA group, 909 ± 240 cells per high power field vs. control group, 38±11 cells per high power field; p < 0.01) (Fig. 1a, J, 1d). In contrast, macrophage accumulation was significantly repressed in the EPO/CEPO groups (538 ± 192 and 486 ±191 positive cells per high-power fields, respectively; p < 0.05 vs. CsA group) (Fig. 1a, K and L, 1d).
Cortical mRNA Expression of TGF-β1 and Type I Collagen
Real-time RT-PCR analysis demonstrated that cortical TGF-β1 mRNA expression was upregulated in the CsA group compared with the control group (ratios of TGF-β1 signal to β-actin signal, 1.59 ± 0.38 in the CsA group vs. 0.43 ± 0.14 in the control group; p < 0.01) (Fig. 2a), while EPO/CEPO administration significantly reduced TGF-β1 mRNA expression (1.05 ± 0.27 and 0.89 ± 0.12; p < 0.05 and p < 0.01 vs. CsA group, respectively). Consequently, cortical type I collagen mRNA expression was induced in the CsA group compared with the control group (ratios of type I collagen signal to β-actin signal, 1.01 ± 0.14 in CsA group vs. 0.43 ± 0.09 in control group; p < 0.01) (Fig. 2b), while EPO/CEPO administration significantly reduced type I collagen mRNA expression (0.45 ± 0.10 and 0.62 ± 0.12, respectively; p < 0.05 vs. CsA group).

Cortical mRNA expressions of TGF-β1 and type I collagen by quantitative RT-PCR. Relative expressions of transforming growth factor (TGF)-β1 (a) and type I collagen (b) are shown. The cortical mRNA levels of TGF-β1 and type I collagen are suppressed in the EPO/CEPO group. The data are expressed as means ± SD. ##p < 0.01 versus control group; #p < 0.05 versus control group; **p < 0.01, *p < 0.05.
Morphologic Evidence of Apoptosis
To investigate whether EPO/CEPO administration could protect against tubular apoptosis, the apoptotic bodies, labeled as an in situ end-labeled DNA fragment with the TUNEL method (Fig. 3a, b), were examined. In parallel with the tubulointerstitial damage, tubular apoptosis was persistently increased after CsA treatment (CsA group, 16.3 ± 7.4 cells per high-power field vs. control group, 0.5 ± 0.4 cells per high-power field; p < 0.01), while EPO/CEPO administration inhibited tubular apoptosis (6.6 ± 2.4 and 5.4 ± 1.7 cells per high-power field; p < 0.05 and p < 0.01 vs. CsA group, respectively).
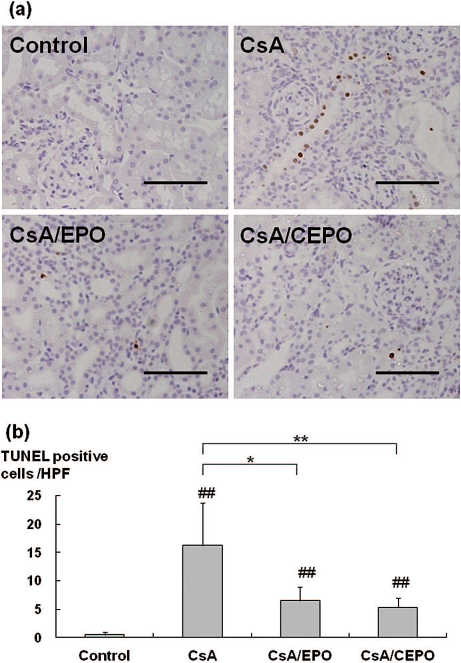
Apoptosis detected by TUNEL assay. Many terminal deoxynucleotidyl transferase dUTP nick end labeling (TUNEL)-positive cells are detected in the cortical area with CsA administration for 4 weeks and are suppressed by EPO/CEPO treatment (a). TUNEL-positive cells (b) were counted in the cortical tubular cells at 200x magnification in a minimum of 10 fields. The data are expressed as means ± SD. ##p < 0.01 versus control group; **p < 0.01, *p < 0.05. Scale bars: 100 μm.
Effect on Cell Signaling
To elucidate the intracellular erythropoietin signaling implicated in tubular protection, the expression of PI3K and the phosphorylation of Akt (Fig. 4) were examined. Western blot analysis demonstrated that treatment with EPO/CEPO significantly increased PI3K in CsA-treated kidney (ratios of PI3K signal to β-actin signal, 2.22 ± 1.30-fold increase in EPO group; p < 0.05 vs. CsA group, and 2.05±1.26-fold increase in CEPO group; p < 0.01 vs. CsA group). Phosphorylation of Akt is dependent on PI3K expression and was markedly upregulated in CEPO-treated kidneys (ratios of phospho-Akt signal to Akt signal, 2.78 ± 1.42-fold increase in CEPO group; p < 0.01 vs. CsA group). EPO treatment showed the tendency of Akt activation, but the effect of EPO on Akt was not significant (1.98 ± 1.09-fold increase in EPO group; p = 0.171, vs. CsA group), confirming that CEPO upregulated the cytoprotective signaling more strongly than EPO.
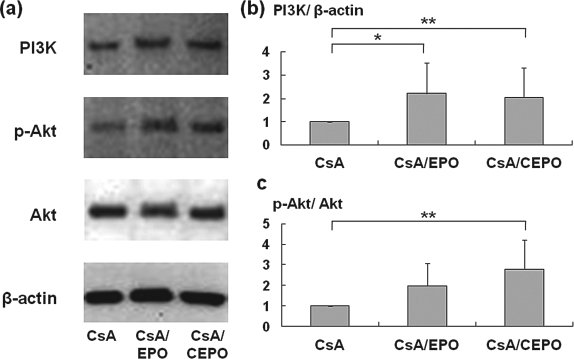
The protective mechanism of EPO/CEPO against CsA-induced apoptosis. To elucidate the intracellular EPO/CEPO signaling implicated in tubular protection, the expression of phosphatidylinositol-3 kinase (PI3K) and the activation of Akt were examined. Western blot analysis demonstrates that treatment with EPO/CEPO significantly increases PI3K and phosphorylation of Akt in CsA-treated kidneys. Relative protein levels of PI3K and p-Akt were measured by computer-aided manipulator. The data are expressed as means ± SD. **p < 0.01, *p < 0.05.
Discussion
In this study, the long-term therapeutic effect of CEPO on CsA-induced tubulointerstitial injury was demonstrated. CEPO suppressed macrophage infiltration, phenotypic alteration of interstitial myofibroblasts, and interstitial fibrosis in the CsA nephropathy model as well as EPO. Previous studies (14,17) reported that low-dose EPO (10–100 IU/kg) reduced CsA-induced tubulointerstitial injury on histopathology, but failed to improve renal function. In addition, they reported that treatment with low-dose EPO increased the Hb concentration. In the present study, daily treatment of rats with CsA for 4 weeks caused renal dysfunction, while high-dose EPO/CEPO administration (intraperitoneal injection of 1,000 IU/kg, thrice weekly) significantly improved renal function. Furthermore, high-dose EPO treatment significantly increased the Hb concentration as previously reported, while high-dose CEPO treatment neither enhanced nor reduced the Hb concentration. Considering the adverse effects of excessive erythropoiesis, CEPO seems a useful tool for long-term renoprotection.
In the present study, EPO/CEPO administration decreased TGF-β1 mRNA levels in CsA-treated kidneys. TGF-β is a fibrotic cytokine and plays an important role in CsA-induced accumulation of extracellular matrix protein. The role of TGF-β in mediating CsA nephrotoxicity has been evaluated in several studies. CsA has been shown to upregulate TGF-β expression in murine tubular cells and tubulointerstitial fibroblasts (34). In patients with chronic allograft nephropathy and CsA nephrotoxicity, there is increased TGF-β production (29). Neutralizing TGF-β antibody prevents matrix synthesis and attenuates renal injury and renal function in CsA nephrotoxicity (13). EPO/CEPO administration prevents epithelial cell death and remodeling of renal tissue with injury or fibrosis, which is completely opposite to the role of TGF-β. It is unclear whether EPO/CEPO suppresses TGF-β expression directly or indirectly, but the addition of EPO/CEPO results in suppression of TGF-β expression and inhibition of interstitial fibrosis.
We also demonstrated that another suppressive mechanism of tubulointerstitial injury may be associated with the antiapoptotic effect via the PI3K-Akt pathway. In the present study, tubular apoptosis was persistently stimulated after CsA treatment, while EPO/CEPO significantly inhibited tubular apoptosis. We demonstrated that EPO/CEPO administration increased PI3K, and thereby induced the phosphorylation of Akt in CsA-treated kidneys. Activation of Akt has been shown to protect a wide variety of cells from apoptosis. It has been reported that Akt is rapidly activated during liver regeneration, and that activation of Akt protects hepatocytes from TGF-β-induced apoptosis in vitro (9). Several downstream targets of Akt (such as E2F, c-myc, and Bad) have been implicated in cell cycle progression and antiapoptosis (6). Kashii et al. (15) reported that PI3K is activated by EPO in the EPO-dependent UT-7 leukemia cell line, where it recruits Akt. The PI3K-Akt pathway also leads to the upregulation of Bcl-xL and the inhibition of apoptosis in Baf-3 cells (5). Furthermore, using the EPO-dependent human erythroid progenitor cell line, Silva et al. (30) showed that EPO treatment maintains cell viability by repressing apoptosis through the upregulation of Bcl-xL, an antiapoptotic gene of the Bcl-2 family. We previously reported that Bcl-2 augmentation protected renal tubular epithelial cells from ischemia-reperfusion injury by inhibiting apoptosis using Bcl-2 transgenic mice (32). These results suggest that upregulation of the PI3K-Akt pathway in EPO- or CEPO-treated kidneys suppresses tubular epithelial apoptosis, likely due to the induction of antiapoptotic genes of the Bcl-2 family.
In conclusion, CEPO administration reduced CsA-induced tubulointerstitial injury in two ways: protection of tubular epithelial cells from apoptosis and inhibition of interstitial fibrosis. Furthermore, high-dose EPO treatment significantly increased the Hb concentration, while high-dose CEPO treatment neither enhanced nor reduced the Hb concentration. These observations suggest the therapeutic application of CEPO in chronic allograft nephropathy.
Footnotes
Acknowledgments
The authors are grateful to Novartis Pharma Ltd. and Kirin Corp. for supplying CsA and EPO, respectively, and wish to thank Mizuki Takeyama, Mutsumi Tsuchiya, and Izumi Kawanishi for their invaluable technical assistance. This study was supported by research grants from the Osaka Medical Research Foundation for Incurable Diseases and Grant-in-Aid for Scientific Research (C, 22591806). The authors declared no conflict of interest.