
Abstract
Stem cells might provide unlimited supply of transplantable cells for β-cell replacement therapy in diabetes. The human limbus is a highly specialized region hosting a well-recognized population of epithelial stem cells, which sustain the continuous renewal of the cornea, and the recently identified stromal fibroblast-like stem cells (f-LSCs), with apparent broader plasticity. However, the lack of specific molecular markers for the identification of the multipotent limbal subpopulation has so far limited the investigation of their differentiation potential. In this study we show that the human limbus contains uncommitted cells that could be potentially harnessed for the treatment of diabetes. Fourteen limbal biopsies were obtained from patients undergoing surgery for ocular diseases not involving the conjunctiva or corneal surface. We identified a subpopulation of f-LSCs characterized by robust proliferative capacity, expressing several pluripotent stem cell markers and exhibiting self-renewal ability. We then demonstrated the potential of f-LSCs to differentiate in vitro into functional insulin-secreting cells by developing a four-step differentiation protocol that efficiently directed f-LSCs towards the pancreatic endocrine cell fate. The expression of specific endodermal, pancreatic, islet, and β-cell markers, as well as functional properties of f-LSC-derived insulin-producing cells, were evaluated during differentiation. With our stage-specific approach, up to 77% of f-LSCs eventually differentiated into cells expressing insulin (also assessed as C-peptide) and exhibited phenotypic features of mature β-cells, such as expression of critical transcription factors and presence of secretory granules. Although insulin content was about 160-fold lower than what observed in adult islets, differentiated cells processed ~98% of their proinsulin content, similar to mature β-cells. Moreover, they responded in vitro in a regulated manner to multiple secretory stimuli, including glucose. In conclusion, f-LSCs represent a possible relevant source of autologous, transplantable, insulin-producing cells that could be tested for the reversal of diabetes.
Introduction
Type 1 diabetes is caused by the autoimmune destruction of pancreatic β-cells, which leads to their virtually complete eradication (2). Currently available options for β-cell replacement therapy (i.e., whole pancreas or isolated islet transplantation) are limited by the shortage of organ donors and the need for life-long immunosuppression (33). A variety of stem cells may be potentially harnessed for the treatment of type 1 diabetes. Embryonic stem cells (ESCs), which are able to self-renew and virtually differentiate into any phenotype, might provide an unlimited supply of surrogate β-cells. However, their clinical application is affected by ethical and technical challenges. Hence, adult multipotent stem cells are now being widely evaluated. Nevertheless, the scarcity of the source, the invasive procedures often required to isolate these cells, and their restricted differentiation potential have limited their use in translational medicine (1).
The purpose of our study was to identify a novel population of uncommitted cells that could offer advantages over the countless stem cell sources proposed so far for β-cell replacement therapy. The limbus is a highly specialized region of the eye hosting a well-recognized population of epithelial stem cells (LESCs), which continuously renew the corneal surface (8). The limbal niche is characterized by stromal invaginations that provide anatomical and functional dimensions to maintain “stemness,” protect stem cells from traumatic and environmental insults, allow epithelial–mesenchymal interactions, and supply access to chemical signals that diffuse from the rich underlying vascular network (14). A critical advantage of limbal cells is that they are easily accessible with a well-established and minimally invasive procedure (13,22,35). LESCs have been widely characterized (4,8–10,12,14) and investigated for their differentiation potential, which seems to be restricted, the corneal fate. However, human ocular stem cell research has been mainly focused on the tissue-specific differentiation that may be of clinical significance in the context of eye diseases, as demonstrated by their clinical use in ocular surface reconstruction (13,22,35). There is recent evidence that the limbal niche also hosts stromal fibroblast-like stem cells (f-LSCs), with apparent multilineage transdifferentiation potential (11,12,28). Phenotype of f-LSCs is reportedly characterized by variable expression of several stem cells markers, which are distinct from those described for LESCs (4,9,10). However, the lack of agreement on specific molecular hallmarks for the identification of the pluripotent subpopulation among the limbal stromal cells has so far limited the investigation of their differentiation potential to a few studies (11,28).
Here we describe a subpopulation of f-LSCs characterized by robust proliferative capacity, stable expression of several pluripotent stem cell markers, and self-renewal ability. We then demonstrate that f-LSCs are able to generate pancreatic endocrine cells. To this end, we have developed a four-step differentiation protocol aimed at directing f-LSCs through a series of intermediates similar to those occurring during pancreatic organogenesis, efficiently leading to production of functional hormone-expressing cells. With our stage-specific approach we obtained up to 77% of insulin-producing cells. More importantly, differentiated f-LSCs possessed the ability to secrete C-peptide in response to glucose and other stimuli, similar to mature β-cells.
Materials and Methods
Establishment of Limbal Cell Cultures
Two to three mm2 limbal biopsies were obtained from 14 patients undergoing surgery for ocular diseases not involving the conjunctiva or corneal surface. Patients gave written informed consent and the IRB of the University of Palermo approved the study according to the tenets of the Declaration of Helsinki. Briefly, explants were plated in cell culture-treated flasks following fine dissection with a sterile blade. After 24–48 h, adherent colonies of f-LSCs and small cuboidal cells (epithelial) were obtained. At the same time, floating spherical cell clusters or “limbospheres” started forming. Limbospheres progressively increased in number and size and attached to the plastic surface, eventually generating highly proliferating fibroblast-like outgrowths (see Fig. S1A, available at: https://sites.google.com/site/endocrinologycgiordano/cell-transplantation-journal_supplemental-material). To better select f-LSCs from epithelial cells, forming limbospheres were transferred into new flasks. Limbal cells were cultured in F12/DMEM medium supplemented with 10% embryonic stem cell-tested fetal bovine serum (FBS; PAA), 1x insulin-transferrin-selenium (ITS; PAA), and 4 ng/ml basic fibroblast growth factor (bFGF; Sigma-Aldrich) (expansion medium). Cultures were maintained in 5% CO2 in a humidified incubator at 37°C. Population doublings were calculated as [log10 (final cell number/starting cell number)/log102]. Karyotype analysis was performed by cytogenetic standard protocol on all primary cell cultures.
Flow Cytometry
Cells were treated with FcR blocking reagent (Miltenyi Biotec) and incubated with primary antibody at 4°C for 20 min. Cells were washed twice with PBS and incubated with secondary antibodies at 4°C for 20 min in the dark. Intracellular staining was performed using Cytofix/Cytoperm and Perm/Wash buffer (BD Pharmingen), according to the manufacturer's instructions. The sources of antibodies and dilutions used are summarized in Table S1A (see supplementary material at: https://sites.google.com/site/endocrinologycgiordano/cell-transplantation-journal_supplemental-material). Freshly isolated peripheral blood mononuclear cells (PBMCs) and HeLa cells were used as positive controls for hematopoietic markers and p63(ΔN), respectively. Data were acquired on a FACSCalibur and analyzed using CELL Quest Pro software (Becton Dickinson) and are representative of at least five independent experiments.
Assessment of Self-Renewal Ability
Prior to assay, cells were sorted for stage specific embryonic antigen 4 (SSEA4) to ensure a purified f-LSC population. Single-cell suspension of undifferentiated f-LSCs was labeled with mouse anti-human SSEA4 antibody (Santa Cruz Biotechnology, sc-21704). Magnetic isolation was carried out by Magnetic Activated Cell Sorting (MACS®) technology using goat anti-mouse IgG microbeads (Miltenyi Biotec), according to the manufacturer's instructions. After sorting, cell purity was evaluated by flow cytometry and immunofluorescence. Sorted SSEA4+ f-LSCs were then labeled with CellTrace™ Carboxyfluorescein succinimidyl ester (CFSE) Cell Proliferation Kit (Molecular Probes, Invitrogen), according to the manufacturer's instructions. Cells were then cultured either in expansion medium or in RPMI-1640 supplemented with 10% FBS (basal medium), fixed with 2% paraformaldehyde at 24, 48, and 72 h, and stained for SSEA4. Images were acquired with DM IRB inverted microscope equipped with DC300F digital camera system. Alternatively, self-renewal assay was performed over a 15-day period as previously described (45). Briefly, sorted SSEA4+ cells were cultured as described above and SSEA4 expression was detected by flow cytometry on days 0, 4, 8, 12, and 15. At the same time points cell proliferation was assessed by Cell Proliferation Elisa, bromodeoxyuridine (BrdU) (colorimetric) kit (Roche) according to the manufacturer's instructions. Apoptosis was assessed by Annexin V-FITC (fluorescein isothiocyanate) Apoptosis Detection kit (BD Pharmingen) following the manufacturer's instructions. Data are representative of at least five independent experiments.
Differentiation Towards the Pancreatic Phenotype
Differentiation with protocol A was performed in nine f-LSC cultures, and each cell culture was differentiated three or more times. Protocol B was tested in parallel experiments in three out of nine f-LSC cultures used for protocol A.
Protocol A
In stage 1, cells were cultured for 2–3 days in RPMI-1640 supplemented with 100 ng/ml Activin A (Peprotech); in stage 2, cells were treated for 3–4 days with RPMI-1640 supplemented with 2% embryonic stem cell-tested FBS and 50 ng/ml bFGF; in stage 3, cells were cultured for 3–4 days with advanced DMEM supplemented with 10% embryonic stem cell-tested FBS, 1% B27 (PAA), 2% N2 (PAA), and 1 mM nicotinamide (Sigma-Aldrich); in stage 4, cells were cultured for 3–4 days in advanced DMEM supplemented with 10% embryonic stem cell-tested FBS, 1% B27, 2% N2, 1 mM nicotinamide, and 50 ng/ml exendin-4 (Sigma-Aldrich).
Protocol B
In stage 1 cells were cultured as described in protocol A; in stage 2 cells were treated for 3–4 days with RPMI-1640 supplemented with 2% embryonic stem cell-tested FBS (PAA) and with 50 ng/ml FGF10 (Sigma-Aldrich); stage 3 was carried out in advanced DMEM supplemented with 1% B27, 50 ng/ml FGF10, and 2 μM retinoic acid (RA; Sigma-Aldrich); in stage 4 cells were cultured in advanced DMEM supplemented with 1% B27 and 50 ng/ml exendin-4. All of the data represented were generated with protocol A using the same primary cell culture, except where differently indicated.
Immunofluorescence
Cells were differentiated in culture slides (BD Biosciences) and stained at different time points in order to preserve the morphology of islet-like clusters. Cells were fixed for 15 min at room temperature (RT) in 2% (w/v) paraformaldehyde, permeabilized with 0.1% PBS/Triton X-100 (Sigma-Aldrich), washed in PBS, and blocked for 30 min in 3% PBS/BSA (bovine serum albumin). Primary antibodies were incubated for 24 h at 4°C, while secondary antibodies were incubated for 1 h at RT. The sources of antibodies and dilutions used are summarized in Table S1B (supplemental material). Images were acquired with DM IRB inverted microscope equipped with DC300F digital camera system or TCS SP5 confocal microscope (all by Leica Microsystems). All fields are representative of at least five independent experiments.
Western Blot Analysis
Cells were harvested and resuspended in 200 μl of 1x ice-cold NP40 lysis buffer [50 mM Tris-HCl, pH 7.6, 150 mM NaCl, 1% NP40, 1% sodium dodecyl sulfate (SDS), 0.5% sodium deoxycholate, 2 mM NaF, 2 mM sodium orthovanadate (Na3VO4)] supplemented with a cocktail of protease inhibitors (Complete™, Roche). Proteins of human islets were obtained as previously described (31). Electrophoresis of 3 μg (for human islets) or 15 μg (for differentiated f-LSCs) lysates was performed on polyacrylamide gels [4–20% (w/v), Bis-Tris NuPage, Invitrogen]. The sources of antibodies and dilutions used are summarized in Table S1C (supplemental material). Horseradish peroxidase-conjugated secondary antibodies (Santa Cruz Biotechnology) and chemiluminescent substrate (SuperSignal West Pico, Pierce) were used for detection with a Bio-Rad Chemi-doc XRS Imager. Data are representative of at least five independent experiments.
Real-Time Quantitative PCR (qRT-PCR)
mRNA isolation and subsequent cDNA synthesis were performed using μMACS® One-step cDNA Kit (Miltenyi Biotec) according to the manufacturer's instructions. PCR primers were purchased from Qiagen (QuantiTect® Primer Assays, Qiagen) and are listed in Table S1D (supplemental material). All reactions were performed with Quantitect Sybr Green PCR Kit (Qiagen) using a LightCycler 1.5 Instrument (Roche). Reactions were performed at least in triplicate. Specificity of the amplified products was determined by melting peak analysis. Quantification for each gene of interest was performed in relation to a standard curve represented by the appropriate cDNA plasmid. Quantified values were normalized against the housekeeping gene β-actin. cDNA of human islets was obtained from adult cadaveric donors as previously described (31).
Transmission Electron Microscopy
Pellets were fixed for 20 min in 2% paraformaldehyde; postfixed for 15 min with 1% osmium tetroxide, dehydrated through graded ethanol concentrations, and embedded in epoxy resin (Durcupan ACM). Sections (80 nm thick) were cut with an Ultracut-Reichert Microtome, mounted on nickel grids, and stained with 1% uranyl acetate and lead citrate. Analysis was performed on a Zeiss EM 109 electron microscope.
Insulin Content and C-Peptide Release Assays (Static Incubation)
After discarding differentiation media, cells (both monolayer and islet-like clusters) were washed several times and then incubated for 1 h in Krebs-Ringer solution with bicarbonate and HEPES [KRBH; 129 mM NaCl, 4.8 mM KCl, 2.5 mM CaCl2, 1.2 mM KH2PO4, 1.2 mM MgSO4, 5 mM NaHCO3, 10 mM HEPES, 0.1% (w/v) BSA], followed by 1-h incubation in KRBH containing 2 mM D-glucose (basal condition). Cells were then incubated for another 1 h in stimulating conditions with 20 mM D-glucose, 100 μM tolbutamide or 30 mM KCl, respectively (all from Sigma-Aldrich). Plates were incubated at 37°C on a rotating shaker and the supernatant was sampled at basal conditions and at the time points 1, 2, 3, 5, 7, 10, 15, 30, and 60 min. C-peptide content and release were assessed with C-peptide ELISA Kit (Mercodia) on cell lysates or supernatants, respectively. Proinsulin content was measured on cell lysates with Proinsulin Elisa Kit (Mercodia). The fold increase was calculated for each culture condition by dividing the C-peptide concentration in the stimulation supernatant at 60 min by the C-peptide concentration in the basal supernatant. Total insulin content was calculated as the sum of C-peptide (pM) and proinsulin (pM) per micrograms of total proteins. We used 500,000 differentiated f-LSCs and an equal mass of islet equivalents (IEQ) (~250 islets with an estimate of 2,000 cells per IEQ) (31). Data are representative of five independent experiments.
Results
f-LSCs Express Pluripotent Markers and Exhibit Self-Renewal Ability
Limbal explants were finely dissected with a sterile blade and cells were plated in cell culture-treated flasks. After 24–48 h, a few colonies of small cuboidal (epithelial) cells and several colonies of f-LSCs were observed. At the same time, the single cell suspension gave rise to floating spherical cell clusters, which we termed “limbospheres.” Limbospheres progressively increased in number and size and after a few days attached to the plastic surface, eventually giving rise to highly proliferating fibroblast-like outgrowths. f-LSCs soon prevailed after 1 week of culture; however, to better select f-LSCs from epithelial cells, forming limbospheres were transferred in new flasks. Upon replating, limbospheres exclusively generated f-LSCs. Cell morphology and growth rate of f-LSCs are shown in Figure 1A and B; a sketch illustrating isolation of f-LSCs from limbal explants is shown in Figure S1A (supplemental material). Primary f-LSC cultures were obtained from all 14 limbal biopsies and maintained normal karyotype (46XX or 46XY) during long-term culture. Figure 1C shows a representative karyotype at P30, corresponding to ~60 population doublings.

f-LSCs express several pluripotent stem cell markers and exhibit self-renewal ability. (A) Morphology of cultured fibroblast-like stem cells (f-LSCs). After 24–48 h in culture, the single cell suspension gives rise to floating spherical cell clusters or “limbospheres”, which progressively increase in number and size and attach to the plastic surface (upper left). Colonies of small cuboidal adherent cells (epithelial) are also observed (upper right); however, f-LSCs soon prevail after 1 week of culture. Upon replating, limbospheres are able to generate only highly proliferating fibroblast-like outgrowths (lower left and lower right). Primary cultures were obtained from all 14 limbal biopsies as indicated in the Materials and Method section. See also Figure S1A (supplemental material) for graphic illustration of f-LSC isolation from limbal explants. Scale bars: 400 μm. (B) Kinetics of f-LSCs in expansion medium. Cells were counted using trypan blue exclusion dye at each passage. (C) f-LSCs maintain a normal karyotype in long-term cultures. The figure shows a representative karyotype at P30, corresponding to ~60 population doublings. (D) Fluorescence-activated cell sorting (FACS) analysis shows f-LSCs are positive for several nuclear and surface stem cell markers. Data are representative of at least five independent experiments. (E) qRT-PCR confirms expression of pluripotent stem cell markers. Each bar represents mean ± SE (log scale) of the gene of interest in all 14 primary cell cultures. Quantification for each gene of interest was performed in relation to its own standard curve (arbitrary units) and expression was normalized for the housekeeping gene β-actin.
Immunophenotype of f-LSCs was assessed by flow cytometry (Fig. 1D). Freshly digested limbal specimens (which included also epithelial cells) showed significant expression of the pluripotent stem cell marker SSEA4 (mean ± SD: 65.2 ± 7.6%; data not shown), which had been previously proposed as a reliable marker for f-LSCs (11). After 10–12 population doublings in stem cell expansion medium, or at earlier passages in primary cultures obtained by subculturing limbospheres, the highly proliferating f-LSCs showed increased positivity for SSEA4 (90.8 ± 7.6%). SSEA4+ f-LSCs coexpressed the stem cell markers octamer binding transcription factor [OCT4; double positive (DP): 92.7 ± 4.3%], sex determining region Y box 2 (SOX2; DP: 91.9 ± 5.6%), NANOG (DP: 98.6 ± 1.3%), c-KIT (DP: 93.6 ± 3.3%), TRA 1–60 (DP: 95.3 ± 4.1%), TRA 1–81 (DP: 95.0 ± 3.1%), THY-1 (DP: 94.5 ± 3.6%), CD105 (DP: 88.3 ± 2.3%), and the limbal marker ATP-binding cassette subfamily G member 2 (ABCG2; DP: 94.9 ± 4.8%) (4,9). CD133 was weakly expressed or absent (DP: 5.2 ± 2.9% only in 4 out of 14 primary cultures; data not shown). f-LSCS were also negative for CD34, CD45, human lymphocyte antigen (HLA)-DR, and the LESC marker ΔNp63 (Fig. 1D) (10). To exclude that the absence of these markers in f-LSCs was due to experimental artifacts, freshly isolated PBMCs and HeLa cells were used as positive controls (data not shown). The expression of all stem cell markers was unaffected by long-term culture and was assessed up to 92 population doublings (data not shown). The “stem-like” profile of f-LSCs was confirmed by qRT-PCR (Fig. 1E), which also showed expression of Kruppel-like factor 4 (KLF-4), c-MYC, and CD73. Table S2 (supplemental material) summarizes the markers that identify f-LSCs.
f-LSCs were also evaluated for the ability to divide asymmetrically, a key stem cell feature (Fig. 2). Prior to assay, cells were sorted for SSEA4 to ensure a purified SSEA4+ f-LSC population (Fig. 2A). Cells were then labeled with fluorescent dye CFSE in order to track cell division (Fig. 2B). Cells were either cultured in expansion medium (supporting maintenance of the pluripotent phenotype) or in a basal medium (and thus allowing asymmetric division). Immunofluorescence analysis performed at 24, 48, and 72 h in basal medium showed increasing number of CFSE+/SSEA4- cells, while several mitotic cells showed polarized SSEA4 distribution (Fig. 2C and D, arrows). In addition, flow cytometry analysis after 72 h showed that the number of SSEA4+ cells remained unchanged while the total cell population increased, thus suggesting asymmetric division. By contrast, at 72 h cells cultured in expansion medium maintained SSEA4 expression as their number progressively increased, indicating cells divided symmetrically during proliferation (data not shown). Asymmetrical division of SSEA4+ cells was further evaluated indirectly over a 15-day period by culturing f-LSCs in the same conditions described above (Fig. 2E). SSEA4 expression detected by flow cytometry gradually decreased from 98% on day 0 (after sorting) to 58% on day 8, and maintained a steady state up to the last day of the assay. Instead, cell proliferation (detected by BrdU) was observed during the entire culture period. Assessment of apoptosis by Annexin V-FITC at the same time points demonstrated that the decrease in SSEA4 expression overtime was not caused by cell death (<2.7%, data not shown).
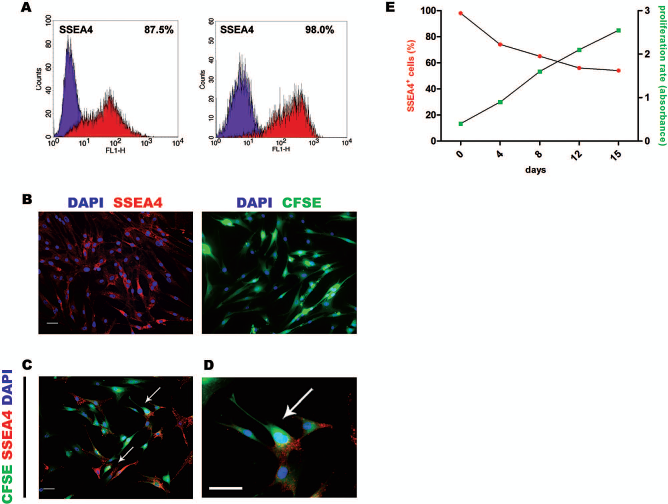
Self-renewal ability of f-LSCs. (A) f-LSCs were sorted for stage-specific embryonic antigen 4 (SSEA4) prior to assay, in order to ensure a purified population. Left: before sorting; right: after sorting. Purple peak: negative control. Red peak: SSEA4. (B) SSEA4+ cells (red) were then labeled with fluorescent dye carboxyfluorescein succinimidyl ester (CFSE; green) in order to track cell division. The dye-protein adducts that form in labeled cells were retained by daughter cells after either cell division or cell fusion, and CFSE was not transferred to adjacent cells. Note that all cells were positive for SSEA4 and CFSE after sorting. (C) Cells were cultured in a basic medium not containing basic fibroblast growth factor (bFGF). Immunofluorescence analyses performed at 24, 48, and 72 h show increasing number of CFSE+/SSEA4- cells, suggesting they divided asymmetrically. Arrows indicate polarized SSEA4 expression in premitotic or mitotic cells. Scale bar: 100 μm. (D) Higher magnification of (C). Scale bar: 100 μm. (E) Asymmetrical division of SSEA4+ cells evaluated indirectly over a 15-day period. SSEA4 expression detected by flow cytometry decreased from 98% on day 0 (after sorting) to 58% on day 8, and maintained a steady state up to the last day of the assay. Instead, cell proliferation detected by bromodeoxyuridine (BrdU) continued for the entire culture period, thus suggesting that SSEA4+ cells divide asymmetrically. Data are representative of five independent experiments.
Directed Differentiation of f-LSCs Cells Towards the Pancreatic Endocrine Phenotype
We developed a four-step protocol for differentiation of f-LSCs into pancreatic endocrine cells through a series of intermediates mimicking in vivo pancreatic organogenesis. Stepwise, we added factors and supplements known to direct/support pancreatic differentiation of embryonic stem cells, such as activin A, bFGF, B27, N2, nicotinamide, and exendin-4 (protocol A, Fig. 3A) (6,20,24,34). The substitution or addition of other molecules, such as FGF10 and retinoic acid (RA), was also investigated based on previous evidence reporting improvement in endoderm formation and increase in insulin content of ESC-derived surrogate β-cells (protocol B, Fig. 3B) (7,21).

(A, B) Four-step protocols for differentiation of f-LSCs into pancreatic hormone-expressing cells. Media, growth factors, supplements, and range of duration for each stage are indicated. (A) Protocol A. (B) Protocol B. Stage 1 is the same in the two protocols, and leads to formation of definitive endoderm, which is a crucial step for the subsequent differentiation towards the pancreatic phenotype. DE, definitive endoderm; PF, posterior foregut; PE, pancreatic endoderm; ISL, hormone-expressing islet cells. (C) Expression of pancreatic/β-cell markers during differentiation. f-LSCs express pancreatic, islet, and β-cell markers in temporal succession, according to stages of differentiation. From stage 2 black bars indicate protocol A, gray bars indicate protocol B, and striped bars indicate expression in ~500 handpicked human islets. Bars represent gene expression at the end of each stage. Quantification for each gene of interest is performed in relation to a standard curve (arbitrary units) and gene expression is normalized for the housekeeping gene β-actin. Values are shown as mean ± SE of nine experiments for protocol A and three experiments for protocol B. See also Figure S1B (supplemental material) for decrease of stem cell markers during differentiation.
At stage 1 and 2 (days 1–7), we focused on generating definitive endoderm (DE) and posterior foregut (PF). During stage 1 we used high concentrations of activin A in serum-free media, while in stage 2 activin A was removed, and either bFGF (protocol A) or FGF10 (protocol B) was added in the context of low FBS supplementation. Soon upon activin A removal, a consistent percentage of f-LSCs transitioned to DE as indicated by the remarkable upregulation of SOX17 and Forkhead Box-A2 (FOXA2) mRNAs (Fig. 3C) and the subsequent protein detection by immunofluorescence (Fig. 4A, B). Of note, differentiating cells progressively aggregated into spherical cell clusters resembling human islets. At the beginning of stage 2 we also observed significant upregulation of pancreatic and duodenal homeobox 1 (PDX1), which is indicative of PF formation (Fig. 3C) (26). PDX1+ cells could be detected in both the forming islet-like clusters and in the surrounding monolayer (89.3 ± 4.1% at the end of stage 2). PDX1+ cells coexpressed NK6 homeobox 1 (NKX6.1), which is characteristic of pancreatic epithelium (Fig. 4C) (26). Neurogenin 3 (NGN3) expression, as expected, was transient and peaked at the end of stage 2, along with the increase of ISL LIM homeobox 1 (ISL1), paired box gene 4 (PAX4), NKX6.1, and neurogenic differentiation 1 (NEUROD1), all transcription factors controlling endocrine cell differentiation (Fig. 3C) (15,16). Indeed, low levels of these pancreatic genes were already detected at the end of stage 1, thus suggesting that a high dose of activin A alone was able to initiate transcription of DE and PF markers. Nevertheless, if activin A was not removed and either bFGF or FGF10 was added, generation of hormone-producing cells in the subsequent stages did not take place or was significantly reduced (data not shown). By the end of stage 2, NGN3 showed a nuclear localization in a substantial number of PDX1+ cells, consistent with endocrine determination (Fig. 4D). At the end of stage 2, we also noted upregulation of glucose transporter 2 (GLUT2) and glucokinase (GCK), along with the appearance of insulin (INS), glucagon (GCG), somatostatin (SST), pancreatic polypeptide (PPY), and ghrelin (GHRL) transcripts (Fig. 3C). However, no hormone-producing cells were found by immunofluorescence at this stage (Fig. 4E). In addition, by day 8 the expression of stem cell markers was already negligible (supplemental information in Fig. 1).

(A–C) Immunofluorescence analysis of transition from definite endoderm (DE), to posterior foregut (PF) and pancreatic epithelium. Soon upon activin A removal, f-LSCs transition to DE as indicated by the staining for sex determining region Y box 17 (SOX17) (A) and forkhead box A2 (FOXA2) (B). Notably, at this stage pancreatic and duodenal homeobox 1 (PDX1) staining was already detectable in the islet-like clusters but not in the monolayer. (C) At day 4 PDX1+ cells coexpressed NK6 homeobox 1 (NKX6.1), which is characteristic of pancreatic epithelium. PDX1 could be detected in both the forming islet-like clusters and in the surrounding monolayer, suggesting cells transitioned to PF (PDX1+ cells: 89.3 ± 4.1%). (D–G) Immunofluorescence analysis of transition from pancreatic endoderm (PE) to hormone-expressing cells. (D) By day 7 PDX1 colocalizes with neurogenin 3 (NGN3), consistently with endocrine determination. (E) No hormone-producing cells were found by immunofluorescence at this stage. (F) Differentiating cells express proinsulin (C-PEP/PROINS) at day 12. Arrows indicate polarized or perinuclear distribution, as in immature hormone-positive cells. (G) In later-stage cells the hormone filled and delineated the cytoplasm, consistently with a more mature phenotype. Scale bars: 200 μ (A–C), 100 μm (D–G). All fields are representative of at least five independent experiments.
At stage 3 (days 8–12), bFGF was removed and B27, N2, and nicotinamide were added to further improve the yield and maturation of pancreatic endocrine precursors (protocol A). Alternatively, FGF10 was maintained for 3–4 more days, in the presence of B27 and RA (protocol B). At the end of this stage, by about 12 days of differentiation, we observed consistent upregulation of INS and v-maf musculoaponeurotic fibrosarcoma oncogene homolog A (avian) (MAFA) mRNAs. Transcripts for GCG, SST, GHRL, and PPY were also detectable (Fig. 3C). Differentiating cells showed a perinuclear or polarized localization of proinsulin (C-PEP/PROINS), consistent with immature phenotype (Fig. 4F). By contrast, in later-stage cells the hormone filled and delineated the cytoplasm (Fig. 4G). The absence of NGN3 staining at this stage (data not shown), along with the very low levels of NGN3 mRNA, indicated that the majority of cells already underwent endocrine determination.
At stage 4 (days 13–15), the islet-like clusters increased in number and size (Fig. 5A). In addition, cells double stained for C-PEP/PROINS and INS, suggesting further maturation. Interestingly, in bigger islet-like clusters staining for proinsulin was more marked in the cells of the inner core, while outer cells stained strongly for mature insulin (Fig. 5B; video S1 in supplemental material). GLUT2, which is part of the “glucose sensor” along with GCK, showed a similar localization (Fig. 5C). By contrast, smaller islet-like cluster had a more homogeneous C-PEP/PROINS and INS distribution (Fig. 5D, E; video S2 in supplemental material). In some islet-like clusters a few cells of the inner core also expressed GCG (Fig. 5E). Rare single SST+ and GCG+ cells were randomly found in the monolayer (Fig. 5F, G). A confocal image of an islet-like cluster is shown in Figure 6A. At this stage, almost all C-PEP/PROINS+ cells also expressed MAFA and PDX1 (Fig. 6B). Western blot analysis expression confirmed protein expression of GLUT2, PDX1, and GCK (Fig. 6C).

Differentiation into fully competent hormone-producing cells. (A) Morphological appearance of end-stage islet-like clusters. (B) Double staining for C-PEP/PROINS and INS (insulin) indicates that the hormone was efficiently processed. In these bigger islet-like clusters C-PEP/PROINS is preferentially located in the inner core, while outer cells stain strongly for mature INS. The increase of the aggregates size may hinder or impair uniform exposure of inner cells to medium and factors. (C) The glucose transporter GLUT2 shows a pattern similar to INS staining. (D) PDX1 was expressed in both the monolayer and the islet-like clusters, where it colocalized with C-PEP/PROINS. (E) An islet-like structure with a few cells of the inner core staining for glucagon (GCG). Note that small islet-like cluster shown in (D) and (E) display homogeneous hormone distribution. (F) Rare single GCG+ and somatostatin (SST+) (G) cells were randomly found in the monolayer. (H) Phase contrast micrograph of a 2D aggregate of cells. Scale bars: 200 μm (A–E), 100 μm (F–H). All fields are representative of at least five independent experiments.
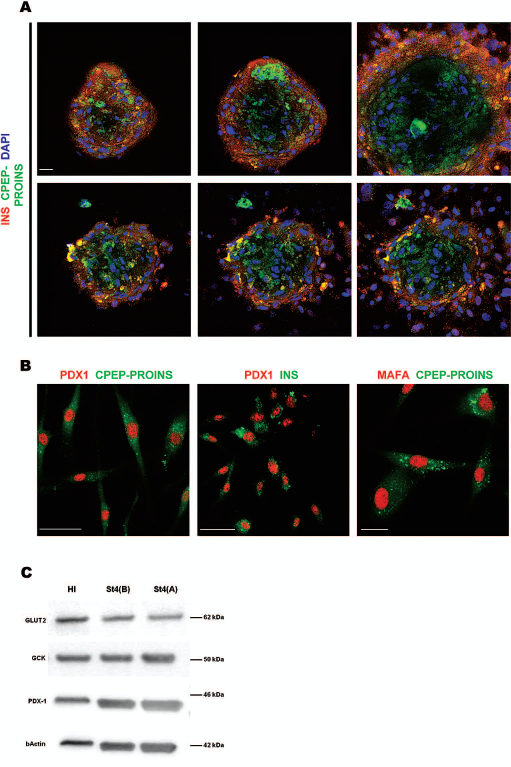
Additional characterization of differentiated f-LSCs. (A) three micrographs taken from Z-stacks of an islet-like cluster stained for C-PEP/PROINS and INS. See also supplemental online video 1 and video 2 for 3D reconstruction of islet-like clusters. Scale bar: 20 μm. (B) At stage 4 almost all C-PEP/PROINS+ or INS+ cells coexpress v-maf musculoaponeurotic fibrosarcoma oncogene homolog A (avian) (MAFA) and PDX1 (confocal micrographs). C-PEP and INS stainings show a granulated pattern, consistent with presence of secretory granules. Scale bars: 50 μ (left and middle micrographs), 25 μm (right micrograph). (C) Western blot analysis for islet markers GLUT2, glucokinase (GCK), and PDX1 at stage 4 (St4). St4(A) indicates differentiation with protocol A and St4(B) indicates protocol B. Protein lysates (3 or 15 μg) were loaded for human islets (HI) and differentiated f-LSCs, respectively.
No substantial differences were observed between protocol A and protocol B in inducing the expression of the majority of islet and β-cell-specific transcription factors. However, concerning hormone production, protocol A was more efficient in inducing formation of islet-like clusters. Minor differences were observed in the differentiation outcome among the primary cell cultures used.
Quantification of Differentiated f-LSCs
To quantify hormone-expressing cells, we performed flow cytometry after completing differentiation at stage 4 (Fig. 7A). Analysis showed an average of 72.1 ± 5.3% positive cells for C-PEP/PROINS, with higher rates obtained with protocol A. GCG+ and SST+ cells were 10.6 ± 2.4% and 8.2 ± 2.6%, respectively. qRT-PCR analysis showed higher INS expression in the islet-like clusters in comparison to monolayer cells (data not shown).

Quantification and functional assessment of differentiated f-LSCs at the end of stage 4. (A) Flow cytometry shows up to 77% cells expressing C-PEP/PROINS. GCG and SST coexpressed C-PEP/PROINS, and at a much lower levels. (B) Left: confocal micrograph of one INS+ cell costaining with synaptophysin (SYP), indicating the hormone is stored in granules. Right: Flow cytometry shows that ~70% of cells coexpress SYP and INS. (C) Transmission electron microscopy shows presence of secretory granules. Inset shows a granule with a clear halo surrounding a less dense core, a morphology that is characteristic of insulin-containing vesicles. Scale bar: 1 μm. (D) Stimulation with 20 mM glucose (GLUC), 100 μM of the secretagogue tolbutamide (TOL), or direct depolarization with 30 mM potassium chloride (KCl) during 2-h static incubation of both monolayer and islet-like clusters. All of the three stimuli show rapid kinetics with a peak of secretion within 5 min. A biphasic profile can be observed after glucose stimulation with a second phase around 10 min from the beginning of incubation. Basal secretion is C-peptide release during 1-h incubation in KRBH containing 2 mM D-glucose. (E) Fold stimulation of C-peptide release over the respective basal condition during 1-h static incubation. Values were calculated for each culture condition by dividing the C-peptide concentration in the stimulation supernatant at 60 min by the C-peptide concentration in the basal supernatant. (F) C-peptide secretion after 1-h static incubation compared to isolated adult human islets. (G) Total insulin content (sum of C-peptide + proinsulin) in differentiated f-LSCs and isolated adult human islets/μg total protein. Total insulin content in differentiated f-LSCs is about 160-fold lower than in adult human islets. However, the average proportion of total insulin content attributable to C-peptide in differentiated f-LSCs is ~98%, comparable to that of human islets. Equal amounts of differentiated f-LSCs and of islet equivalents (IEQ) used for the experiments shown in (A–G). (H) Morphology of an islet-like cluster after 1-h static stimulation with 20 mM glucose. (D, E) Data represent mean ± SE of five experiments.
Differentiated f-LSCs Possess Secretory Granules
To confirm the degree of maturation of hormone-expressing cells, we investigated whether they formed secretory granules. Confocal microscopy of C-PEP- and INS-stained cells showed a granulated pattern of the cytoplasm, consistent with the existence of secretory granules (Fig. 6B) (6). Several INS+ cells coexpressed the vesicle protein synaptophysin (SYP), and flow cytometry analysis indicated an average percentage of coexpression of 69.0 ± 3.9% (Fig. 7B). Electron microscopy also revealed secretory granules in the cytoplasm and next to the cell membrane. Some of them showed a clear halo surrounding a less dense core, a morphology that is characteristic of insulin-containing vesicles (Fig. 7C).
Insulin Content and Insulin Release From Differentiated f-LSCs
To confirm de novo synthesis and release of insulin, we investigated the ability to secrete C-peptide in response to secretory stimuli (Fig. 7D) (29). Stimulation with 20 mM glucose, 100 μM of the secretagogue tolbutamide, or direct depolarization with 30 mM potassium chloride (KCl) resulted in a robust C-peptide secretion in the culture medium during 2-h static incubation. All three stimuli showed rapid kinetics with a peak of secretion within 5 min. A biphasic profile was observed after glucose stimulation with a second phase of secretion around 10 min from the beginning of incubation. Fold stimulation of C-peptide release over the respective basal condition during 1-h static incubation resulted in 4- to 6-fold increase after glucose stimulation, 5- to 11-fold increase after tolbutamide, and 8- to 12-fold after KCl (Fig. 7E). C-peptide secretion after 1-h static incubation was 15- to 28-fold less than that observed for adult human islets incubated in the same conditions (Fig. 7F). To accurately evaluate the ability to process insulin, we measured both C-peptide and proinsulin by ELISA on cell lysates. Total insulin content in differentiated f-LSCs was about 160-fold lower than in adult human islets. However, the average proportion of total insulin content attributable to C-peptide in differentiated f-LSCs was comparable to that of human islets (~98%; range 97–99.5%) (Fig. 7G). Morphology of an islet-like cluster after 1-h static incubation with 20 mM glucose is shown in Figure 7H.
Discussion
Cultured human limbal epithelial stem cells have been successfully used for corneal reconstruction. However, human ocular stem cell research has been mainly focused on the tissue-specific differentiation that may be of clinical significance in the context of eye diseases. Here we show how the limbus hosts a fibroblast-like stem cell population that could be harvested for clinical use in type 1 diabetes. The phenotypic characterization of f-LSCs has been variably described (11,12,28). We have identified a core set of attributes that uniquely characterizes f-LSCs, such as the expression of the well-established stem cell surface antigens SSEA4, TRA 1–60, TRA 1–81, THY1, c-KIT, CD105, CD73, and the limbal stem cell marker ABCG2. f-LSCs also expressed several nuclear transcription factors, such as OCT4, NANOG, SOX2, KLF-4, and c-MYC, which are involved in self-renewal and maintenance of pluripotency of both embryonic and adult stem cells (40,44). The LESC marker ANp63 was negative, confirming the nonepithelial nature of f-LSCs, while the absence of CD34 and CD45 argues against a hematopoietic origin. f-LSCs did not express HLA-DR histocompatibility molecules on their surface. This feature could be advantageous in the transplantation setting as it might confer reduced immunogenicity. In addition, the ability to maintain an undifferentiated status and normal karyotype during long-term in vitro culture is another critical advantage because expansion of the stem cell pool before differentiation is required to eventually obtain a large number of transplantable surrogate β-cells. We also found that cultured f-LSCs are able to form nonadherent spherical clusters, or limbospheres. The generation of spheres was first observed for progenitors/stem cells belonging to the central nervous system and neural crest-derived tissue (30), and culture conditions developed for their formation are known to enrich stem-like cells with self-renewal ability and differentiation potential. The self-renewal assays provided the proof of principle of the stem properties of f-LSCs.
Differentiation of f-LSCs into a surrogate β-cell type was achieved using factors and supplements, which have been described to direct and/or sustain differentiation of other stem cells towards the pancreatic phenotype (6,7,20,21,24,34). Different concentrations, times of administration, and lengths of application were tested in order to find the optimal conditions to induce β-cell differentiation through progressive stages of commitment that mimics normal pancreatic development. The expression of specific endodermal, pancreatic, islet, and β-cell markers, as well as functional properties of f-LSC-derived insulin-producing cells, were assessed during differentiation.
With our four-step approach, we first focused on obtaining DE and PF (stages 1–2). The serum-free conditions, combined with the addition of activin A and its subsequent removal, were critical in blocking f-LSC self-renewal and in inducing mesendoderm differentiation (5–7). Remarkably, cells started gathering in islet-like clusters, which progressively increased in size during differentiation. At stage 1, transition to DE was demonstrated by the appearance of SOX17 (32,36) and FOXA2 (23). Of note, both transcription factors were persistently expressed up to stage 4, albeit at lower levels. This finding is obvious for FOXA2, being also a well-recognized pancreatic and β-cell nuclear transcription factor. SOX17 is expressed during human fetal pancreas development, when its transcription is significantly higher than in adult human islets (36). The persistence of SOX17 mRNA expression thus may be explained by the arrest of a certain number of cells at DE/PF stages or may mirror its physiological postnatal expression. Notably, at stage 1 PDX1 staining was already detectable. PDX1 is a master regulator of pancreas development and specification. During embryogenesis, PDX1 marks the prepancreatic endoderm before it has visibly thickened (26). Experiments of lineage tracing showed that at this stage PDX1+ cells represent progenitors of all the mature pancreatic cell types, including duct, islet, and acinar cells (16). PDX1 is subsequently silenced to eventually appear in the mature β-cell as a regulator of insulin gene transcription. The expression of PDX1 mRNA we observed during differentiation seems to mirror this biphasic pattern.
At stage 2, we further induced transition towards posterior foregut and pancreatic endoderm. A considerable upregulation of PDX1 at both mRNA and protein levels was observed, therefore confirming that the majority of f-LSCs (both in the monolayer and in the forming clusters) differentiated into pancreatic precursors. In particular, many PDX1+ cells also coexpressed NKX6.1, which suggests transition towards the pancreatic epithelium. Simultaneously, NGN3 became also detectable, indicating initial commitment to the endocrine lineage. NGN3 is transiently expressed during endocrine specification and is responsible of the induction of a battery of transcription factors that constitute a “core program” of endocrine development (15). They include ISL1, NEUROD1, NKX6.1, and PAX4 genes, which are also known to act relatively late in β-cell specification (26). These factors were indeed detected already at the end of stage 2.
At the end of stage 2, we also observed upregulation of GLUT2 and GCK, two genes that play a crucial role in maintaining blood glucose homeostasis, forming the so-called “β-cell glucose sensor” (19). The early upregulation of GLUT2, in absence of insulin detection, recalls the embryonic development phases when GLUT2 is expressed temporarily in pancreatic non-β-cells, likely acting as a signal for further development (18). The same finding has been described in GCG+ cells during attempt of regeneration in STZ-diabetic nonhuman primates (3).
During stage 3, maturation of pancreatic progenitors into hormone-producing cells and in particular β-cells, was allowed. Consistent with this observation, we observed remarkable upregulation of MAFA. This finding is extremely indicative, as no other characterized islet-enriched transcriptional factor is expressed exclusively in β-cells, where it functions as a potent activator of insulin gene transcription together with PDX1 and NEUROD1 (25,42). NGN3 mRNA and protein were undetectable in stage 3, suggesting that its expression is extinguished before the final differentiation of the hormone-producing cells. At this early stage of hormone maturation, however, C-peptide did not fill the cytoplasm, being stored in the apical pole of the cells.
Differentiation into fully competent hormone-producing cells was completed by the end of stage 4, when the GLP-1 analog exendin-4 was added. Exendin-4 has been shown to increase β-cell replication, neogenesis, and expansion of the β-cell mass both in vitro and in vivo (37–39,43). At this stage C-PEP/PROINS and INS colocalized in immunofluorescence, indicating acquisition of a more mature phenotype. Indeed, the efficient conversion of proinsulin to insulin requires cleavages at both junctions of the connecting segment linking the B and A chains to release insulin and C-peptide. These products normally are stored within the mature secretory granules. As the C-PEP/PROINS antibody used reacts specifically with C-peptide and does not cross-react with insulin or other peptide hormones, the double staining for both C-peptide and insulin demonstrates that the hormone was efficiently processed. In addition, sustained protein synthesis was suggested by the observation that the hormone extensively filled and delineated the cytoplasm. At this stage the islet-like clusters increased consistently in number and size. Notably, in bigger islet-like clusters C-PEP/PROINS was more marked in the cells of the inner core, while INS and GLUT2 staining was stronger in outer cells. By contrast, smaller islet-like clusters showed a homogeneous insulin distribution. We thus believe that the increased size of the aggregates may hinder or impair uniform exposure of inner cells to medium and factors, leading to accumulation of proinsulin due to decreased cleavage of the prohormone. The granulated pattern observed by confocal microscopy suggested granules were docked in the cytoplasm of hormone-producing cells. In addition, INS/SYP co-staining suggested the hormone was incorporated, at least transiently, in secretory granules. This was also confirmed by electron microscopy, which revealed granules in the cytoplasm and next to the cell membrane. Co-staining of C-PEP with INS, MAFA, PDX1, and GLUT2 at day 15 confirmed maturation of cells.
Assessment by flow cytometry at the end of differentiation showed that ~70% of the cells (and as many as 77%) eventually differentiated into cells expressing insulin (assessed as C-peptide). These differentiation rates are about 10-fold higher than earlier in vitro studies (7,21). However, insulin gene transcription was about 20-fold lower compared to isolated human islets, suggesting that hormone production per cell is lower than in adult human β-cells. This observation is further supported by the finding that insulin content/μg total protein was about 160-fold lower than what observed in adult islets. Interestingly, differentiated cells processed ~98% of their proinsulin content, which is comparable to what is observed in mature β-cells. In addition, analysis of the secretory function in response to glucose, tolbutamide, and KCl confirmed that differentiated f-LSCs are able to respond to different stimuli in a regulated manner by secreting mature insulin (assessed by C-peptide production). The observed biphasic kinetics of stimulated C-peptide secretion suggests that f-LSC-derived INS+ cells possess two different pools of granules. In particular, the rapid kinetics of the first phase (peaking within 5 min in all conditions) indicates the existence of preformed vesicles that are promptly secreted, while the sustained secretion in the second phase suggests presence of a slowly releasable pool. Notably, this biphasic time course can be observed in perifused islets (17). By contrast, the rapid increase observed after incubation with KCl and tolbutamide was probably due to the continuous and strong membrane depolarization induced by these two stimuli. These findings collectively suggest that insulin-positive cells have developed the secretory machinery that is typical of β-cells. Flow cytometry also showed that a few insulin-positive cells coexpressed glucagon (~10%) and somatostatin (~8%), a feature of newly forming endocrine cells. Indeed, few insulin-positive islet-like clusters showed glucagon staining in the inner core. Polyhormonal cells have been described in both rodents and humans during the primary transition stage of early fetal development (27,41). Thus, hormone coexpression in a subpopulation of our cells may indicate the persistence of immature cells. Alternatively, polyhormonal cells may result from partial failure of our differentiation protocol to maintain the appropriate transcription factor code.
In conclusion, we demonstrate that f-LSCs are capable of differentiating in vitro into functional insulin-secreting cells. f-LSCs offer remarkable advantages over the countless stem cell sources proposed so far for β-cell replacement therapy. Limbal cells are easily accessible with a well-established and minimally invasive procedure and are scarcely immunogenic, as they do not express HLA-DR histocompatibility molecules on their surface. This feature is potentially valuable in the transplantation setting as it might confer reduced immunogenicity. Finally, the ability to maintain an undifferentiated status and normal karyotype during long-term culture in vitro is another key feature, as expansion of the stem cell pool before differentiation is required to eventually obtain a large number of transplantable surrogate β-cells. Future studies are needed to refine the pancreatic differentiation protocols in order to improve the amount of functional mature surrogate β-cells. In addition, it should be determined whether potentiation of insulin secretory function is induced in vivo, and ultimately assess the therapeutic potential of f-LSC-derived β-cells after transplantation for the reversal of diabetes.
Footnotes
Acknowledgments
We thank Sandra Pasqua Sisto for preliminary experiments; Maria Piccione and Salvina Lauricella for karyotype analysis; Riccardo Di Fiore, Valeria Militello, and Valeria Vetri for excellent technical assistance with fluorescence and confocal microscopy; Carla Palumbo for TEM analysis; Ole Madsen and Mattias Hansson for their thoughtful comments; and finally Alberto Pugliese for a critical review of the data and manuscript. No external grant funding sources supported this study. Mouse anti-Nkx6.1 and mouse anti-Ngn3 were gifts from Ole Madsen. Human islets were provided by Piero Marchetti, Pisa, Italy. They had no role in study design, data collection and analysis, decision to publish, or preparation of the manuscript. Patent application No. FI2009A000275 (pending; valid only in the Italian territory), deposited by the University of Palermo on behalf of Angela Criscimanna, Giovanni Zito, Aldo Galluzzo, and Carla Giordano. Patent covers the methodology for pancreatic differentiation of fibroblast-like limbal stem cells and their use in the treatment of diabetes. Patent application does not alter our adherence to Cell Transplantation's policies on sharing data and materials. Supplementary material cited in the manuscript is available at https://sites.google.com/site/endocrinologycgiordano/cell-transplantation-journal_supplemental-material