
Abstract
Endothelial cells can be successfully used to maintain or increase the number of hematopoietic stem cells in vitro. Previously we identified hematopoietic progenitor cell (HPC) expansion or survival benefit induced by IL-1β-, IL-3-, and IL-6-stimulated human umbilical vein endothelial cell (HUVEC) supernatants. In order to identify molecular mechanisms that support hematopoiesis, we examined the time-dependent expression profiles of IL-1β-, IL-3-, and IL-6-stimulated HUVECs via microarray. Here, we present 24 common upregulated elements and three common downregulated elements of IL-1β- and IL-3-stimulated HUVECs, with these factors exhibiting great potential for the observed HPC expansion. Furthermore, metabolic pathway analysis resulted in the identification of nonproteinogenic factors such as prostaglandin E2 (PGE2) and nitric oxide (NO) and determined their HPC expansion potential via delta, methylcellulose, and cobblestone assays. We confirmed PGE2 and spermine as hematopoietic expansion factors. Furthermore, we identified several factors such as SSAT, extracellular matrix components, microRNA21, and a microvesicle-mediated cross-talk between the endothelium and HPCs that may play a crucial role in determining stem cell fate. Our results suggest that microarray in combination with functional annotations is a convenient method to identify novel factors with great impact on HPC proliferation and differentiation.
Keywords
Introduction
Hematopoiesis is defined as a process in which pluripotent hematopoietic progenitor cells (HPCs) proliferate and differentiate into lineage-committed progenitor cells. These progenitors subsequently undergo further multiplication prior to their terminal differentiation into mature blood cells, followed by their release from the bone marrow (BM) into the peripheral blood. Cultivation and expansion of HPCs have been proposed as measures to increase the engraftment potential of hematopoietic grafts with insufficient stem cell numbers (63). In addition, culture methods need to be developed for gene transfer experiments in vitro that are not associated with a stem cell loss (62). The process of differentiation is stringently regulated and occurs in close contact in vivo with the microenvironment (85). These complex communication networks have been, until now, poorly understood.
In the hematopoietic microenvironment, endothelial cells (ECs) play an important role in the regulation of hematopoietic cell proliferation and trafficking (53,54). Secretion of hematopoietic factors by ECs and direct cellular contact, which permits the interaction of adhesion molecules and surface-bound cytokines or chemokines with their corresponding receptors, may contribute to the maintenance of progenitor and stem cells. We and others have demonstrated that ECs can be successfully used to maintain or increase the number of primitive HPCs in vitro (11,55). Coculture of HPCs with ECs may provide conditions that are superior to cytokine-supplemented liquid culture. Endothelial cells have been particularly identified to produce numerous cytokines that are known to play an important role in the proliferation and differentiation of hematopoietic progenitors (5,6,12,14,23,40,42,64,74,76,92). These include human granulocyte colony-stimulating factor (G-GSF), interleukin-1 (IL-1), IL-3, IL-6, IL-11, leukemia inhibitory factor (LIF), stem cell factor (SCF), and basic fibroblast growth factors (bFGF) (9,10,16,20,31,32,44,45,59,80,83,91). We have previously demonstrated that ECs stimulated with tumor necrosis factor-α (TNF-α) induce the generation of dendritic cells from CD34+ stem cells, whereas, in contrast, interleukins were capable of inducing the proliferation of hematopoietic and myeloid progenitors (55,56).
Expression profiling by microarray technology has aided in the identification of previously unknown signaling pathways of endothelial immune cascades, specifying the role of inflammatory stimuli in neutrophil transmigration, assessing vascular immune reactions as well as in recognizing the effect of biochemical forces or risk factors associated with atherosclerosis (8,21,69,77,84,89). Thus, to detect molecules involved in HPC expansion, differential expression profiling between supportive and nonsupportive conditions appears to present the most attractive approach for a systematic, unbiased, and comprehensive screening (24,25,37,38,67).
In this study, the hematopoietic support of IL-1β-, IL-3-, and IL-6-stimulated human umbilical vein endothelial cells (HUVECs) was investigated by oligonucleotide microarray analysis, in order to identify novel hematopoietic stem cell expansion factors. Metabolic pathway analysis revealed the identification of nonproteinogenic factors whereas their benefit to HPC expansion was further evaluated via delta, methylcellulose, and cobblestone assays. The gene expression profiles of HUVECs stimulated with proinflammatory cytokines allows a view inside the complexity of the cross-talk occurring between ECs and HPCs. Further potential HPC expansion factors are also deduced and postulated here.
Materials and Methods
Cord Blood, HPC Isolation
Cord blood specimens were collected in heparin-coated syringes from full-term delivered neonates, following written consent from the mothers. Mononuclear cell fractions were isolated by gradient centrifugation. CD34+ HPCs were immune magnetically separated as previously described (57).
Isolation and Culture of Endothelial Cells
HUVECs were obtained from freshly collected umbilical cords by flushing umbilical veins with 0.1% collagenase (Sigma-Aldrich, Germany) as previously described (56). Cells were cultured in Earl's M199 medium (Biochrom, Berlin, Germany) supplemented with 16% fetal bovine serum (FBS, Hyclone, South Logan, UT, USA), 4% human serum from healthy volunteers, 2 mM L-glutamine, 0.15 mg/ml endothelial growth factor supplement (Intracel, Rockville, MD, USA), 0.015 mg/ml heparin, and 1% fungicide.
Stimulation of HUVECs and RNA Isolation
Confluent monolayer ECs from the third passage were stimulated with 100 U/ml IL-1β, IL-3, IL-6, or bovine serum albumin (BSA) control (10 μl of 0.1% BSA in 10 ml medium). The BSA served as an additional control, because all interleukins were dissolved in PBS with 0.1% BSA. Medium-only controls were also performed at 0 and 16 h. Following stimulation of HUVECs with the various interleukins, cells were harvested by collagenase treatment (0.1% in PBS). Total RNA was isolated from stimulated cells obtained at the various time points via a Qiagen RNeasy Mini Kit in accordance with the manufacturer's instructions (Qiagen, Hilden, Germany). In order to minimize the biological variability on the global gene expression profiling of ECs, we processed seven different umbilical cords. We further isolated 126 samples for total RNA, and pooled them into 18 groups corresponding to each stimulant, control, and time point. Due to the pooling, seven different umbilical cords are represented within one chip experiment. Each RNA sample and pool was assessed for both quantity and integrity, via a NanoDrop ND-1000 spectrophotometer (NanoDrop Technologies, Wilmington, DE, USA) and an Agilent 2100 Bioanalyzer (Agilent, Waldbronn, Germany).
Microarray Sample Preparation
The pooled total RNA for each condition was further used for microarray analysis in genome-wide HG-U133 plus 2.0 microarrays (Affymetrix, Santa Clara, CA, USA) in accordance with the manufacturer's recommendations. Briefly, 2 μg total RNA was used to synthesize biotin-labeled cRNA. Fragmented cRNA (10 μg) was hybridized to gene chips for 16 h at 45°C. Following washing and staining, gene chips were scanned with the GeneArray scanner controlled by the Affymetrix GCOS 1.4 software. Raw data were processed and normalized by applying the GCOS 1.4 software according to Affymetrix recommendations and by the MAS5.0 normalization method.
Microarray Data Analysis
In order to identify differentially expressed genes, chip data of IL-1β, IL-3, and IL-6 from stimulated HUVECs were compared with chip data from the BSA controls at each time point using several BioConductor R packages (www.bioconductor.org). Due to the limited number of replicates, the significance of differential expression was assessed using an intensity-dependent, locally pooled error estimate (LPE) (35). This approach usually requires larger fold changes for genes of low intensity to be considered significant. Z-scores and corresponding p-values were calculated based on this error estimate. Subsequently, p-values were adjusted for multiple testing using the Benjamini-Hochberg procedure [false discovery rate (FDR)]. Criteria used for the consideration of genes as differentially expressed were the following: a mean log2 probe intensity of more than three in the compared arrays (interleukin stimulation vs. BSA control), p-values less than 0.01 in the LPE test, and an adjusted p-value less than 0.2 (FDR 20%) to exclude probes of low signal intensity in accordance to the Benjamini-Hochberg procedure for multiple comparison adjustment. The differentially expressed genes detected were examined for enrichment of functional categories. Differentially expressed genes were compared via Venn diagrams for each condition. In order to elucidate the biological meaning of differentially expressed genes, functional analysis was performed by categorizing genes within the annotations of the Gene Ontology (GO) and Kyoto Encyclopedia of Genes and Genomes (KEGG) pathway analysis using the Database for Annotation, Visualization and Integrated Discovery (DAVID) Bioinformatics tools (22). We also used PathExpress Bioinformatics tools, which interpret gene expression data obtained from microarray experiments by identifying the most relevant metabolic pathways associated with differentially expressed genes (29). All corresponding raw data obtained from the microarrays were deposited in the microarray gene expression omnibus (36) database with the accession number GSE22325 (http://www.ncbi.nlm.nih.gov/geo/query/acc.cgi?token=pjcvnccesgyols&acc=GSE22325) and in the BioRetis database (http://www.bioretis.de).
Validation of Microarray Data
Quantitative gene expression was analyzed for inducible nitric oxide (NO) synthase (iNOS or NOS2, Assay ID: Hs00174103_m1), endothelial NOS (eNOS or NOS3, Assay ID: Hs00185761_m1), and prostaglandin-endoperoxide synthase 2 [PTGS2 or cyclooxygenase-2 (COX-2) Assay ID: Hs00153133_m1] using the Taqman gene expression assay according to the manufacturer's instructions (Applied Bioscience). To normalize expression values in each sample, the relative expression level of the β2-microglobulin housekeeping gene (β2M Assay ID: Hs99999907_m1) was used. Changes in gene expression were provided as a fold change of the stimulated cells in comparison to the unstimulated (0 h) control, in correlation to the housekeeping gene.
Functional Analyses of Potential Hematopoietic Growth Factors Secreted by Interleukin-Stimulated Endothelial Cells via Delta and Colony Assays
The NO donor (spermine/NO) (Sigma Aldrich, Germany) and PGE2 (Sigma Aldrich, Germany) were analyzed as potential expansion factors by sequential dilution expansion over 4 weeks as described elsewhere (17) with minor modifications. Briefly, 4 times; 104 CD34+ cells isolated from cord blood were cultured in 100 μl of stem cell medium based on Iscove's modified Dulbecco's medium (IMDM, Biochrom AG, Germany), supplemented with 20 % FBS, 2 mM L-glutamine, 50 μg/ml gentamycin, and 7.3 times; 10–5 M mercaptoethanol. Potential factors (PGE2 and NO) were added at a concentration of 10 or 100 ng/ml alone or in combination with 20 ng/ml of stem cell factor (SCF; Peprotech). Control samples were cultured in either medium alone or in combination with 20 ng/ml SCF. Cell counts were determined on a weekly basis, and expanded cells were recultured at a concentration of 4 times; 104 cells. Excess cells were analyzed for the presence of CD34 and CD45 by flow cytometry and for progenitor activity by methylcellulose and cobblestone assays as previously described (55).
Hematopoietic Colony Formation via the Methylcellulose Assay
The plating efficiency of the expanded HPCs was analyzed by plating 1 times; 103 CD34+ HPCs in 1 ml methylcellulose (Stem cell Technologies, Vancouver, BC) supplemented with 30% FBS, 20 ng/ml SCF, 20 ng/ml IL-3, 6 U/ml erythropoietin (Roche, Germany), and 100 ng/ml granulocyte-macrophage colony stimulating factor (GM-CSF, Peprotech) (39). Following a period of 2 weeks, cultures were scored for granulocyte-macrophage colony-forming units (CFU-GM), mixed colony forming units (CFU-Mix), and burst forming units-erythrocyte (BFU-E). Colonies consisting of more than 50 cells were scored using an inverted microscope. Each assay was performed in triplicate. The plating efficiency (PE) represents the number of colonies originating from single cells and was calculated as follows: PE (%) = (colonies counted per plate/cells inoculated) times; 100.
Cobblestone Area-Forming Cells (CAFCs)
The CAFCs assays were performed as previously described (55). In brief, appropriate numbers of freshly isolated or expanded HPCs were seeded onto confluent murine bone marrow MS-5 stroma in 12.5-cm2 flasks in α-MEM medium supplemented with 12.5% horse serum (PAA Laboratories, Pasching, Germany), 12.5% FBS, 10–5 M hydrocortisone, 2 mM L-glutamine, and 50 μg/ml gentamycine, and were demi-depopulated on a weekly basis. Cobblestone areas were scored following 2 and 5 weeks using an inverted phase microscope to identify phase-dark hematopoietic areas of at least five cells beneath the stromal layer.
Statistical Analysis, Ethics, and Supplementary Data
Statistical analysis of the HPC functional assays (delta, methylcellulose, and cobblestone assay) was performed as follows: SCF supplemented and nonsupplemented conditions were considered as independent groups and compared against their own control. Treatments with high and low concentrations of potential growth factors in the independent groups were compared with paired t-tests against own common control groups. Values of p < 0.05 were termed as significant. Normally, confidence levels of the t-test should be adjusted for multiple comparisons. In this instance, when applying the Bonferroni procedure, a confidence level of 98.75% (p < 0.0125) is adopted (since there are four comparisons of interest, i.e., treatments vs. control) instead of 95% (p < 0.05). This may be overly conservative and also result in type II errors (false negatives), although it does greatly reduce the likelihood of type I errors (false positives) (61,66,82). In coherence with previously published reports, we have chosen to not perform multiple comparison adjustments (26,55,57,71). The study was approved by the ethical review board of the Charité. Supplementary data can be found under the following ftp server (ftp://suppltrans:suppltrans@ftp.charite.de/Supplements).
Results
Gene Expression Profiling of IL-1β-Stimulated HUVECs
Microarray analysis of RNA from IL-1β-stimulated HUVECs following 4, 8, and 16 h of culture was performed and compared with BSA-stimulated HUVECs as a control at each time point. Three hundred and twenty-one Affymetrix Probe sets were identified to be significantly upregulated at least at one time point. This corresponds to 256 different genes (Supplement 1). A wide range of difference in expression was observed (log2 transformed fold change: 1.21–10.88).
To explore the biological significance of upregulated genes, we examined the Gene Ontology (GO) categories of differentially expressed genes. Table 1 displays GO categories of biological processes of the 256 upregulated genes with the lowest p-values. The vast majority of upregulated genes was observed to belong to the categories “cell differentiation,” “cell proliferation,” “developmental process,” and “response to stimulus.” The GO categories for cellular components and molecular functions are not reported here. Analysis of KEGG pathway categories identified a significant overrepresentation of genes involved in the cytokine–cytokine receptor interactions, hematopoietic cell lineage, Janus kinase/signal transducer and activator of transcription (JAK/STAT) signaling pathway, apoptosis, and the toll-like receptor signaling among the genes upregulated by IL-1β stimulation (Table 2). Notably, hematopoietic factors such as SCF, GM-CSF, G-CSF, and LIF were also identified. In addition to the annotation of upregulated genes in PathExpress metabolic pathways, we identified “arachidonic acid metabolism” as the most significant metabolic pathway associated with upregulated genes of IL-1β-stimulated HUVECs (p = 5.51 × 10⁻¹³). Other metabolic pathways were not identified as significant.
Partial List of GO Categories of Biological Processes of Upregulated Genes by Interleukin-1β (IL-1β)
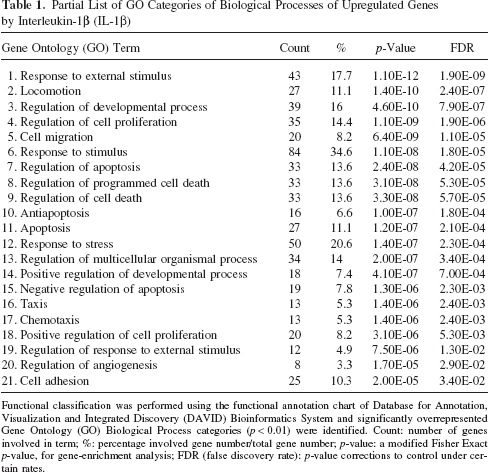
Functional classification was performed using the functional annotation chart of Database for Annotation, Visualization and Integrated Discovery (DAVID) Bioinformatics System and significantly overrepresented Gene Ontology (GO) Biological Process categories (p < 0.01) were identified. Count: number of genes involved in term; %: percentage involved gene number/total gene number; p-value: a modified Fisher Exact p-value, for gene-enrichment analysis; FDR (false discovery rate): p-value corrections to control under certain rates.
KEGG Pathway Analysis of Upregulated Genes From IL-1β-Stimulated Human Umbilical Vein Endothelial Cells (HUVECs)

The Kyoto Encyclopedia of Genes and Genomes (KEGG) Pathways analysis tools in the DAVID Bioinformatics system were used to detect pathways enriched in upregulated genes based on the KEGG database. Count: number of genes involved in term; %: percentage involved gene number/total gene number; p-value: a modified Fisher Exact p-value, for gene-enrichment analysis; FDR (false discovery rate): p-value corrections to control under certain rates.
As demonstrated in Figure 1, the Venn analysis of upregulated genes demonstrates that 81 Affymetrix probe sets representing 58 genes were continuously upregulated by the IL-1β-stimulated HUVECs at all time intervals analyzed (Supplement 2). In addition, 31 probe sets for 4 and 8 h, 24 probe sets for 8 and 16 h, and 8 probe sets for 4 and 16 h were observed as common elements.

Venn diagram representing common elements of each time point of IL-1β-stimulated HUVECs. Microarray resulted in the identification of 256 upregulated and 156 downregulated genes in at least one time point of interleukin (IL)-1β-stimulated human umbilical vein endothelial cells (HUVECs). The Venn diagram depicted represents the number of upregulated Affymetrix probe sets from each time point. Eighty-one probe sets were found to be commonly upregulated at all time points. We also identified 31 probe sets for both 4 and 8 h, 24 probe sets for 8 and 16 h, and 8 probe sets for 4 and 16 h as commonly expressed elements.
We also identified 147 genes downregulated at least at one time point in the IL-1β-stimulated cells (Supplement 1). In contrast to the upregulated genes, the downregulated genes were not significantly enriched in any specific GO categories. However, annotation of downregulated genes in the PathExpress metabolic pathways demonstrated enrichment for “arginine and proline metabolism” (p = 8.44 × 10⁻³).
Gene Expression Profiling of IL-3-Stimulated HUVECs
Gene expression profiling of IL-3-stimulated endothelial cells and BSA controls was performed following 4, 8, 16, and 48 h. The expression of 296 probe sets was increased at least at one time point (Supplement 3). Interestingly, the annotation of upregulated genes in their corresponding gene ontology and PathExpress metabolic pathway analysis demonstrated no enrichment in any category or pathway (FDR < 0.2). Upregulated genes were “extracellular matrix (ECM)–receptor interaction” (p = 8.2 × 10⁻³) via the KEGG pathway analysis. Thirty-five Affymetrix probe sets were observed to be upregulated at least at two time points (Supplement 4). In contrast to the upregulated genes, more unique Affymetrix probe sets (358) were identified to be downregulated at all four time points following IL-3 stimulation (Supplement 3). Furthermore, 63 probe sets were decreased at least at two time points (Supplement 4). The most significantly enriched “biological process” identified for downregulated genes was the “actin filament-based process” (p = 8.9 × 10⁻⁶). Although the downregulated genes of IL-3-stimulated HUVECs were not overrepresented in any PathExpress metabolic pathways, the ribosome term of KEGG pathway was solely identified to be significantly enriched (p = 1.9 × 10⁻⁵).
Gene Expression Profiling of IL-6-Stimulated HUVECs
Global gene expression analysis of IL-6-stimulated HUVECs was performed in an identical manner to that of IL-3-stimulated HUVECs, as a function of time following 4, 8, 16, and 48 h. In contrast to the other cytokines analyzed, IL-6 resulted in the lowest change of expression between 0.351 and 4.876 log2-fold for upregulated probe sets, and between −0.509 and −6.735 log2-fold for downregulated probe sets. Four hundred and thirty probe sets were ascertained to be upregulated, while 262 probe sets were identified to be downregulated at least at one time point (Supplement 5). Ninety-three of the up-regulated and 21 of the downregulated probe sets were recognized at more than one time point (Supplement 6). Gene Ontology categorized the upregulated genes as those that enrich the “regulation of transcription from RNA polymerase II promoter” and the “positive regulation of transcription,” whereas the downregulated genes were involved in “developmental process” and “response to stress.” PathExpress metabolic pathways identified no relevant association with the upregulated genes, whereas “gamma-hexachlorocyclohexane degradation” was identified with the downregulated genes (p = 4.12 × 10⁻³).
Comparison of Differentially Expressed Genes From Individual IL Stimulations
To investigate genes that are associated with the hematopoietic support of IL-stimulated HUVECs, we generated groups of genes with increased and decreased expression from each IL-stimulated condition and compared them via Venn analyses (Fig. 2). Only a small number of genes were found to be commonly differentially regulated under all three conditions (Table 3). Twenty-four shared elements were identified in IL-1β-and IL-3-stimulated HUVECs, whereas 14 were downregulated. The common elements of these upregulated genes include chemokine (C-C motif) ligand 2 (CCL2), microRNA-21 (miRNA-21), myeloid/lymphoid or mixed-lineage leukemia (trithorax homolog, Drosophila); translocated to: 4 (MLLT-4), sulfatase 1, thrombospondin 1, tumor necrosis factor (ligand) superfamily, member 10 (TNFSF-10), and v-ets erythroblastosis virus E26 oncogene homolog 1 (avian) (ETS1), whereas the function and relevance of these genes to HPCs is unknown (Table 4).
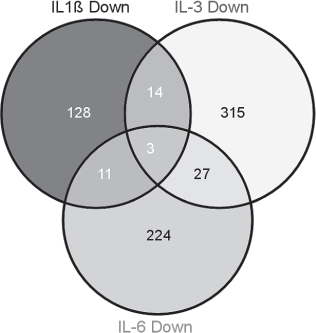
Venn diagram representing up- and downregulated common elements of IL-1β-, IL-3-, and IL-6-stimulated HUVECs. Interestingly, only 10 elements were identified as being upregulated in all three IL stimulations. In total, only three elements were found to be commonly downregulated. As IL-6 induced stem cell survival instead of expansion, the 24 upregulated common elements of IL-1β and IL-3 conditions are assumed as most relevant in association to stem cell expansion.
Common Up- and Downregulated Elements of IL-1β-, IL-3-, and IL-6-Stimulated HUVECs

Differentially expressed genes for each condition (time independent) were listed into three groups for further Venn analysis. Only a small number of genes were commonly up- or downregulated as presented in this table.
Common Up- and Downregulated Elements of IL-1β- and IL-3-Stimulated HUVECs

IL-1β- and IL-3-stimulated HUVECs demonstrated the highest expansion capacity to hematopoietic precursor cells (HPCs), as previously shown. Therefore, common elements of these two conditions could offer great potential to identify genes or factors that are associated with the HPC expansion. Altogether, 38 genes were commonly differential expressed in both conditions (i.e., 24 genes were commonly upregulated and 14 genes were found to be commonly downregulated in both conditions).
Validation of the Associated Metabolic Pathways with Taqman Gene Expression Assay
To demonstrate the accuracy of microarray for the identification of hematopoietic factors, PathExpress metabolic pathway analysis was performed in order to identify also nonproteinogenic factors. “Arachidonic acid metabolism” and “arginine and proline metabolism” were identified as the most significant metabolic pathways in IL-1β-stimulated HUVECs. These metabolic pathways are the primary source of PGE2 and NO. In order to confirm these as end products, we analyzed the gene expression of key enzymes via Taqman assay. These enzymes included PTGS2, iNOS, and eNOS. As depicted in Figure 3, a significant and time-dependent induction of the PTGS2 gene was observed following 4 and 8 h versus 0 h (16.3 ± 2.3- and 15.7 ± 0.99-fold change of 0 h). Gene expression analysis of iNOS in IL-1β-stimulated HUVECs demonstrated a −0.12-fold, −0.42-fold, and −0.80-fold downregulation following 4, 8, and 16 h, respectively, in comparison to 0 h, whereas eNOS expression was downregulated by −0.59-fold following 4 h, −0.55-fold following 8 h, and a −0.75-fold change following 16 h in comparison to 0 h.

Evaluation of microarray data in respect to eNOS, iNOS, and PTGS2 by TaqMan assay. The differentially expressed genes represented here are in accordance with the microarray data. Top: The strongest downregulation of inducible nitric oxide synthase (iNOS) can be observed following 4 h of IL-1β stimulation, whereas the strongest downregulation of endothelial NOS (eNOS) can be observed following 8 h. Bottom: In contrast, prostaglandin-endoperoxide synthase 2 (PTGS2) was found to be dramatically upregulated in IL-1β-stimulated HUVECs in all time points, with the strongest increase in 4- and 8-h conditions. The standard deviations are represented on the diagrams as error bars.
Functional Analysis of Hematopoietic Support of PGE2 and NO on CD34+ Cells
The effect of PGE2 and NO on the proliferative capacity of CD34+ HPCs was investigated via the delta assay (Fig. 4). During the first week, even high concentrations of PGE2 did not significantly increase the expansion rate of HPCs. However, high concentrations of NO alone and both NO concentrations with SCF (20 ng/ml) induced a significantly increased expansion rate. In contrast to the first week, a 2-week treatment with NO did not support cell expansion. PGE2 treatment at low and high concentrations alone and 10 ng/ml in combination with 20 ng/ml SCF were observed to significantly increase HPC expansion after 2 weeks. Following treatment for 3 and 4 weeks, no significant differences in HPC expansion were observed.

Stem cell expansion assays (delta assay) with prostaglandin E 2 (PGE2) and nitric oxide (NO) following stimulation for 1 and 2 weeks. The effect of PGE2 and NO on the proliferative capacity of CD34+ HPCs was investigated via the delta assay. Although treatment with PGE2 (both 10 and 100 ng/ml) in the absence of stem cell factor (SCF) demonstrated a significant increase in the expansion of HPCs during the second week [3.66 ± 1.02 (p = 0.006) and 2.16 ± 0.5 (p = 0.001) respectively vs. control 1.5 ± 0.4], no significant increase could be observed in the first week. In combination with SCF, a significant expansion rate was only observed with 10 ng/ml PGE2 [4.48 ± 0.74 (p = 0.037) vs. control 3.59 ± 0.51]. During the first week, 100 ng/ml NO but not 10 ng/ml NO without SCF demonstrated a significant expansion rate of HPCs [2.01 ± 0.51 (p = 0.047) vs. control 1.46 ± 0.34]. However, both concentrations of NO in combination with SCF significantly increased the expansion of HPCs during the first week [4.62 ± 1.43 (p = 0.029) and 4.91 ± 1.18 (p = 0.005) respectively vs. control 3.51 ± 0.71] but not during the second week. Further treatment for 3 and 4 weeks did not demonstrate any significant changes. Statistical analysis is based on the results of 12 independent experiments for the first week and seven independent experiments for the second week, each performed in triplicate. The standard deviations are represented on the diagrams as error bars and * indicates a value of p < 0.05. hPGE2 and hNO represent 100 ng/ml, whereas LPGE2, LNO 10 ng/ml of PGE2 and NO donors.
The cumulative expansion rate, which is defined as the summarized expansion rate over a period of 4 weeks, was also determined. High concentrations of PGE2 and NO did not affect the cumulative expansion. A significantly increased cumulative expansion rate was only observed in the HPCs treated with 10 ng/ml PGE2 and SCF (133.09 ± 62.87 vs. SCF alone 90.67 ± 27.21, p = 0.04). Flow cytometry was performed in order to evaluate CD34+ and CD45+ populations in expanded cells. Since an increase in the proliferation of HPCs is associated with the loss of CD34, we observed a reverse relationship between SCF and the percentage of CD34+ HPCs. PGE2- and NO-expanded cells were still CD34+ following 2 weeks of culture, and no significant difference compared to the control was observed, although the increased expression of CD45 indicated leukocyte differentiation (10 and 100 ng/ml PGE2-expanded cells: 10.63 ± 3.77% and 19.35 ± 5.32% CD34; 10 and 100 ng/ml NO-expanded cells: 21.78 ± 5.04% and 10.80 ± 3.88% CD34 vs. 24.47 ± 5.50% CD34 of control, respectively).
The clonogenic capacity of the PGE2- and NO-expanded HPCs was analyzed by the methylcellulose assay. NO-expanded HPCs did not significantly differ from controls in the total number of colonies and PE (Supplement 7). A reduction in the number of CAFCs was observed for the majority of analyzed conditions at 5 weeks in comparison to 2 weeks. As can be observed in Table 5, the HPCs expanded in 10 ng/ml PGE2 in combination with 20 ng/ml SCF led to a significantly greater increase in CAFCs following 2 and 5 weeks [6.33 ± 1.82 (p = 0.012) and 6.34 ± 1.79 (p = 0.013) vs. control 4.94 ± 1.95 and 1.72 ± 0.97], whereas treatment with 10 ng/ml NO alone significantly decreased the number of CAFCs following 2 weeks (3.88 ± 1.64 vs. control 13.41 ± 5.07, p = 0.025).
Cobblestone Area-Forming Cell (CAFC) Assay of Prostaglandin E2 (PGE2)- and Nitric Oxide (NO)-Expanded CD34+ Cells Following 14 Days

A reduction in the number of CAFC colonies was observed for the majority of analyzed conditions at 5 weeks in comparison to 2 weeks. The expanded HPCs with 10 ng/ml PGE2 in combination with 20 ng/ml stem cell factor (SCF) significantly increased the number of CAFC colonies following 2 and 5 weeks versus control, whereas treatment with 10 ng/ml NO alone significantly decreased the number of CAFCs following 2 weeks. Mean results ± SE of five independent experiments in triplicate (cobblestone assay).'
Significant differences (p < 0.05) compared to the corresponding controls.
Discussion
The human endothelium represents a barrier between the tissue and the peripheral blood system, and plays a crucial role in the initiation of the cellular immune response (48). Endothelial cells are also a component of the BM microenvironment, which interacts with stem cells to regulate their fate (7). Several authors have reported that vascular and BM-derived ECs support hematopoiesis (2,50,52,79). The mechanisms by which ECs support hematopoiesis is believed to involve endothelium-derived cytokines, ECM proteins, and cell-to-cell interactions (13,15,41,49,86). Endothelial cells represent an important source of hematopoietic growth factors (58). Besides the known cytokine repertoire, ECs may synthesize other proteins and nonproteinaceous factors, thereby inducing the growth of HPCs. Recently, we demonstrated that IL-1β- and IL-3-stimulated ECs induce the proliferation and differentiation of myeloid precursor cells from HPCs, while IL-6-stimulated HUVECs only demonstrated a benefit in HPC survival (55). Several groups have reported on mesenchymal stem cells from both BM and umbilical cord that demonstrate hematopoiesis-supporting activity similar to ECs (19,30).
This study presents the gene expression profiles of IL-1β-, IL-3-, and IL-6-stimulated HUVECs and subsequent analysis of the function of particular genes in respect to the proliferation and differentiation of HPCs. The analysis of the differential expression patterns was utilized in order to identify metabolic pathways and thus nonprotein components, which may have an impact on HPC expansion and differentiation.
Consistent with the role of IL-1β-stimulated HUVECs, we detected the upregulation of growth factors such as SCF, GM-CSF, G-CSF, IL-6, IL-1β, IL-1α, IL-7R, and CD71, which are all annotated to the “hematopoietic cell lineage” KEGG pathway. Overall, a strong increase in the transcription of more than 250 genes was induced by IL-1β. The majority of these upregulated genes are known to be secreted in the extracellular space. Most of the genes continuously upregulated at all time points are known to be involved in processes of inflammation or immune modulation. These include numerous chemokines and chemokine receptors, cytokines and other signaling proteins, along with three well-known adhesion proteins [E-selectin, intercellular adhesion molecule 1 (ICAM-1), vascular cell adhesion molecule (V-CAM)]. In contrast to other studies, which only utilized the unstimulated control at baseline for comparison (8,89), our experiments, with interleukins as effector stimulants, included BSA as a control stimulus at each time point. We observed that BSA also influenced the gene expression profile, which was not assessed when comparing the gene expression profiles of IL-stimulated ECs to BSA-stimulated specimens.
The most significant pathway identified with PathExpress metabolic pathway analysis of IL-1β-stimulated HUVECs was the arachidonic acid pathway. The main product of this pathway is PGE2, whose synthesis is controlled by the PTGS2 gene. We analyzed the gene expression profile of the PTGS2 gene by quantitative PCR and were able to confirm the microarray data. This finding is in accordance with previous studies whereby the induction of PGE2 by IL-1β in HUVECs was measured on a transcriptional, translational, and secretorial level (68,81). In order to determine the functional property of PGE2 on HPC expansion, various functional analyses (delta, methylcellulose, and cobblestone assay) were performed with 10 and 100 ng/ml of PGE2. We identified that both concentrations significantly increased, independently of SCF, the HPC expansion following a period of 2 weeks. Furthermore, we identified a significantly increased cumulative expansion rate over 4 weeks at low concentrations of PGE2 in combination with SCF. Via the cobblestone assay, we also identified that low concentrations of PGE2 in combination with SCF significantly increased the number of CAFCs at 2 and 5 weeks in comparison to the controls. Our data are in accordance to previous report on the effect of PGE2 on hematopoietic stem cell survival and proliferation (28).
In comparison to upregulated genes, downregulated genes in IL-1β-stimulated HUVECs could signify potential inhibitory factors on HPC proliferation and differentiation. The annotation of the downregulated gene sets in PathExpress resulted in the identification of the “arginine-proline metabolism.” NO plays a crucial role in this pathway, which is synthesized by iNOS and eNOS. Via TaqMan gene expression analysis of iNOS and eNOS, we were able to validate the microarray data obtained in this study.
NO was utilized here as a negative control in our stem cell expansion assay as we hypothesized that NO may have an inhibitory effect on the proliferation and differentiation of HPCs. This is supported by Michurina and colleagues (51), who identified the inhibitory potential of NO on HPCs and further noticed that the inhibition of NOS increases the number of stem cells. Due to the short half-life of free NO, various forms of stabilized NO donors are available including spermine/NO, which we utilized in our expansion assays. This was due to the observation that sperimidine (spermine-N′-acytyltransferase, SAT1 or SSAT), which regulates cellular polyamine content, was also found to be upregulated at all of the examined time points in IL-1β-stimulated ECs.
In contradiction to our expectations, we observed an increased proliferation of HPCs with spermine/NO alone and in combination with SCF during the first week, whereas no difference was observed in the methylcellulose and cobblestone assays. These findings suggest that spermine may be a potential hematopoietic growth factor. In accordance with our results, polyamines, in particular spermine, have been suggested to play a role in the proliferation and differentiation of hematopoietic cells (47). Furthermore, its acetylated products are either excreted from the cell or oxidized by acetyl polyamine oxidase. Polyamines have been identified to play a critical role in both normal and neoplastic growth and in ion channel regulation (60). The role of spermine and NO, with respect to hematopoiesis, should be an avenue for further research.
Interestingly, SSAT was identified to interact with other important proteins, which include hypoxia-inducible factor-1α (HIF-1α) and causes their degradation (4). HIF-1α is a transcription factor, which regulates genes associated with erythropoiesis (87). IL-1β-stimulated EC culture supernatants have been characterized to only induce the myeloid lineage of differentiation by several research groups (36,55,58). This indicates that the factors responsible for erythropoietic cell differentiation must be inhibited or absent. Here, we postulate that the spermine is capable of and responsible for blocking HIF-1α, thereby preventing ECs from expressing and secreting erythropoietic factors. Future studies should focus on employing SSAT in the reactivation of erythroid factors.
To our knowledge, for the first time, data on the gene expression profile of IL-3-stimulated HUVECs are presented. Interestingly, we identified several upregulated genes encoding proteins that are major components of the ECM including heparan sulphate proteoglycan 2, biglycan, clusterin, matrix gla protein, matrix metalloproteases (MMP28, MMP14), bone morphogenic protein 4 (BMP4), laminin alpha 4, glypican 1, fibronectin 1, dystonin, and decorin. The ECM is often directly or indirectly involved in regulating proliferation and differentiation (27,33,43). ECM components modulate the bioactivities of growth factors and cytokines such as transforming growth factor-β (TGF-β), TNF-α, and platelet-derived growth factor (PDGF) either by activation via proteolytic processing, inactivation by sequestering and preventing binding to their respective receptors, and/or by direct binding to cytokine receptors (34,70). Biglycan and decorin have been demonstrated to be involved in modulating bone formation from BM stroma cells (90). Thus, biglycan and decorin appear to be essential in maintaining an appropriate number of mature osteoblasts by modulating the proliferation and survival of BM stroma cells. An increased proliferation rate of stem cells with the supernatant of IL-3-stimulated ECs was identified in that study. This indicates that components of the extracellular matrix may play a crucial role in the proliferation of CD34+ HPCs.
In agreement with our results, IL-3 stimulation does not cause an increased secretion of GM-CSF and G-CSF in HUVECs compared to IL-1β (46). IL-1β has been previously demonstrated to induce a time-dependent increase in G/GM-CSF (5). Cytokine responses can be regulated by a family of proteins termed suppressors of cytokine signaling (SOCS), which can inhibit the JAK/STAT pathways in a classical negative-feedback manner (78). In this study, cytokines were poorly expressed in IL-3-stimulated HUVECs. Interestingly, SOCS2, which can suppress growth and cytokine signaling at very low levels, was found to be continuously upregulated by IL-3, which may explain the decreased expression of some cytokines.
The supernatants of IL-1β- and IL-3-stimulated HUVECs demonstrated proliferative effects on HPCs as previously described (55). Therefore, the shared elements of IL-1β and IL-3 are most promising in order to identify the proliferative expansion factors. Twenty-four genes were identified in IL-1β- and IL-3-stimulated HUVECs as common elements (Table 4). However, the function and relevance of these common elements to HPCs remain unknown. These common elements exhibit great potential, thus warranting for their further investigation.
This study also demonstrated for the first time the gene expression profile of IL-6-stimulated HUVECs. We have previously shown that IL-6-stimulated endothelial supernatants provided a survival benefit for HPCs (55). Altogether, 403 affymetrix probe sets were identified to be upregulated in all four examined time points. In analogue to IL-3, cytokines were poorly expressed in IL-6-stimulated HUVECs. Interestingly, we identified SOCS3 to be upregulated in IL-6-stimulated HUVECs, while IL-3 showed an upregulation of SOCS2. The function of the SOCS-3 protein has been characterized as an end point in a classical negative feedback loop whereby activation of STATs triggers their induction. Induced SOCS proteins terminate the signaling and expression of cytokines (1,75). However, we identified several genes such as chemokine C-C motif ligand 14 (CCL14, HCC-1) and myeloid cell leukemia sequence 1 (MCL1), which are known survival and/or proliferation factors of HPCs (72,73,88).
Several studies have recently reported on microvesicle- and exosome-mediated intercellular communication of cells (3,18,65). Cells use receptor–ligand interactions and endocrine, paracrine, and juxtacrine mechanisms to transfer signals to one another. Information conversion between cells via the horizontal transfer of mRNA-rich microvesicles (MVs) has been reported. Not only mRNAs, but also miRNAs, transcription factors (TFs), intracellular signaling molecules, and cell surface receptors are transferred by MVs. However, the influence of MVs on the proliferation and differentiation of CD34+ HPCs remains unknown. Here, we identified several upregulated genes in IL-3-stimulated HUVECs, which are associated with MVs. These include the plasmalemma vesicle associated protein (PLVAP), coatomer protein complex, matrix metallopeptidase 14, clathrin, heat shock protein 90 kDa α, and biglycan. Not only IL-3 but also IL-1β- and IL-6-stimulated HUVECs demonstrated the upregulation of some of these potential MV-associated genes, which potentially indicate that interleukins or cytokines may generally induce MV formation and secretion. In addition, we identified several genes encoding RNA binding proteins, which may be involved in the preservation of RNA in horizontal information transfer. Pilot studies are currently under way analyzing the influence of MVs on the proliferation and differentiation of HPCs.
In conclusion, here we present a detailed molecular profile for the hematopoietic support of IL-stimulated HUVECs using microarray. In comparison to IL-3- and IL-6-stimulated HUVECs, IL-1β-stimulated cells demonstrated the highest fold of expression change. As the supernatants of IL-1β- and IL-3-stimulated HUVECs had a significant hematopoietic effect on HPCs, the common elements of both supernatants provide great potential to identify novel factors for HPC expansion. Metabolic pathway analysis was performed in order to identify nonproteinogenic expansion factors such as PGE2 and spermine/NO, which were further analyzed functionally. A significant increase in HPC expansion was observed for PGE2 via the delta, methylcellulose, and cobblestone assays. We conclude that spermine could be a potential hematopoietic expansion factor. The data presented here provide new insights into the role of ECs and their secreted soluble factors, which may have great impact on the survival, proliferation and differentiation of CD34+ HPCs.
Footnotes
Acknowledgments
This study was part of the Ph.D. thesis of Gürkan Bal conducted at the Institute for Transfusion Medicine, Charité-Universitätsmedizin Berlin, Germany. This project was supported by the Federal Ministry of Education and Research (Grant 0311591) and habilitation scholarship of the Rahel Hirsch Foundation (A.M.). We thank Dr. Sundrela Kamhieh-Milz for editing the manuscript, and critical input. The authors declare no conflicts of interest.