
Abstract
New potential sources of stem cells for clinical application include bone marrow mesenchymal stem cells (BMMSCs), human embryonic stem cells (hESCs), and induced pluripotent stem cells (iPS). However, each source is not without its own concerns. While research continues in an effort to overcome these problems, the generation of mesenchymal progenitors from existing hESC lines may circumvent many of these issues. We report here a simple and efficient method of generating hESC-derived mesenchymal progenitors (EMPs) and transcriptome profiling using a concise, custom-designed, oligomnucleotide gene expression microarray. Characterization of EMPs shows that these cells are similar to BMMSCs in terms of differentiation capacity as well as cell surface marker expression. In addition, EMPs express several ESC markers and HLA-G, a nonclassical MHC class I molecule with immunomodulatory properties. Morevoer, EMPs possess significantly enhanced proliferative ability over BMMSCs during which karyotypic stability was maintained. Although derived from hESCs, EMPs do not form any tumors in immunocompromised mice. To efficiently profile gene expression in multiple samples, we designed an oligoarray to probe just over 11,000 genes highly expressed in stem cells. We found that the transcriptome of EMPs is more similar to BMMSCs than hESCs. Both cell types highly express genes involved in processes related to the cytoskeleton, extracellular matrix, and cell adhesion, but EMPs show higher expression of genes involved in cell proliferation whereas BMMSCs showed higher expression of immune-related genes. Based on our data, EMPs may be an accessible source of mesenchymal progenitor for therapeutic use.
Keywords
Introduction
In recent years, findings of plasticity for adult bone marrow mesenchymal stem cells (BMMSCs) have generated much excitement (28,37,39). Moreover, the immunomodulatory properties of BMMSCs render these cells possible for allogeneic as well as autologous use, greatly expanding its applicability (4,6,26,31). While a number of clinical trials have been started using this stem cell population, the fact remains that BMMSCs are a rare population in the marrow and cell numbers continue to decrease with age (40). Ex vivo expansion is invariably needed but this can result in cell senescence or conversely selecting for transformed clonal populations, neither condition of which is compatible with therapeutic use (14,44,56).
A source of stem cells that are considerably more pluripotent and proliferative than BMMSCs are the human embryonic stem cells (hESCs) isolated from the inner cell mass of preimplantation embryos (50). Like its murine counterpart, hESCs are capable of essentially indefinite in vitro propagation while maintaining their pluripotent differentiation abilities (41). While these stem cells offer hope for therapeutic use as well, several problems remain, including tumorigenicity and immunological rejection, as well as ethical issues. A new source of similar stem cells has recently been discovered in which somatic cells are reprogrammed to pluripotency by addition of a handful of genes (48,49). The generation of these induced plutipotent stem cells (iPS) have brought much excitement, since with this method it would be possible to establish donor-specific stem cells with ESC-like pluripotency without ethical or immunological concern (42). However, several issues still preclude iPS from clinical use in the near future, including the use of viral vectors for introduction of genes, the inclusion of oncogenes in the genetic “cocktail,” and in vivo teratoma formation, all issues that are actively investigated upon (58).
While research continues on the clinical applicability of BMMSCs, hESCs, and iPS, it would appear that an ideal stem cell source would combine the nontumorigenic and immunomodulatory properties of BMMSCs along with the enhanced proliferative properties of hESCs and iPS (22). To this end, we would like to report a simple and efficient method of deriving mesenchymal progenitors from hESCs. We previously have found that hESC-derived mesenchymal progenitors (EMPs) possess significant immunomodulatory effects (60). Currently, derivation of EMPs requires xenogenic feeder cells and/ or complicated techniques including embryoid body formation and cell sorting (2,33,36,57). Here, we report an efficient method of generating EMPs, with detailed characterization of these cells including in vitro proliferative and differentiation studies, karyotype assessment, and in vivo tumor formation assessment. Gene expression analysis and comparison of EMPs with BMMSCs was also performed using a concise, custom-designed gene expression microarray.
Materials and Methods
Cell Culture and Derivation of EMPs
HSF-6 hESCs (NIH code UC06) were obtained from University of California, San Francisco under a Materials Transfer Agreement, and cultured as previously reported (1). EMPs were derived by replacing the medium of hESCs with BMMSC medium, which consisted of DMEM-low glucose, 1% penicillin/streptomycin (Gibco-Invitrogen, Carlsbad, CA), and 10% fetal bovine serum (FBS, selected lots from Hyclone, Logan, UT). At confluence, cells were passaged by trypsinization (0.025% trypsin/EDTA, Gibco-Invitrogen) and expanded in BMMSC medium. BMMSCs were obtained from Cambrex (East Rutherford, NJ) and cultured as reported by Pittenger et al. (37).
Immunophenotyping
To detect surface antigens, aliquots of cells were washed with PBS containing 2% FBS after detachment with 0.25% trypsin/EDTA. All antibodies were purchased from BD Biosciences (Franklin Lakes, NJ) except human leukocyte antigen (HLA)-G from AbD Serotec (Oxford, UK) and TRA-1-60 and TRA-1-81 from Millipore-Chemicon (Billirica, MA). Cells were stained with fluorescein isothiocyanate (FITC)- or phycoerythrin (PE)-conjugated antibodies and compared with appropriate isotype controls. Flow cytometry analysis was performed using a FACSCalibur flow using CellQuest software (BD Biosciences) as previously reported (60).
Alkaline Phosphatase Staining
Alkaline phosphatase (ALP) staining was performed using the Leukocyte Alkaline Phosphatase Kit (Sigma-Aldrich, St. Louis, MO) according to the manufacturer's instructions.
In Vitro Differentiation Studies and Characterization
For mesodermal differentiation into adipogenic, chondrogenic, and osteogenic lineages, cells were cultured and characterized as previously reported (62). Neurogenic differentiation was induced by culturing cells at low density (3000 cells/cm2) in serum-free medium with 0.5 μM retinoic acid and 50 ng/ml neural growth factor (NGF; R&D Systems, Minneapolis, MN) (43). For staining, cells were fixed in 4% paraformaldehyde (PFA; Sigma-Aldrich) for 10 min at room temperature and permeabilized with 0.1% Triton X-100 (Sigma-Aldrich) for 10 min. Primary antibodies against the human antigens stage-specific embryonic antigen 4 (SSEA-4), octamer binding transcription factor (Oct-4), nestin (1:100), glial fibrillary acidic protein (GFAP; 1: 250), and microtubule-associated protein 2 (MAP2; 1: 250) were purchased from Millipore-Chemicon; antibodies against type II collagen were purchased from Santa Cruz Biotechnology Inc. (Santa Cruz, CA; 1:100). Immunofluorescence staining for neural characterization was performed as previously reported (62). Briefly, samples were first incubated with the primary antibodies at 4°C overnight, then rinsed three times with PBS and incubated for 60 min at room temperature with FITC-conjugated secondary antibodies at a dilution of 1:100. All samples for immunofluorescent staining were stained with 4′,6-diamidino-2-phenylindole (DAPI, 1:2000; Molecular Probes), and visualized under a fluorescence microscope (Olympus, Tokyo, Japan). RT-PCR was performed using primers for mesodermal lineages as previously described (62); primers for GFAP are: 5′-AG GAAGATTGAGTCGCTGGA-3′ (forward) and 5′-AT ACTGCGTGCGGATCTCTT-3′ (reverse).
Cell Proliferation Assessment
Cells were seeded initially at 1.5 × 10⁴ cells/cm2 beginning from the second passage (P2). Upon subconfluent growth at a density of 80%, cells were trypsinized as usual and replated at the initial density. Growth curve and population doubling time were determined as previously described (13).
Karyotype Analysis
Samples of cells were treated with 10 mmol/L colcemid (Sigma-Aldrich) overnight. After washing, the cells were incubated in 0.4% trypsin for 2–3 min. Cells were treated with 1400 IU/ml collagenase (Gibco-Invitrogen) at 37°C for 20 min, and harvested using standard procedures. The metaphases were analyzed after Q-banding.
Cell Cycle Analysis
Cells were collected, permeabilized with ice-cold 70% alcohol, and preserved in −70°C for at least 1 h. Distribution of cell cycle phases was assessed by DNA content by suspending cells in 200 μl of propidium iodide solution (PI; 0.3% saponin, 20 μg/ml propidium iodide, 0.2 mg/ml RNAse-A, 1% bovine serum albumin, and 0.5 mM EDTA, ph 7.2; all from Sigma-Aldrich) for 15 min at room temperature. Fluorescence intensity was measured using a FACScan flow cytometer (BD Biosciences) and analyzed using ModFit LT (Verity Software House, Topsham, ME).
Array Comparative Genomic Hybridization (aCGH)
aCGH was performed as previously reported (3). Briefly, DNA was isolatied and assessed for quantity and purity of DNA. Two sets of hybridization were performed: HSF-6 (parental hESCs) against newly derived EMPs, and newly derived EMPs against late passage (passage 15) EMPs. Labeled and denatured DNA target was then hybridized to SurePrint G3 Custom Human CGH 2×400K microarray (G4448A, Agilent Technologies, USA) and signals were acquired by scanning an Agilent DNA microarray scanner at 535 nm for Cy3 and 625 nm for Cy5 at a resolution of 2 μm. Scanned images were analyzed by Feature extraction 10.5.1.1 software (Agilent Technologies), with normalization by linear normalization method. Data analysis was performed with DNA Analytics 4.0 (Agilent Technologies).
Transcriptome Profiling
Total RNA Purification
Total RNA was extracted by Trizol® Reagent (Gibco-Invitrogen), and followed by processing with the RNeasy Mini Kit (Qiagen, Germany). The extracted RNA was quantified at OD 260 nm by using a ND-1000 spectrophotometer (Nanodrop Technology, USA), with purity assessed by using a Bio-analyzer 2100 (Agilent Technology) with RNA 6000 nano labchip kit (Agilent Technologies).
Microarray Design and Experimental Procedure
A dual-color whole human genome oligo microarray (G4112A, Agilent Technologies) was used initially to screen for differentially expressed genes (2.5-fold change) in BMMSCs and hESCs (using HSF-6). Based on this list and commercially available arrays (51), as well as published reports of hESC (2) and BMMSC (29) transcriptome, a custom oligo microarray (Agilent Technologies) consisting of 13,899 probes representing 11,304 genes was designed. The design format was based on Agilent custom 8-pack design, in which each pack contains identical 15,744 features with 82 columns and 192 rows.
Total RNA (0.5 μg) extracted from EMPs, HSF-6, and BMMSCs (two samples) was amplified by a Quick-Amp labeling kit (Agilent Technologies) and labeled with Cy3 (CyDye, PerkinElmer, USA) during the in vitro transcription process. Cy-labled cRNA (0.6 μg) was fragmented to an average size of about 50–100 nucleotides by incubation with fragmentation buffer at 60°C for 30 min. Correspondingly fragmented labeled cRNA was then hybridized to the custom stem cell 8 × 15 K oligo microarray (Agilent Technologies) at 60°C for 17 h. After washing and drying by nitrogen gun blowing, microarrays were scanned with an Agilent microarray scanner (Agilent Technologies) at 535 nm for Cy3. The scanned images were analyzed by Feature extraction 9.5.3 software (Agilent Technologies), and data were generated by subtracting the mean background light intensity from the mean signal intensity then corrected for multiplicative surface. All data are Minimum Information About a Microarray Experiment (MIAME) compliant, and available at the Gene Expression Omnibus database (GSE18543; http://www.ncbi.nlm.nih.gov/geo/query/acc.cgi?acc=GSE18543).
Microarray Data Processing and Analyses
Data analyses were performed using Gene Spring software (Agilent Technologies) (12,21). Principle components analysis (PCA) was performed as previously reported (24). For hierarchical clustering, standard correlation was applied to measure the similarity of the expression pattern between samples. The web database Gene Ontology (http://www.geneontology.org) was used for functional profiling on the basis of gene ontology terms.
To identify concordantly and discordantly expressed genes between EMPs and BMMSCs, the average intensity for the two samples of BMMSCs was first determined. The genes were then ranked by the ratio of signal intensity of BMMSCs to EMPs. Genes with an intensity ratio of > 1.2 were determined to be highly expressed by BMMSCs, whereas genes with an intensity ratio <0.8 were determined to be highly expressed by EMPs; ranking was according to intensity ratio. Concordantly expressed genes were within the ratio of 0.8 to 1.2 and further ranked by multiplying the signal intensity of the two cell types.
Real-Time RT-PCR
Microarray results were confirmed by real-time RT-PCR (qPCR); primers are listed in Table 1. qPCR was performed on an ABI 7500 Real-Time PCR System (Applied Biosystems Inc., Foster City, CA) instrument using SYBR green (Applied Biosystems Inc.). Dissociation curve analyses were performed using the instrument's default setting immediately after each PCR run according to the standard protocol provided by manufacturer.
Primers for Real-Time PCR

In Vivo Differentiation and Tumorigenesis Studies
All animal work was performed in accordance with protocols approved by the Institutional Animal Care and Use Committee of the College of Medicine, National Taiwan University using 4- to 6-week-old nonobese diabetic severe combined immunodeficient (NOD-SCID) mice supplied by the animal center of the College of Medicine, National Taiwan University, Taipei, Taiwan. In vivo differentiation for osteogenesis was performed as previously reported (20). For in vivo tumor studies, cells (1.5 × 10⁶ cells) were injected subcutaneously into the middorsal intrascapular region. For negative control, culture medium only was injected; for positive controls, HSF-6 and mouse ESCs (D3) were injected. Mice were followed up for at least 4 months or when tumors reached 1.8 cm3 then sacrificed with tumors extracted. Tumors (teratomas) were fixed in 10% neutral buffered formalin, embedded in paraffin, and examined histologically after hematoxylin and eosin staining.
Results
When grown on mouse embryonic fibroblasts (MEFs), the hESC line HSF-6 exhibit the typical colony morphology and high nucleus-to-cytoplasm ratio of ESCs (Fig. 1A). The cells are negative for SSEA-1 (Fig. 1B) but positive for the pluripotency markers of ALP and SSEA-4 (Fig. 1C and D, respectively). Derivation of EMPs from hESCs can be readily achieved by switching from hESC medium to BMMSC medium. Without feeder support and/or exogenous pluripotency maintenance growth factors such as β-fibroblast growth factor, HSF-6 cells begin to lose the typical ESC morphology and cells at the border of the colonies begin to acquire a fibroblastic morphology (Fig. 1E–F). Further treatment of these hESCs by passaging with trypsin/EDTA—routine for BMMSCs—rather than collagenase results in a complete morphological change of cells to a fibroblastic shape (Fig. 1G). Undifferentiated EMPs are negative for ALP but express the neural stem cell (NSC) marker nestin (Fig. 1H and I, respectively), which can be found in undifferentiated mesenchymal progenitors (5,62).
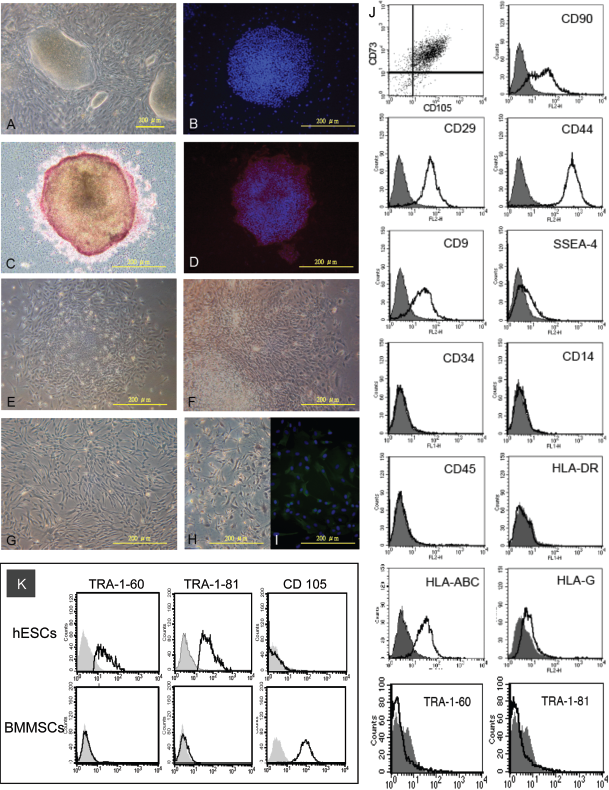
Characterization and derivation of human embryonic stem cell (hESC)-derived mesenchymal progenitors (EMPs) from the hESC line HSF-6. (A) Morphology of HSF-6 grown on mouse embryonic feeders; (B) immunofluorescence (IF) staining for stage-specific embryonic antigen-1 (SSEA-1; fluorescein isothiocyanate; FITC); (C) alkaline phosphatase staining (ALP); (D) IF staining for SSEA-4 (PE). (E, F) Changes in morphology of HSF-6 after culturing with bone marrow mesenchymal stem cell (BMMSC) medium (100x and 200x magnification, respectively); and (G) confluent culture of EMPs posttrypsinzation. Characterization of undifferentiated EMPs by (H) ALP staining, (I) IF staining for nestin, and (J) flow cytometric analyses of cell surface markers on EMPs and (K) on hESCs and adult BMMSCs.
Cell surface marker expression on EMPs was characterized, and immunophenotyping of EMPs shows that they are positive for the BMMSC markers of CD73, CD105, CD90, CD29, and CD44 (Fig. 1J). Interestingly, EMPs remain slightly positive for SSEA-4 and also CD9—which has been increasingly used as a marker for hESCs (8,30)—but not other hESC markers such as TRA-1-60 or TRA-1-81. BMMSCs also do not express the TRA antigens but are positive for CD105 as expected; this is in contrast to hESCs (Fig. 1K). EMPs do not show expression of the hematopoietic markers CD34, CD14, or CD45. In terms of major histocompatibility complex molecule expression, EMPs do not express class II molecules such as HLA-DR, but do express the class I molecule of HLA-ABC as well as the nonclassical MHC I molecule HLA-G slightly.
We then assessed EMPs for differentiation capacity. Since MSCs readily differentiate into mesodermal phenotypes, we performed similar studies on EMPs. Differentiation of EMPs into an osteoblastic phenotype is possible both in vitro and in vivo (Fig. 2A and B, respectively). In vitro chondrogenic differentiation is also readily achieved, as seen by positive staining for alcian blue and type II collagen, a chondrocyte-specific collagen (Fig. 2C and D, respectively); adipogenesis can also be easily achieved (Fig. 2E). Given that EMPs are positive for the NSC marker nestin, we cultured the cells in neural differentiation medium (NDM) consisting of serum-free medium with retinoic acid and NGF to induce neural differentiation. After 24 h, EMPs acquire a neural-like morphology as seen by phase-contrast microscopy (Fig. 2F). Moreover, increases in expression of late neural markers of MAP2 and GFAP can be seen with NDM treatment (Fig. 2G–J). Gene expression analyses show that lineage-specific genes are increasingly expressed after culturing in the appropriate medium after 3 days, with undifferentiated EMPs cultured in control medium showing none or minimal lineage-specific gene expression (Fig. 2K).

Differentiation potential of EMPs (control conditions as insets). (A) In vitro (Alizarin red staining for calcium deposition) and (B) in vivo osteogenic differentiation (H&E staining); in vitro chondrogenic differentiation with (C) Alcian Blue staining and (D) type II collagen staining; (E) in vitro adipogenic differentiation with staining for Oil Red O; in vitro neural differentiation (phase contrast microscopy; F) with immunofluorescent staining for microtubule associated protein 2 (MAP2; G and I) and glial fibrillary acidic protein (GFAP; H and J) of EMPs cultured in control medium (CM; G and H) and neural differentiation medium (NDM; I and J). (K) RT-PCR analyses for expression of lineage-specific genes after differentiation. ODM, osteogenic differentiation medium; ADM, adipogenic differentiation medium; ChDM, chondrogenic differentiation medium.
In terms of growth kinetics, EMPs can be expanded up to 20 passages (approximately 60 population doublings) before proliferation is halted, whereas BMMSCs invariably stopped proliferating before 10 passages (Fig. 3A). Thus, the resultant postexpansion cell number differs significantly between these two cell populations: from a starting population of 105 cells, EMPs can be expanded to nearly 1016 cells whereas BMMSCs yield only 108 cells. Cell cycle analyses show that there are a higher fraction of EMPs in S phase than BMMSCs (Fig. 3B). Despite the continued in vitro propagation, the karyotype of EMPs remained normal (Fig. 3C, D). More detailed chromosomal analysis in terms of aCGH also show that neither the derivation of EMPs from hESCs nor passaging of EMPs result in gene copy number aberrations (Fig. 3E).

Growth potential and karyotypic changes of EMPs. (A) Growth curves of EMPs and adult BMMSCs; (B) cell cycle analyses for EMPs and adult BMMSCs; karyotype analyses of EMPs at early (C; third passage) and late passages (D; 15th passage); (E) array comparative genomic hybridization results for hESCs versus derived EMPs.
Unlike ESCs, EMPs are unable to form teratoma or any tumor mass in vivo. We injected NOD-SCID mice with varying passages of EMPs and followed up for tumor growth for 4 months, and no tumor formation was seen (data not shown).
To determine the transcriptome profile of EMPs, we analyzed mRNA expression by performing microarray analysis. Using a dual-color whole human genome oligo microarray, we screened for differentially expressed genes (2.5-fold change) in BMMSCs and hESCs using HSF-6 (see Materials and Methods). In order to compare multiple samples in a more rapid and efficient method, we then custom designed a single-color oligo microarray based on this data set and other published reports of stem cell gene profiling data and commercially available microarrays profiling stem cell markers (23,29,51), from which a list of 11,304 genes was generated. We then analyzed samples of HSF-6, EMPs, and BMMSCs (from two donors) for expression of these 11,304 stem cell-related genes.
Comparison of the gene expression pattern of EMPs showed the highest correlation with BMMSCs and the lowest with hESCs, as shown by scatter plot analysis. The correlation coefficient (CC) between EMPs and BMMSCs is 0.71, whereas between EMPs and hESCs is 0.53 (Fig. 4A and B, respectively). This is in line with previous data in which a CC of 0.72 was found for BMMSCs and CD105+-sorted EMPs, whereas a CC of 0.65 was found for CD24-/CD105+-double sorted EMPs and its parental hESCs (33). Hierarchical clustering also showed that the gene expression profile for EMPs showed more similarity to BMMSCs than hESCs (Fig. 4C), and PCA of the microarray data of EMPs derived from three different methods (33,36) including ours, along with adult BMMSCs and HSF-6 hESCs show that EMPs and BMMSCs are more similar with each other than hESCs (Fig. 4D). We performed qPCR to validate the microarrary findings (Fig. 4E). As expected, the pluripotency genes of OCT-4 and SOX-2 [(sex determining region Y)-box 2] are highly expressed in hESCs; qPCR results are also well correlated with the microarray data for highly expressed genes by both EMPs and BMMSCs, such as TGFBI (transforming growth factor, beta induced) and FN1 (fibronectin 1). In addition, qPCR results are analogous to the microarray data for genes which are discordantly highly expressed by one mesenchymal progenitor over another, such as LGALS1 (lectin, galactoside-binding, soluble, 1) and RPL11 (ribosomal protein 11) for EMPs, and S100A6 (S100 calcium binding protein A6) and HLA-B (human leukocyte antigen-B) for BMMSCs. Moreover, as a control, genes which are minimally expressed for all samples in the microarrray also appear so by qPCR, further confirming validity of the microarray data (data not shown).

Microarray analyses of HSF-6 hESCs, EMPs, and BMMSCs. Scatter plot analyses for (A) EMPs versus BMMSCs and (B) EMPs versus HSF-6 hESCs; (C) principle components analysis for EMPs (three different derivation methods; see Results section), adult BMMSCs, and hESCs (HSF-6, the parental hESCs); and (D) hierarchical clustering of the three cell types (A, HSF-6; B, EMPs; C, BMMSC donor 1; D, BMMSC donor 2). (E) Real-time RT-PCR (qPCR) results for selected genes.
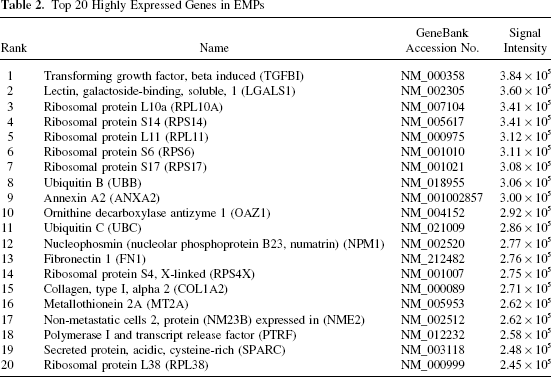
Based on this array, we found that the 20 most highly expressed genes in EMPs (Table 2) include seven ribosome-related proteins, with extracellular matrix (ECM) components and cytoskeletal proteins being the next largest group of genes expressed—including one type of collagen I (COL1A2; collagen type I, alpha 2), one type of fibronectin (FN1), and two associated binding proteins [TGFBI and ANXA2 (annexin A2)]. A number of other binding proteins are highly expressed, include metal-binding proteins [MT2A (metallothionein 2A) and SPARC (secreted protein, acidic, cysteine-rich)] and a galectin binding protein (LGALS1). Other highly expressed proteins including those involved in the cell cycle (OAZ1; ornithine decarboxylase antizyme 1); transcription [NPM1 (nucleophosmin) and PTRF (polymerase I and transcript release factor)]; ubiquitination (UBB and UBC; ubiquitin B and C); and nucleotide biosynthesis (NME2; nonmetastatic cells 2, protein expressed in).
Top 20 Highly Expressed Genes in EMPs
Given the high correlation in gene expression and phenotype between EMPs and BMMSCs, we were interested in profiling the gene expression similarities and differences between the two cell types. By determining the ratio of gene expression between BMMSCs and EMPs, we determined a “core” set of genes that were highly expressed in both mesenchymal populations (Table 3). The top 20 concordantly expressed genes in both BMMSCs and EMPs include two unknown genes, and of the known genes, three are associated with the cytoskeleton, including cytoskeletal binding proteins [TGFBI and DSTN (destrin)] and a transcription factor in cytoskeletal organization (FHL2; four and a half LIM domains 2). Four of the highly expressed genes belong to the insulin-like growth factor binding protein (IGFBP) family [IGFBP7, CYR61 (cysteine-rich, angiogenic inducer, 61), IGFBP-7 precursor protein, and IGFBP3], and another four highly expressed genes are metal-binding proteins (SPARC, ANXA5, ANXA1, and ANXA2-associated protein). An ECM protein—a form of fibronectin (FN1)—was also highly expressed by both cell types. The other highly expressed genes include genes for ribosomal proteins and transcription [PTRF, RPL27A (ribosomal protein L27a)]; cell cycle (OAZ1); ubiquitination (UBC); the nuclear envelope (LMNA; lamin A/ C); and gonadal stromal cell growth (INHBA; inhibin, beta A).
Top 20 Highly Expressed Genes in Both BMMSCs and EMPs

Signal intensity of hEMPs x (average signal of BMMSCs).
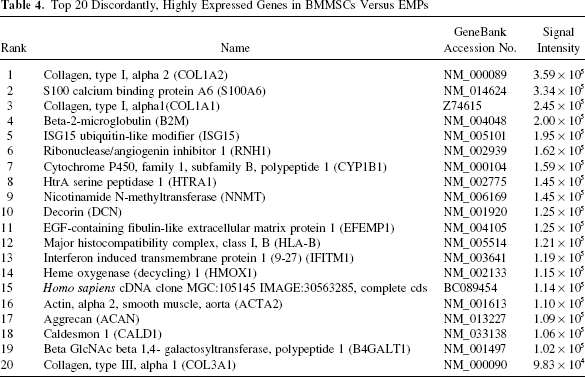
The top 20 highly expressed genes in BMMSCs compared to EMPs include one unknown genes and 19 known genes (Table 4). Of the highly expressed genes, one of the largest categories is related to cytoskeletal processes, including three types of collagen (COLIA2, COLIA1, and COL3A1) and a related protein (CALD1; Caldesmon 1). Also in this subset of genes are three ECM-related genes, including two proteoglycans [DCN (decorin), ACAN (aggrecan)] and one ECM protein (epidermal growth factor containing fibulin-like extracellular matrix protein 1; EFEMP1). The other large category of highly expressed genes is related to immunological function and includes three genes: B2M (β-2-microglobulin), HLA-B, and IFITM1 (interferon-induced transmembrane protein 1). A number of enzymes are highly expressed, including proteases (HTRA1; HtrA serine peptidase 1), metabolic enzymes [CYP1B1 (cytochrome p450, family 1, subfamily B, polypeptide 1) and NNMT (nicotinamide N-methyltransferase)], and an enzyme involved in sugar metabolism (B4GALT1; βGlc NAC beta 1,4-galactosyltransferase). Other highly expressed genes in BMMSCs include proteins involved in the cell cycle (S100A6), ubiquitination (ISG15), iron/ heme metabolism (HMOX1; heme oxygenase 1), and RNAse inhibition (RNH1; ribonuclease inhibitor 1).
Top 20 Discordantly, Highly Expressed Genes in BMMSCs Versus EMPs
Of the top 20 discordantly, highly expressed genes by EMPs compared to BMMSCs (Table 5), over half (11 genes) are also among the top 20 highly expressed genes of EMPs (Table 2). The majority of these genes are ribosomal proteins (12 genes), with the remaining genes being related to various binding proteins [ANXA2, MT2A, TPM1 (tropomyosin 1)] and processes of ubiquitination (UBB, UBA52), transcription (NPM1), and nucleotide biosynthesis (NME2).
Top 20 Discordantly, Highly Expressed Genes in EMPs Versus BMMSCs

In order to determine cellular processes in which the highly expressed genes were involved in, we performed gene ontology analysis. Analysis of highly expressed genes in EMPs but not BMMSCs (Table 6) showed that overrepresented processes are associated with cell proliferation, including DNA replication, cell cycle (specifically mitosis), DNA repair, chromosome condensation, and cell division. In contrast, for BMMSCs, highly expressed genes were overrepresented in immune pathways, including antigen presentation, immune responses, complement activation; other processes also include extracellular matrix organization and cell motility (Table 7). For the subset of BMMSCs and EMPs concordantly expressed genes (Table 8), the main processes were associated with gene expression silencing (including negative regulation of transcription, chromatin silencing, heterochromatin formation, negative regulation of cellular processes), cell adhesion and matrix processes, and muscle development.
Gene Ontology of Discordantly Upregulated (>Twofold) Genes in EMPs

All p < 0.001.
Gene Ontology of Discordantly Upregulated (>Twofold) Genes in BMMSCs

All p < 0.001.
Gene Ontology of Concordantly Upregulated Genes for EMPs and BMMSCs

All p < 0.001.
Discussion
There are continued advances towards the therapeutic use of both embryonic and adult sources of stem cells. However, concerns exist with each source of stem cells, which currently have yet to be circumvented. The new success of reprogramming somatic cells back to pluripotency have resolved the ethical problems in the isolation of pluripotent hESCs from preimplantation blastocysts as well as the immunological issue of rejection, but other concerns remain, including the low efficiency of the process and tumorigenicity of these cells (58). On the other hand, adult BMMSCs can be harvested and used without such concerns, and its immunomodulatory properties allow for third-party use, broadening the therapeutic applicability as seen in the increasing number of clinical trials using these cells (6,52). However, low cell number is a constant problem (37,40). While ex vivo expansion partially solves this issue, there is an invariable onset of senescence along with a continued decline in cell numbers as donor age increases (47,56). Moreover, reports show that differentiation capacity can be compromised during aging (11,63). One solution to these problems is the derivation of mesenchymal stem/ progenitor cells from hESCs. By differentiating hESCs into EMPs, a tissue-specific progenitor/stem cell, there is loss of pluripotency—as seen with the loss of the markers OCT-4 and SOX-2—along with tumorigencity (in terms of teratoma formation). However, the enhanced proliferative potential of its embryonic origin is preserved to some extent, which resolves the problem of low cell numbers usually associated with adult-source MSCs. Previously, the generation of EMPs from hESCs requires differentiation involving complicated cell culture techniques and/or fluorescence-activated cell (FACs) sorting for specific surface markers (2,33,36). However, we have developed a simple and efficient method of isolating EMPs with trypsinization—not an optimal method for hESC passaging because this results in dissociation into single cells—and culturing in BMMSC medium consisting of DMEM-low glucose with 10% FBS. Phenotypically, EMPs resemble adult BMMSCs in terms of differentiation capacity, differentiating easily into the mesenchymal lineages of osteoblasts, adipocytes, and chondrocytes, as well as acquiring neural-like morphology in the presence of retinoic acid and NGF, both potent neurogenic induction agents. With regards to transcriptional profiling, while EMPs are not identical to adult BMMSCs, they are more similar to BMMSCs than their parental hESCs (Fig. 4A, B) regardless of derivation method (33). Moreover, we have been able to derive EMPs from other pluripotent stem cells, including another hESC line as well as induced pluripotent stem cells (data not shown). Thus, our simple method for derivation of EMPs, along with its broad immunosuppressive properties (60)—similar to BMMSCs—may allow these cells to serve as a source for cell therapy.
The surface marker expression profile of EMPs is similar to BMMSCs with the exception of additionally expressing some hESC markers such as SSEA-4 and CD9. Studies have shown that ESC markers can be found in some more primitive populations of BMMSCs (15,38) and fetal-derived progenitors (10,53,61). In addition, the surface expression of the nonclassical MHC I molecule HLA-G on EMPs is of some interest. Unlike other MHC I molecules, HLA-G has minimal polymorphism and can induce immunomodulatory effects, and has historically been thought to be restricted to placental trophoblasts, and in a few adult organ systems [reviewed in Carosella et al. (7)]. Additionally, HLA-G expression has been detected at various stages of embryonic development (25,59). While HLA-G expression is clearly lost in the embryo and increased in trophoblastic tissue as gestation progress, it has been recently shown that in fetal somatic progenitor cells, HLA-G can be detected (45). One theory proposed for this phenomenon is that the HLA-G gene is “reactivated” in specific fetal somatic progenitors as differentiation occurs (35). This may also be the case in our findings of HLA-G expression in EMPs. The expression of this nonclassical MHC class I molecule may be responsible for imparting some of its immunosuppressive effects, but further studies are needed to delineate the specific role of surface HLA-G expression in the unusual context of a mesenchymal progenitor.
Interestingly, BMMSCs but not EMPs highly express a number of immune-related genes and most are MHC class II-related genes, which are key molecules in determination of donor and recipent tissue compatibility (27,34). It is known that in hematopoietic stem cell (HSC) transplantation, the use of cord-blood HSCs results in less immunological reactions than adult bone marrow HSCs (16,54). In addition, a number of studies have shown that BMMSCs upregulate MHC class II much more readily than fetal and embryonic stem cells (9,18,32). Our microarray data, along with the expression of the toleragenic molecule HLA-G and the in vitro immunomodulatory properties of EMPs (60), suggest that this population of progenitor cells may induce less immunologic reaction in therapeutic settings.
The transcriptional profiling of EMPs show that this cell population is more similar to BMMSCs than hESCs, and the majority of genes that are highly expressed by EMPs and BMMSCs are involved in processes associated with mesenchymal cells, including cytoskeletal processes, cell adhesion and matrix processes, and muscle development. Our gene ontology analysis revealed that processes associated with negative gene expression were highly represented in both progenitor cell populations. This may be attributed to the fact that as the differentiation capacity of the stem cell is narrowed down, the wider range of gene expression seen during the stem cell state will be downregulated in comparison to committed somatic cells—in this case, from a more pluripotent ESC to a somatic progenitor (17). While a proportion of highly expressed genes in EMPs are also associated with the cytoskeleton and ECM, these ESC-derived progenitors also highly express genes involved in transcription, DNA repair, and cell proliferation (by gene ontology analysis). This is clearly reflective of EMPs' mesodermal developmental heritage, as well as the greater growth potential without compromising chromosomal integrity compared to adult BMMSCs. Compared to its parental hESC line HSF-6, the gene expression profile of EMPs is very dissimilar, as seen in the low expression of pluripotency genes. As expected, the majority of genes highly expressed in BMMSCs but not EMPs fall into processes involving the cytoskeleton and ECM. Our BMMSC transcriptome results are very much in line with published reports (19,29,46,55), reflecting the fidelity of the more concise microarray that we have designed.
In conclusion, we have found that mesenchymal progenitors can be derived from existing hESC lines by a simple method of repeat trypsinization and culturing in BMMSC medium. These EMPs possess similar multilineage differentiation capacity, but have enhanced proliferative properties compared to adult BMMSCs without inducing teratoma formation in immunocompromised mice. Using a more concisely designed gene expression microarray, transcriptome profiling of EMPs in comparison with BMMSCs show that genes related to cytoskeletal and ECM-related process are highly expressed by both cell types. Higher expression of genes related to transcriptional and proliferative processes is seen in EMPs whereas BMMSCs show higher expression of immune-related genes. Our data suggest that EMPs are an easily obtainable mesenchymal progenitor cell source with possible therapeutic applicability.
Footnotes
Acknowledgments
We thank Dr. B. Linju Yen for her valuable discussion and critical review of the manuscript. This study was funded by the grants NSC 97-2314-B-002-060-MY3 (to M. L. Yen and M. L. Kuo) and NSC 99-3111-B-002-005 (to M. L. Yen) from the National Science Council of Taiwan. The authors declare no conflict of interest.