
Abstract
The ability to consistently and reliably assess the total number and the size distribution of isolated pancreatic islet cells from a small sample is of crucial relevance for the adequate characterization of islet cell preparations used for research or transplantation purposes. Here, data from a large number of isolations were used to establish a continuous probability density function describing the size distribution of human pancreatic islets. This function was then used to generate a polymeric microsphere mixture with a composition resembling those of isolated islets, which, in turn, was used to quantitatively assess the accuracy, reliability, and operator-dependent variability of the currently utilized manual standard procedure of quantification of islet cell preparation. Furthermore, on the basis of the best fit probability density function, which corresponds to a Weibull distribution, a slightly modified scale of islet equivalent number (IEQ) conversion factors is proposed that incorporates the size distribution of islets and accounts for the decreasing probability of finding larger islets within each size group. Compared to the current calculation method, these factors introduce a 4–8% downward correction of the total IEQ estimate, but they reflect a statistically more accurate contribution of differently sized islets.
Keywords
Introduction
Type 1 diabetes mellitus (insulin-dependent or juvenile-onset diabetes) is an autoimmune disease resulting in the destruction of the insulin-producing β-cells of pancreatic islets. It requires continuous glucose monitoring and exogenous insulin treatment to maintain glucose homeostasis. Unfortunately, even with careful treatment, chronic and degenerative complications, such as retinopathy, nephropathy, neuropathy, atherosclerosis, and lipid disorders, still occur in a considerable fraction of patients due to the metabolic abnormalities associated with diabetes. The transplantation of pancreatic islet cells can normalize metabolic control in a way that has been virtually impossible to achieve with exogenous insulin. This experimental type 1 diabetes therapy is being explored in a selected cohort of patients with either increased hypoglycemia unawareness or as a concurrent intervention with whole organ replacement therapies necessitated by secondary complications (renal failure, nephropathy) (6,27). Because of the life-long immunosuppression required, it is currently limited to the most severe forms of diabetes, and, in the US, is conducted at several centers under an IND (Investigational New Drug) application. Due to improved islet preparation techniques and the availability of more effective immunosuppressive regimens (21), such as those of the Edmonton protocol (30), results have been improving continuously in the last decade (6,27) and approaches for further improvements are being continuously explored (22).
Islet transplantation inevitably requires the isolation of islets as a first step, and current methods used in human islet cell processing rely on an automated method introduced in 1986 that has essentially replaced all previously used procedures (26). During this process, the pancreas is progressively disassembled after injection of an enzyme blend through the pancreatic duct, allowing its gradual digestion into fragments of decreasing size until cell clusters of the volume range of islets are released. Several qualitative and quantitative tests are used to verify the quality of the final human islet cell product (13). For example, pretransplant criteria that must be met include the determination of the total islet cell number (>5,000 islet equivalents/kg recipient body weight), total pellet volume of the final preparation (<7 ml of tissue), islet cell purity (>30% islets), and viability (>70%). Hence, the ability to consistently and reliably assess the number and size of isolated pancreatic islet cells is of crucial relevance for the adequate characterization of islet cell preparations used for research or transplantation purposes.
Pancreatic islets contain the endocrine cells of the pancreas (α, β, γ, and PP-cells), whose main role is to secrete hormones that regulate blood glucose levels. A healthy human pancreas contains, on average, around 1 million islets (22), and human islets have several unique properties compared to rodent or porcine islets (4,31). Islets are structurally well-defined spheroid-like cell aggregates of about 1,500–2,000 cells with diameters (d) ranging in size from <50 μm up to 500 μm (d = 150 μm considered as representative) (20,25). The size frequency distribution of pancreatic islets has been assessed in various animals (1,5,7,9,16,17,20,32,33) as well as in humans (8,11,19), and it is well recognized that, in all species, most islets have smaller diameters (around 50 μm), but the bulk of the volume is being contributed by larger (d = 100–200 μm) islets. The exact size distribution has been studied in a few cases, and it is clear that it is a skewed distribution best described by a log-normal (7–9,17) or a Weibull distribution (9,11) such as that shown in Figure 1.
The number (N, continuous blue line) and volume (V, dashed red line) density of human islets as a function of diameter (d) as estimated here by the probability density function of Equation 1 corresponding to a Weibull distribution.
Because islet isolations in humans and larger mammals yield preparations that are too large for direct counting, various methods are used for their quantitative assessment, and it is of obvious interest to have accurate, reproducible, and comparable procedures. In islet isolation and transplantation-related work, following the consensus report of 1990 (25), it is now standard practice (14) to express the total volume of isolated islets in islet equivalent (IEQ) numbers (i.e., the number of “standard” islets of diameter d = 150 μm that would have the same total volume). In the assessment of islet preparations, it is also standard practice to take a small (e.g., 100 μl) sample from a gently but well-mixed islet suspension, stain the islets red with zinc-binding diphenylthiocarbazone (dithizone, DTZ) solution, and then manually count them using a light microscope with an ocular micrometer by following a classic international procedure (CIP). According to this, all islets with diameters ≥50 μm are classified into classes of 50-μm increments (i.e., 50–100, 101–150, 151–200,& 351–400, >400 μm) and counted as such, and then, for each class, the number of corresponding IEQs is calculated by multiplying the islet counts with a conversion factor based on the mean volume of that class (14).
The purpose of the present study was (i) to assess the standard current manual procedure used for the quantification of islet cell preparations and to quantitatively evaluate its accuracy in reproducing the composition of the original sample, (ii) to evaluate the influence of the sampling technique used and the variability due to operator differences, and (iii) to introduce a slightly modified scale of IEQ conversion factors that accounts for the decreasing probability of finding large islets. Toward these aims, a continuous probability density function was first established that can give an adequate description of the size distribution of isolated human pancreatic islets and, then, it was used to prepare a polymeric microsphere mixture with a composition closely resembling those of isolated islets.
Materials and Methods
Microsphere Mixture
Red ChromoSphere polymer microspheres made of polystyrene divinylbenzene (PSDVB) with a density of 1.06 g/cm3 were obtained from ThermoFisher Scientific/Microgenics (Fremont, CA) in seven different sizes with nominal diameters of 50, 100, 150, 200, 300, 400, and 500 μm (actual diameters given by the manufacturer being 49 ± 3.8, 93 ± 8.0, 149 ± 8.9, 202 ± 9.5, 301 ± 9.9, 402 ± 18.1, and 500 ± 24.0 μm). They were weighted according to their calculated proportions (see below) using a Zerostat antistatic gun (Sigma Aldrich, St. Louis, MO) to reduce problems caused by electrostatic charges and suspended in aqueous media with the aid of a small amount of ethanol. This mixture of known composition resembling those of isolated human islets was suspended in standard islet culture media and used to assess the accuracy and reproducibility of the quantification process. Trained operators (technicians) from the Human Islet Cell Processing Facility at the Diabetes Research Institute (University of Miami Miller School of Medicine) withdrew samples of 50 or 100 μl from 100 ml of well-mixed suspension with a fixed volume microdispensor pipette, placed them on 10 × 35-mm counting dishes, and then counted them manually using a light microscope with an ocular micrometer at 40x total magnification following standard protocol. All samplings were performed in duplicate. Because microspheres were available only in sizes that correspond exactly to the limits of the standard groups used for islet counting (e.g., d = 50, 100, 150, 200 μm), there could be some ambiguity as to what group should they be assigned. They seem to have been “counted-up” (i.e., counted as belonging to the larger group) by most operators; therefore, they were considered as such in all cases here. However, to avoid seriously overestimating their volume (IEQ) contribution, IEQs were calculated using their actual volume and not the size group average (CIEQ). An automated counting method using a LabView (Laboratory Virtual Instrumentation Engineering Workbench; a graphical programming environment available from National Instruments, Austin, TX) based software and a dedicated instrument (Islet Counter Model ICC-01) that is being developed by BioRep Technologies (Miami, FL) was also used for counting after a brief calibration confirming that it correctly detected the red microspheres (camera pixel size: 6.7 μm). Media densities were determined using a DMA 35N (Anton Paar GmbH, Ostfildern, Germany) density meter.
Islets
Islet counts from more than 200 human isolations performed at the Human Islet Cell Processing Facility at the Diabetes Research Institute (University of Miami, Miller School of Medicine) between 2006 and 2009 were retrospectively utilized to obtain an average frequency distribution (i.e., fractional composition) per islet size group. Human pancreases were from deceased multiorgan donors for which consent for transplantation was obtained by accredited Organ Procurement Organizations from the donor family or next of kin. Islets were isolated by using a modification of the automated method (26) with different lots of collagenase and a standard purification step as described previously (13,24,26). Only data from isolations with a total number count of at least 150 and estimated IEQ of at least 200K were used to calculate fractional compositions, leaving n = 113 for prepurification (pre-Ficoll) and n = 56 for high purity layer data.
Mathematical Models
The size distribution of islet numbers was assumed to follow a Weibull distribution (35), a flexible probability density function often used in survival and failure analysis and various other applications (10), which is also known as Rosin-Rammler distribution (29) for particle size. The corresponding probability density function is:
In other words, islet size (i.e., islet diameter d) was assumed to be a random variable X with a continuous distribution characterized by the probability density function f(x) of Equation 1 with the usual definition (10,28) that the probability of X being in the interval x1 < X ≤ x2 is given by the corresponding integral (i.e., area under the curve):


Average Fractional Composition (FC) of Isolated Human Islets Together With the Estimated Probabilities (P) of Finding an Islet in the Corresponding Size Group as Calculated From the Optimized Probability Density Function of Equation 1

Renormalized to account for not counting islets smaller than 50 μm. The parameters of the probability density function f describing islet size distribution were optimized so as to give the best possible fit between PN, renorm and the FC values for the prepurification and high purity layer values.


Frequency distribution of the number (top) and volume (bottom) of islets per standard size groups obtained with the probability density function used here (Eq. 1), which is also shown as an overlap to illustrate the correspondence between the calculated fractions (frequencies) and the areas under the curves (AUC) calculated by the integral of Equation 4.
This was also fitted with a procedure identical to the one used for Equation 1 resulting in μ = 4.6, σ = 0.56 and giving a slightly worse fit as judged from the SSE values; hence, the best fit Weibull function (κ = 1.5, λ = 105) was used in all further calculations. It was used to calculate the composition of the microsphere mixture to be similar to that of human islets by using its values at the actual diameters of the microspheres (49, 93, 149, 202, 301, 402, and 500 μm) and then renormalizing the composition to 100%. Finally, to calculate islet volume conversion factors CIEQ that take into account the size distribution of islets, the expected value of the volume within each size group, which represents a probability-weighted average, was also calculated using the optimized probability density function of Equation 1. The expectation value of an arbitrary function g(X) of the random variable X with a probability distribution characterized by the probability density function f(x) is then given by the inner product of f and g (28):

In other words, the expected value is a weighted average where the values that the function can take are weighted by the probability with which they occur. Here, this definition was used to calculate the proposed IEQ correction factors CIEQ given in Table 1 as probability weighted expected values of spherical volumes, g(x) = Vsphere = πx3/6, normalized to standard islet equivalent (IEQ) volumes (dIEQ = 150 μm, VIEQ = 1.77 × 106 μm3):

All corresponding calculations were performed using numerical estimates in Excel 2007 (Microsoft, Seattle, WA). The coefficient of variability (CV) was calculated as customary, the ratio between standard deviation and mean: CV(%) = σ/μ.
Results
Size Distribution of Isolated Human Islets
Islet counts from more than 200 human isolations performed at the Human Islet Cell Processing Facility at the Diabetes Research Institute (University of Miami, Miller School of Medicine) between 2006 and 2009 with a standard automated method (13,24,26) were used to obtain an average frequency distribution (fractional composition, FC) per islet size group. Only data from isolations with a total number count of at least 150 and estimated IEQ of at least 200K were used to calculate fractional compositions for the prepurification (pre-Ficoll) and high purity layer islets; values are shown in Table 1. The average frequency distribution was not very sensitive to the filtering criteria; they were quite stable at all conditions even for relatively low-quality islets and/or isolations.
To obtain a continuous function describing the size distribution of islets, their number density, N(d)/N, was assumed to follow a random distribution as described by a Weibull-type probability density function (Eq. 1) (10), the parameters of which (κ, λ) were optimized so as to obtain the best possible fit between the calculated fractional composition per standard islet size groups from this function, P N , and the experimental FC averages obtained for human islets (Table 1) as described in detail in Materials and Methods. Best fit was obtained with κ = 1.5 and λ = 105, resulting in probability distributions for the number and volume (IEQ) of human islets as shown in Figure 1 with the corresponding calculated fractional contributions per size groups shown in Table 1 and Figure 2. A log-normal density function (Eq. 5) (10) was also fitted with very similar results and a slightly less good fit (SSE of 1.26 × 10⁻³ vs. 0.99 × 10⁻³); the Weibull distribution was used in all further calculations.
Accuracy and Variability Assessment
To quantitatively assess the accuracy of the currently used standard quantification process for islet cell preparations, first a polymeric microsphere mixture of known composition with a size distribution closely resembling those of isolated human islets was prepared as described in Materials and Methods. It was then used to assess how closely its total IEQ content and fractional composition is reproduced by different human operators following standard counting procedure. The final fractional composition of the microsphere mixture is shown in Figure 3, and as illustrated by Figure 4 and Figure 5, it is indeed an acceptably realistic reproduction of isolated human islets used in counting procedures.
Fractional composition of polymeric microsphere mixture prepared to resemble those of isolated human islets and used to assess the accuracy and reproducibility of the standard manual process used for quantification of islet preparations. Illustrative sample images of polymeric microspheres (left) and human islets (right) used for counting. Frequency distribution of the number (top) and volume (bottom) of the present polymeric microsphere mixture (“beads”) compared to those of average human islet preparations. Islet data shown are average ± SEM of 113 (prepurification, Pre) and 56 (high purity layer, L1) isolations for which the total number count was at least 150 and the final IEQ estimate was at least 200K. Note that the microspheres, which have diameters corresponding to the separations values, were considered as “counted up” (i.e., as belonging to the larger size group because they were counted as such by most operators). However, their IEQ contributions were calculated using their exact volume and not the average of the size group to avoid overestimates.


This mixture, at a total count of approximately 300K IEQ, was then used to evaluate and compare three different sampling methods: 1) the standard method consisting of a 100-μl sample withdrawn from 100 ml of well-mixed suspension as soon as possible (representing a 1: 1000 sample), 2) a reduced sample consisting of a 50-μl sample withdrawn from 100 ml of well-mixed suspension as soon as possible (representing a 1:2000 sample), and 3) a delayed sample consisting of a 100-μl sample withdrawn from 100 ml of well-mixed suspension but after a 45-s delay. All samples were taken in duplicate and counted following our current standard operating procedure (SOP) by each operator (n = 6). An automated counting method using software and a dedicated microscopic instrument (Islet Counter ICC-01) that is being developed by BioRep Technologies (Miami, FL) was also evaluated with the same conditions.
The standard method (100 μl, 1:1000 sample) somewhat underestimated the total number of “islets” (microspheres) present, 448 ± 37K vs. 552K, while giving, on average, very good reproductions of both the fractional composition and the total IEQ content (total IEQ of 288 ± 91K vs. 315K) as shown in Figure 6 and Figure 7. With this method, the reproducibility of islet number counting also seems acceptable with a total coefficient of variability of CV = 8.3% (n = 14 different samples). However, because a relatively low number of larger islets (d > 250 μm) still contribute a significant portion of the total IEQ content (Figs. 6 and 7), the variability in the IEQ estimate is larger, resulting in CV = 31.6%, which further emphasizes the need for accurate counting and conversion factors in these size groups as well as for the use of multiple averaged counts. As expected, the use of a smaller sampling volume (50 μl; representing a lower, 1:2000 sampling ratio) gave less reliable estimates and much larger variability. CVs increased to 16.3% for islet number and 34% for IEQ, with the total IEQ estimate also being erroneous (215 ± 73K vs. 315K) as this volume is probably too small to aspirate a representative “islet” number. Results with the delayed sampling confirmed the importance of thorough mixing followed by quick sample taking as larger islets settle relatively fast. This sample did not correctly reflect either the fractional composition or the correct IEQ content of the mixture as it was lacking essentially all larger “islets” (Fig. 7). Hence, it resulted not only in large variability (CV of 18.6% for number and 68% for IEQ), but also in an erroneous IEQ estimate (171 ± 116K vs. 315K) despite the 100-μl sample that otherwise seems adequate.
Reproducibility of the numeric (top) and volume (bottom) fractional composition of the islet-like microsphere mixture by the standard manual quantification (100-μl sample from a 100-ml well-mixed suspension representing a 1:1000 sampling ratio) process by six different trained operators (P01–P06) and a microscopic image-based software (BRs). Accuracy of the assessment of the numeric (top) and volume (bottom) fractional composition of the islet-like microsphere mixture by the manual quantification procedures using a standard sample (100 μl, 1:1000), a reduced sample (50 μl, 1:2000), and a delayed sample (100 μl, 1: 1000, 45 s after mixing). Data shown are average ± SD for all counts by all operators.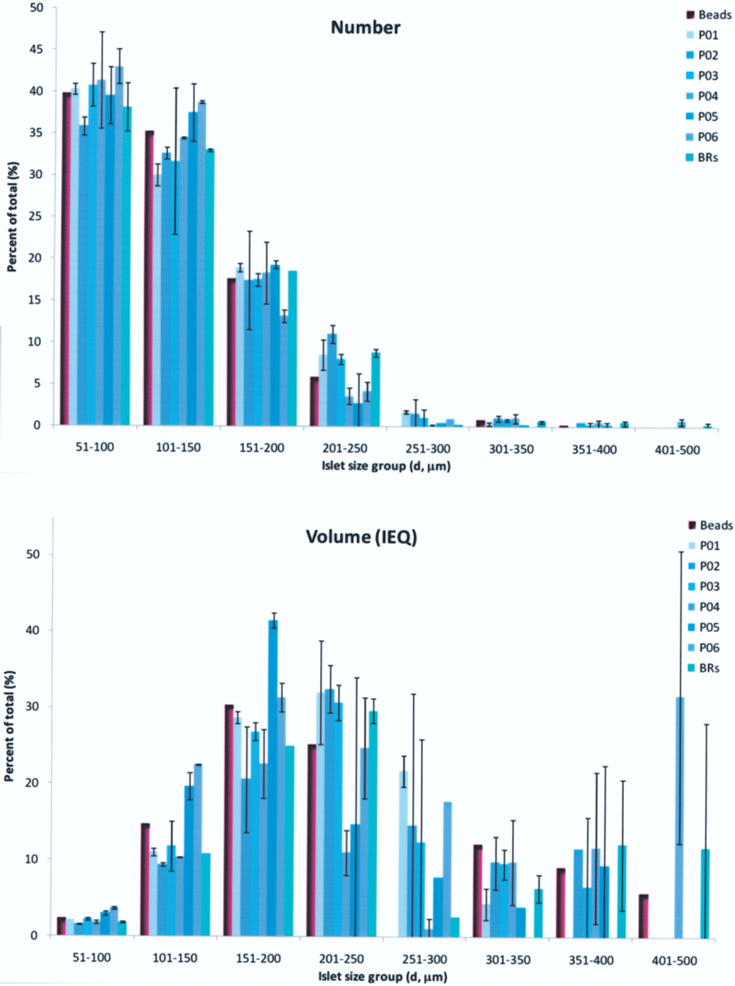

IEQ Conversion Factors
Currently Used and Proposed IEQ Conversion Factors CIEQ per Standard Islet Size Groups

Discussion
The main goal of the present work was to quantitatively assess the accuracy of the process used to quantify islet cell preparations. However, as a first step toward this goal, a continuous function describing the size distribution of islets had to be established. On the basis of previous works (9,11) and its slightly better fit for the present data, we selected a Weibull distribution function (Eq. 1). Its overall shape (Figs. 1 and 2) is very similar to that of a log-normal distribution (Eq. 5) having slightly different tails. Therefore, all conclusions should be similar with an adequately fitted log-normal distribution as well. The quality of the existing data does not allow for clear distinction between the two distribution functions. Such skewed distribution functions seem adequate and have been used to describe the size distribution of pancreatic islets (8,9,11,17) or even thyroid follicles (23). Recently, some theoretical support for a Weibull (or log-normal) distribution has been provided as it can be obtained by assuming a growth dynamics with independent (or coherent) replication of each cell within the islets (9). The best fit Weibull function obtained here (Eq. 1, κ = 1.5, λ = 105) can give a good description of the frequency distribution (fractional composition) of isolated human islets as calculated per the standard size groups (i.e., compare the experimental FC and theoretically calculated PN columns of Table 1). With this function, the expected value (Eq. 6) of islet diameter is 95 μm, whereas the expected value of islet volume is around 1.2 × 106 μm3 (0.7 IEQ) corresponding to that of an islet with d = 133 μm.
Overall, our data suggest a slightly heavier tail (i.e., a somewhat higher proportion of larger islets and a somewhat less abrupt decrease with increasing size) than in most previous fits for rodents (9,17) or even humans (8,11), which is more readily noticeable in the volume (IEQ) composition. Large islets (d > 250 μm) still contribute a significant portion of the total volume (IEQ) content (>25%; Fig. 5, Table 1). It is possible that the isolation process disrupts somewhat the composition of islets in their native state, resulting in somewhat smaller, more fragmented islets. Hence, native islets might exhibit an even higher volume contribution from larger islets (20). Improvements in the isolation process may also account for the slight increase in the presence of larger islets compared to historical results. The frequency distributions (FC fractional compositions) of our islet isolations are quite consistent, even in lower quality isolations or islets. Interestingly, however, the Edmonton group seems to have obtained a considerably larger fraction of the smallest counted islets (50 μm < d < 100 μm): ~75%, as published recently (19), compared to ~45% here. However, the heavier tail at larger sizes seems to be present in their data as well.
Microspheres are an obvious choice as islet substitute (34). On the basis of the estimated size distribution, we prepared a polymer microsphere mixture that can give a good reproduction of human islets as it has a very similar size frequency distribution (Figs. 4 and 5) and even a density (ρ = 1.06 kg/L) close to that of actual islets (ρ ≍ 1.10 kg/L). This was then used to assess the accuracy and variability of the currently used standard manual quantification process for islet cell preparations. Correctly assessing not only the total IEQ content, but also the fractional composition of islet cell preparations is of considerable relevance as the proportion of smaller or larger islets present may have important consequences influencing the effectiveness of research or clinical transplantations. For example, there have been suggestions that smaller islets could provide better results (15,18) possibly because nutrient [and, in particular, oxygen (2)] delivery limitations are less severe during the first few days while the transplanted islets are still avascular and have to rely on gradient-driven passive diffusion, and they might also revascularize better (12). The standard method (100 μl, 1:1000 sample) seems to give a relatively reliable estimate of the composition and IEQ content of the islet preparation as it reproduced well those of the microsphere mixture used in the assessment, and it did so with an acceptable interoperator variability, especially considering that the interoperator variability of manually counting the same (photographic) sample has been estimated to be around 15% (14). Results also confirmed the need for a sample volume no smaller than 100 μl and the need for thorough mixing and quick sample withdrawal as larger islets settle relatively quickly. We used a somewhat long delay before sampling here (45 s) to have a somewhat more pronounced effect, mainly because even if the microspheres have a density relatively similar to those of actual islets, in the media used they still settle somewhat slower as the media density (ρ ≍ 1.009 kg/L) is also close to these values. Counting with microscopic image-based software gave quick, reproducible microspheres counts; it gave almost identical counts of the same sample remixed in the counting dish, which is unlikely to be the case with human operators, where the intraoperator variability when recounting the same (photographic) sample seems to have a CV around 10% (14). Most of the variability present in Figure 6 for the corresponding columns is due to the fact that counts are for two different samples that obviously contained slightly different “islet” numbers. Hence, if the accurate recognition of stained islet tissue can be achieved, such methods could give improved assessment of IEQ composition and could also avoid the need for the use of size categorization and for the use of averaged IEQ contributions.
Islets are spheroid aggregates; hence, as a first approximation, they can be considered as spheres. Thus, their volume increases with the third power of the (average) diameter, Vsphere = πd3/6, and one IEQ (calculated with d = 150 μm) corresponds to a volume of VIEQ = 1.77 × 10⁻¹² m3 × 1.77 × 106 μm3. Because of the strong dependence of volume on linear size, manual counting using size categorization involves considerable rounding errors. As noted above, the use of computerized image analysis based automated methods such as those based on areal density measurement (16) could provide a more objective quantitative evaluation, but manual techniques are still widely used. Because of a relatively large volume contribution in human isolations seems to come from a relatively small number of larger islets (IEQ > 25–30% for islets with d > 250 μm that represent only about 5% of the total number count), their IEQ contribution has to be assessed especially carefully, which further emphasizes the need for multiple averaged counts as well as for accurate CIEQ conversion factors. Here, we proposed a slightly corrected set of such factors that were calculated as a weighted average of the volumes in each size group on the basis of the estimated probability distribution function of human islets.
Currently used conversion factors are calculated as an average volume within each size group. This assumption tends to overestimate the IEQ contributions of each group, as within each group, most islets will cluster around the lower size due to the rapidly decreasing likelihood of finding larger islets. A look at the 251–300 μm class as an example can provide a quantitative illustration: individual islets within this category can contribute IEQs ranging from 4.63 at the lower end (d = 250 μm) up to 8.00 at the upper end (d = 300 μm), but with the existing standard procedure, they all will be counted as an average of 6.315 IEQ. However, according to the estimated density function (Fig. 1) the probability of finding a d = 300 μm islet is about threefold less than that of finding a d = 250 μm islet; therefore, islets counted in this class are much more likely to be closer to d = 250 μm than to d = 300 μm. Hence, by using the plain arithmetic mean, the average contribution will be, on average, overestimated. To obtain a statistically more accurate estimate, a slightly lower mean contribution (conversion factor) should be used. The corrected value proposed here (5.96 IEQ, Table 2) is calculated on the basis of a probability density function fitted on a large number of human islet preparations. Obviously, the exact value depends somewhat on the correct probability density function f, which can only be estimated from the existing data; nevertheless, it clearly has a quickly decreasing tail for larger islets, so the corrections are good first estimates regardless of the exact nature of the f used. Changes in the conversion factors are relatively small (Table 2). With the proposed factors, overall IEQ estimate are corrected downward with an average of about 4–8% depending on whether d > 400 μm islets are counted or not; they probably reflect a more accurate contribution for larger islets that can still contribute an important fraction of the total IEQ. Introduction of fully automated counting methods should eliminate the need for such group-based average rounding factors, but quick manual counts are still likely to be used in many settings.
In conclusion, the size distribution of isolated human islets is well described by a Weibull distribution function with larger islets (d > 250 μm) still giving a considerable fraction (>25%) of the total IEQ content despite their low numbers (≍5%). The polymer microsphere (bead) mixture described here seems to give a good quantitative reproduction of human islet size distribution and can be useful in various testing processes as an adequate substitute of islet cell preparations. Its use here suggests that the current standard method used to quantify islet preparations (manual count of a 100-μl sample from 100 ml of freshly mixed suspension representing a 1:1000 ratio) gives an acceptable reproduction of the IEQ content and frequency distribution. A slightly modified scale of IEQ conversion factors that accounts for the decreasing probability of finding larger islets within each size group has been proposed; it results in a 4–8% downward correction of the total IEQ estimate, but it represents a statistically more accurate description of the volume contribution of differently sized islets.
Footnotes
Acknowledgments
Financial support by the Diabetes Research Institute Foundation (www.diabetesresearch.org) is gratefully acknowledged.