
Abstract
We investigated the hibernation effect of epigallocatechin-3-O-gallate (EGCG) on neonatal human tarsal fibroblasts (nHTFs) by analyzing the expression of cell cycle-related genes. EGCG application to culture media moderately inhibited the growth of nHTFs, and the removal of EGCG from culture media led to complete recovery of cell growth. EGCG resulted in a slight decrease in the cell population of the S and G2/M phases of cell cycle with concomitant increase in that of the G0/G1 phase, but this cell cycle profile was restored to the initial level after EGCG removal. The expression of cyclin D1 (CCND1), CCNE2, CCN-dependent kinase 6 (CDK6), and CDK2 was restored, whereas that of CCNA, CCNB1, and CDK1 was irreversibly attenuated. The expression of a substantial number of genes analyzed by cDNA microarray was affected by EGCG application, and these affected expression levels were restored to the normal levels after EGCG removal. We also found the incorporation of FITC-EGCG into the cytosol of nHTFs and its further nuclear translocation, which might lead to the regulation of the exogenous signals directed to genes for cellular responses including proliferation and cell cycle progression. These results suggest that EGCG temporarily affects not only genes related to the cell cycle but also various other cellular functions.
Introduction
Green tea polyphenols are well known as phytochemicals with various bioactivities (16,27,32). Among them, (–)-epigallocatechin-3-O-gallate (EGCG), the major polyphenolic constituent of green tea, has anticancer (19), antimutagenic (18), and antimicrobial (31) actions. Recently, EGCG has been reported to have different effects on proliferation between cancer and normal cells, that is, a cytotoxic effect on various cancer cells, but a hibernation effect on normal cells (2). Hyon and his colleagues discovered that EGCG induced cellular hibernation with high cell survival rates after preservation (6,7,9,13,17). EGCG is thought to increase the survival of normal cells through inhibiting apoptosis by scavenging free radicals harmful to the cells and protecting the fragile cell membrane by simply adhering to and reinforcing it (1), but the exact mechanisms have not yet been fully elucidated.
We hypothesized that this hibernation effect of EGCG on normal cells is partly due to a temporary arrest of the cell cycle. We examined the effects of EGCG on the expression of cell cycle-related genes and proteins. We used cDNA microarray to examine the influence of EGCG on the expression levels of human genes, and the data supported the hypothesis. The reversible effect of EGCG on the expression levels of a significant number of genes suggests that there is a potential recovery of physiological functions and structural elements both essential for tissue and cell preservation.
Materials and Methods
Cell Culture
Neonatal human tarsal fibroblasts (nHTFs) were obtained from a human little toe of a single 1-year-old male polydactyl patient. After isolated according to established procedures (24), the cells were cultured in Dulbecco's modified Eagle's medium (DMEM, Sigma, St. Louis, MO) supplemented with 10% fetal bovine serum (Sigma) and a 1% antibiotic antimycotic solution (10,000 U/ml penicillin G, 10 mg/ml streptomycin sulfate, and 25 μg/ml amphotericin B, Sigma) at 37°C in a humidified chamber with 5% CO2 in air.
EGCG Treatment
EGCG was purchased from DSM Nutritional Products Ltd. (Teavigo™, Basel, Switzerland). To examine the effects of EGCG on the growth and cell cycle of nHTFs, the cells were seeded on well plates and incubated with 100 μg/ml EGCG. Then, 20 μg/ml catalase (Wako Pure Chemical Industries, Ltd., Osaka, Japan) was added to the EGCG-treated cells to decrease cytotoxicity induced by H2O2 generating from EGCG (30). Toxic concentrations of the EGCG and catalase were determined from cytotoxicity tests (data not shown). Cells were treated with different methods of EGCG applicaton: in treatment 1 (Tr1), cells were incubated with 100 μg/ml EGCG for 1 day; in treatment 2 (Tr2), cells were incubated with 100 μg/ml for 3 days; in treatment 3 (Tr3), cells were incubated with 100 μg/ml for 9 days; in treatment 4 (Tr4), cells were incubated with 100 μg/ml for 1 day, washed five times with phosphate-buffered saline (PBS, pH 7.4), followed by replacement with fresh media and then incubated for additional 2 days; in treatment 5 (Tr5), cells were incubated with 100 μg/ml for 1 day, washed five times with PBS followed by replacement with fresh media, and then incubated for additional 8 days. As the nontreated control, cells were incubated without any treatment (Tr0).
Cell Growth Assay
nHTF (2.0 × 10³ cells/ml) was seeded on 24-well plates with or without EGCG treatment. EGCG-treated cells with (Tr1-Tr5) were incubated at 37°C for several time durations. The number of viable cells was quantified by an indirect colorimetric method (Cell Counting Kit-8, Dojindo Lab., Kumamoto, Japan), which determines the number of viable cells according to the amount of reduced electron mediators that is proportional to the degree of cell proliferation (11). Briefly, cells were incubated with a tetrazolium salt for 4 h at 37°C in the dark and washed twice with PBS. The resulting color intensity was measured by a microplate reader (VersaMax™, Molecular Devices Co., Sunnyvale, CA).
Cell Cycle Analysis
Following EGCG treatment (Tr1-Tr5), nHTFs were trypsinized, collected, and washed with cold PBS (pH 7.2). The cells were resuspended in 95% cold methanol for 1 h at 4°C and then centrifuged at 120 × g for 5 min. The pellets were washed twice with cold PBS and incubated with RNase in PBS (20 U/ml, final concentration, Sigma) at 37°C for 30 min. Then, the cells were chilled on ice for 10 min and stained with 100 μg/ml propidium iodide (PI, Sigma) for 1 h. No less than 10,000 cells were counted through a fluorescence-activated cell sorter (FACSCan™ System, BD Biosciences, San Jose, CA), and the data obtained were analyzed using the histogram of CellQuest© software on FACScan (BD Biosciences).
Confocal Laser Scanning Microscopy
To demonstrate whether EGCG was incorporated into the cytosol of nHTFs with further nuclear translocation, it was conjugated with fluorescein-4-isothiocyanate (FITC, Dojindo Lab.) by using a modified labeling method (unpublished data). The cells were cultured with 50 μg/ml FITC-conjugated EGCG treatment for 24 h and then washed thoroughly with PBS. After FITC-EGCG treatment, the cells were fixed with 3.5% paraformaldehyde in 0.1 M phosphate buffer (pH 7) for 5 min at room temperature, and immediately observed under a confocal laser scanning microscope (LSM 510, Carl Zeiss Advanced Imaging Microscopy, Jena, Germany). Cell nuclei were counterstained with 5 μM PI (Sigma) directly before 3–5 min of observation.
Western Blotting
After EGCG treatment (Tr1-Tr5), nHTFs were washed twice with cold PBS (10 mM, pH 7.4). Ice-cold RIPA lysis buffer (Santa Cruz Biotechnology Inc., Santa Cruz, CA) was added to the cells. After 5 min, the cells were scraped, and the lysate was centrifuged at 14,000 × g for 20 min at 4°C. Proteins were extracted from the total lysate, protein concentration was determined by a BCA™ protein assay using the manufacturer's protocol (Pierce, Rockford, IL). For immunoblot analysis, 35–40 μg of protein was run on 4/20 polyacrylamide-SDS gel (Daiichi Pure Chemicals Co., Ltd., Tokyo, Japan) for 1 h at 30 mA and blotted to a PVDF membrane for 50 min at 35 mA. The membrane was blocked in a blocking buffer (Nacalai Tesque, Inc., Kyoto, Japan) for 1 h at RT and incubated with mouse anti-human cyclin A (CCNA) monoclonal antibody, mouse anti-human CCNB1 monoclonal antibody, mouse anti-human CCND1 monoclonal antibody (BD Biosciences), rabbit anti-human CCNE2 monoclonal antibody (Cell Signaling Technology, Inc., Danvers, MA), and, as references, mouse anti-human glyceraldehyde-3-phosphate dehydrogenase (GAPDH) monoclonal antibody (International Inc., Temecula, CA) or rabbit anti-human β-actin polyclonal antibody (Novus Biologicals, Inc., Littleton, CO). The membrane was treated with either an anti-mouse IgG secondary antibody (Amersham Biosciences, Buckinghamshire, England) or anti-rabbit IgG secondary antibody (Santa Cruz Biotechnology Inc.), HRP conjugated. Protein expression was detected by a Chemilumi-one chemiluminescent kit (Nacalai Tesque) and detected by an X-ray film (Fujifilm, Tokyo, Japan).
Reverse Transcription-Polymerase Chain Reaction (RT-PCR)
After EGCG treatment (Tr1-Tr5), total cellular RNA was isolated from nHTFs using an RNeasy Mini kit (Qiagen Inc., Valencia, CA) according to the manufacturer's protocol. The quality of the isolated RNA was evaluated by measuring the absorbance ratio of 260 to 280 nm. The RNA was reverse transcribed and amplified with gene-specific primers using a OneStep RT-PCR Kit (Qiagen). The primer sequences were as follows: 5′-AGCTGCCTTTCATTTAGCACTCTAC-3′ (sense), 5′-TTAAGACTTTCCAGGGTATATCCAGTC-3′ (antisense) for CCNA2; 5′-CATGGCGCTCCGAGTCA-3′ (sense), 5′-GCGCCTGCCATGTTGATC-3′ (antisense) for CCNB1; 5′-GAGACCATCCCCCTGACGGC-3′ (sense), 5′-TCTTCCTCCTCCTCGGCGGC-3′ (antisense) for CCND1; 5′-TGTTGGCCACCTGTATTATC TGG-3′ (sense), 5′-ATCTGGAGAAATCACTTGTTC CTATTTC-3′ (antisense) for CCNE2; 5′-GAAGGTGAAGGTCGGAGTC-3′ (sense), 5′-GAAGATGGTGATGGGATTTC-3′ (antisense) for GAPDH; 5′-GTGGGCCGCTCTAGGCACCAA-3′ (sense), 5′-CTCTTTGATGTCACGCACGATTTC-3′ (antisense) for β-actin. The primers were obtained from Invitrogen (Grand Island, NY).
cDNA Microarray
After EGCG treatment with either Tr1 or Tr4, total RNA was isolated and quantified. The isolated RNA was amplified and labeled according to the method described in the GeneChip Expression Analysis Technical Manual (Affymetrix, Santa Clara, CA). Total RNA (1 μg) was converted into double-stranded cDNA using a One-Cycle cDNA Synthesis kit (Affymetrix). Double-stranded cDNA was purified by using a GeneChip Sample Cleanup Module (Affymetrix). In vitro transcription reactions were performed using a GeneChip IVT Labeling kit (Affymetrix), which includes T7 RNA polymerase and biotin-labeled ribonucleotides. Biotin-labeled cRNA was then purified using a GeneChip Sample Cleanup Module. The concentration of cRNA was calculated from light absorbance at 260 nm using a UV spectrophotometer (UV-1600PC, Shimadzu, Kyoto, Japan). cRNA (15 μg) was fragmented at 94°C in the presence of a fragmentation buffer (Affymetrix). Fifteen micrograms of the cRNA was hybridized to a GeneChip Human Genome U133 Plus2.0 array (Affymetrix) containing oligonucleotide probe sets representing 54,675 human genes. The array was incubated for 16 h at 45°C, then automatically washed and stained with a GeneChip Hybridization, Wash and Stain kit (Affymetrix). The probe array was scanned using GeneChip operating software (GeneChip Scanner 3000, Affymetrix) and further analysis was carried out with GeneSpring GX 7.3.1 (Agilent Technologies, Palo Alto, CA). Raw intensity values from each chip were normalized to the 50th percentile of the measurements. Each gene was normalized to the median of that gene in the respective control to enable comparison of relative changes in gene expression levels between samples. We standardized the change in gene expression of microarray based on the values for the nontreated control, which was adjusted to 1 and those genes that changed over twofold (i.e., either ≥2 or ≤1/2).
Statistical Analysis
All variables were tested in either four or six replicates. The results are reported as a mean ± SD, compared with the nontreated controls. A one-way analysis of variance (ANOVA, SAS Institute Inc., Cary, NC) was performed to analyze the differences in the variables between the EGCG treatments on nHTFs by a Tukey HSD test. The value of p < 0.05 was considered statistically significant.
Results
Effect of EGCG on Cell Growth
Cell growth of EGCG-treated nHTFs was temporarily inhibited. Cells incubated in the culture medium with 100 μg/ml EGCG (Tr1) stopped proliferation after 1 day of incubation (Fig. 1). The cells that were incubated in an EGCG-containing medium (Tr2 and Tr3) remained almost unproliferating during the incubation period, while those transferred to a fresh medium to remove EGCG (Tr4) resumed cell growth after 5 days. The cell proliferation was significantly (p < 0.05) suppressed when EGCG was added in the culture medium. After 8 days of EGCG removal (Tr5), the proliferation resumed, and the proliferating speed reached initial levels. Treatment of EGCG for 1 day (Tr1) retained cellular proliferation over 60% compared with the nontreated control. Cellular proliferation was rapidly resumed after the removal of EGCG and restored to the levels of the control [i.e., 71% after 2 days of EGCG removal (Tr4), 99% after 8 days (Tr5)]. When cells were continually incubated with EGCG for 9 days (Tr3), cellular proliferation was suppressed down to 8% of the control. Compared to the number of cells upon initial seeding, those of the control cells and cells treated for 1 day and then removed of EGCG increased exponentially.

Effects of EGCG on growth of HTFs. Cells were treated with EGCG with 20 μg/ml catalase (Tr0: nontreated control, Tr1: incubation with 100 μg/ml EGCG for 1 day, Tr2: Tr1 + additional 2 days incubation, Tr3: Tr1 + additional 8 days incubation, Tr4: incubation with 100 μg/ml for 1 day, washing with PBS, and further incubation for 2 days, Tr5: Tr4 + additional 8 days incubation). Cell growth was measured with a cell counting kit as described in Materials and Methods. The results are indicated as mean ± SD (n = 6) and were analyzed by a Tukey HSD test (ap < 0.05 vs. nontreated control and bp < 0.05 vs. EGCG treated with washing).
Effect of EGCG on Cell Cycle
Cytometric analysis showed that EGCG treatment of nHTFs changed the profile of their DNA contents (Fig. 2). The cell cycle of the cells treated with EGCG for 1 day (Tr1) was significantly (p < 0.05) arrested at G0/G1 phase (G0/G1: 92.6%, S: 4.3%, and G2/M: 3.1%) compared to that of the nontreated control (Tr0, G0/G1: 65.1%, S: 11.0%, and G2/M: 23.9%). In these cells that were continually exposed to EGCG (Tr2 and Tr3), the cell cycle did not recover. This EGCG treatment resulted in significant (p < 0.05) increase of the cell population at G0/G1 phase with concomitant decrease at S and G2/M phases (Tr2; G0/G1: 93.6%, S: 2.9%, and G2/M: 3.5%, Tr3; G0/G1: 90.2%, S: 6.6%, and G2/M: 3.2%). In Tr4, the cell population at S phase completely recovered after 2 days of EGCG removal from the culture media, but that at G2/M phase was maintained at a low level (G0/G1: 80.5%, S: 12.6%, and G2/M: 6.9%). After 8 days of EGCG removal (Tr5), the proportion of cells at G2/M phase was restored to the level of control cells (G0/G1: 70.7%, S: 11.7%, and G2/M: 17.6%).
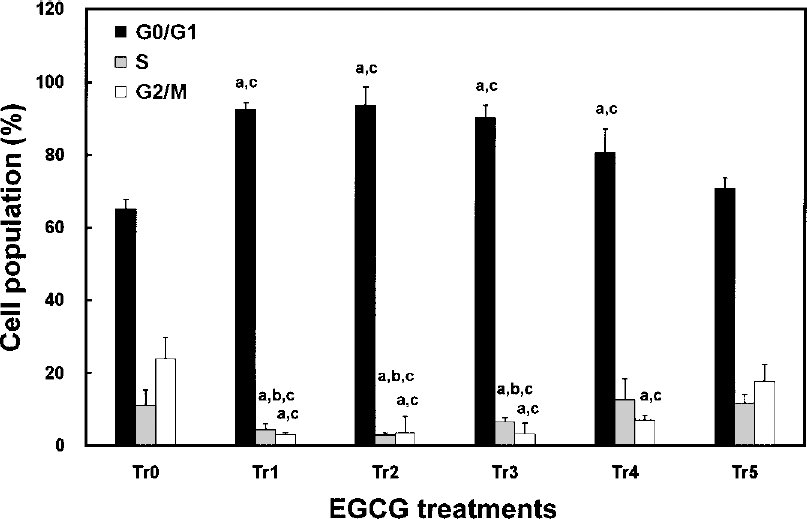
Effects of EGCG on cell cycle of HTFs. Cells were treated with EGCG with 20 μg/ml catalase (Tr0: nontreated control, Tr1: incubation with 100 μg/ml EGCG for 1 day, Tr2: Tr1 + additional 2 days incubation, Tr3: Tr1 + additional 8 days incubation, Tr4: incubation with 100 μg/ml for 1 day, washing with PBS, and further incubation for 2 days, Tr5: Tr4 + additional 8 days incubation). The cell cycle was analyzed by cytometry as described in Materials and Methods. The results are shown as mean values ± SD (n = 6) and were analyzed by a Tukey HSD test (ap < 0.05 vs. Tr0, bp < 0.05 vs. Tr4, and cp < 0.05 vs. Tr5).
Cellular Uptake of FITC-EGCG in nHTFs
To determine the incorporation of EGCG into the cytosol of nHTFs and its further nuclear translocation, fluorescence microscopy was performed in the cells treated with 50 μg/ml FITC-EGCG. Although the cellular response to FITC-EGCG and its binding pattern to receptors would be different from those of EGCG, it was found with adsorption onto the membrane as well as distribution into the cytosol (Fig. 3A). At higher magnification, it was clearly seen onto the membrane as well as widely distributed into both the cytosol and nucleus of the cells particularly with intensively bright green fluorescence after 24 h (Fig. 3B). These results imply that EGCG can be incorporated into the cytosol of the cells through binding to specific receptors and forming complexes with them and further be translocated into the nucleus, which contributes to the reversible regulation of the cell cycle and subsequent hibernation.
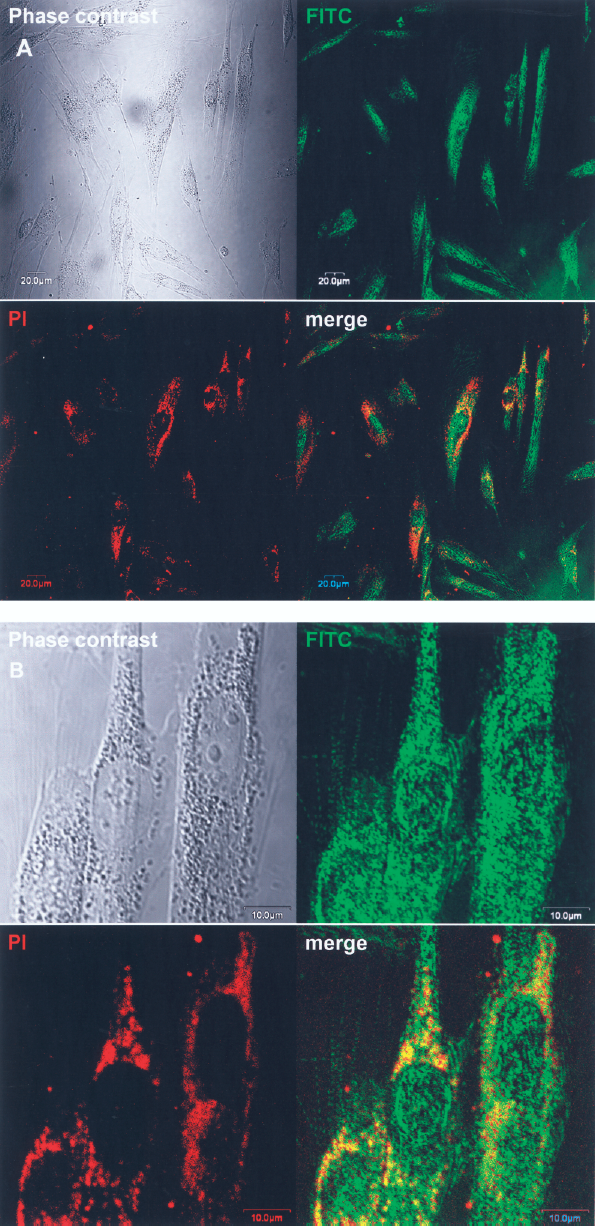
Cellular uptake of EGCG in nHTFs. Cells were incubated with 50 μg/ml FITC-EGCG for 24 h and then observed under a fluorescence microscope. The micrographs shown in this figure are representative of six independent experiments, showing similar results (original magnification: ×400 in A; ×1,000 in B).
Effect of EGCG on Expression of CCN Proteins and RNAs
Figure 4 demonstrates the regulating effects of EGCG on the expression level of CCN proteins in nHTFs. The protein expression levels of CCND1, CCNE2, and CCNB1, which regulate the G1 phase, G1/S phase transition, and M phase, respectively, decreased by EGCG treatment (Tr1), but they were restored after 2 days of EGCG removal (Tr4). The expression level of CCNA, which mainly regulate the G2/M phase transition, was similarly decreased after EGCG treatment and remained at low levels even 2 days after the removal of EGCG. These results were in agreement with those of the cell cycle profile, showing that the cell cycle of EGCG-treated cells for 1 day was arrested at G0/G1 phase and it was restored after EGCG removal.

Effects of EGCG on expression of CCN proteins in HTFs. The expression of CCN proteins in nHTFs treated with or without 100 μg/ml EGCG was determined by Western blotting as described in Materials and Methods (Tr0: nontreated control, Tr1: incubated with 100 μg/ml EGCG for 1 day, Tr4: incubated with 100 μg/ml for 1 day, replacement with fresh media, and incubated for additional 2 days). Results from representative experiments were normalized to β-actin or GAPDH expression. The quantitative results are shown in the lower panel, indicating the average values of four independent experiments (n = 4). Data were analyzed by a Tukey HSD test. The values with asterisks are significantly different from Tr1 (Tr0, ∗p < 0.05).
As shown in Figure 5, the data of RT-PCR analysis largely correlated with the immunoblotting data of the expression level of CCN proteins with the exception of CCNA. The RNA expression of representative CCNs was suppressed by the treatment of EGCG, but upon its removal their expression levels were restored. The expression of CCND1 and CCNE2 was slightly decreased by EGCG treatment, but the level was restored to that of the control after its removal. Contrastingly, the expression of CCNA2 and CCNB1 was strongly decreased by EGCG treatment, but was not fully recovered 2 days after the removal of EGCG.
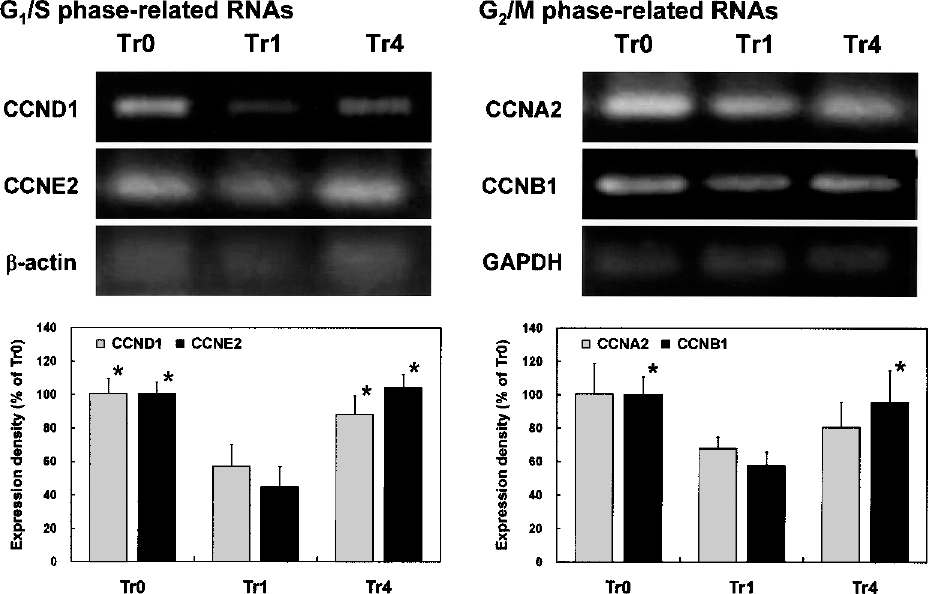
Effects of EGCG on expression of CCN genes in HTFs. The expression levels of CCN RNAs in nHTFs treated with or without 100 μg/ml EGCG were determined by RT-PCR (Tr0: nontreated control, Tr1: incubated with 100 μg/ml EGCG for 1 day, Tr4: incubated with 100 μg/ml for 1 day, replacement with fresh media, and incubated for additional 2 days). Results from representative experiments were normalized to β-actin or GAPDH expression. The quantitative results are shown in the lower panel, indicating the average values of four independent experiments (n = 4). The data were analyzed by a Tukey HSD test. The values with asterisks are significantly different from Tr1 (Tr0, ∗p < 0.05).
Effect of EGCG on Whole Gene Expression
We employed a cDNA microarray analysis to evaluate the effect of EGCG on the expression level of the whole human genome. The genechip containing 54,675 human genes was used and included 151 cell cycle-related genes. We report here only the difference in gene expression levels that are statically significant. Out of 54,675 probe sets, we focused on 19,434 (35.5%) genes that received a present call, which is statistically reliable with respect to the control. Among them, the expression levels of 3,142 genes (16.2%) were changed over twofold by EGCG treatment relative to control signals. Among these genes, the expressions of 1,894 genes (60.3%) were restored to the original levels, but for the rest of the 1,248 genes (39.7%) their expression was not restored even 2 days after the removal of EGCG.
We categorized genes according to various functions: cellular (36.9%), physiological (35.0%), regulatory (13.4%), developmental (5.9%), signal transduction (5.7%) processes, and the others (3.0%). Cellular processes represent cell cycle and apoptosis. Among 151 cell cycle-related genes, the expression levels of 33 genes (31.4%) were changed due to EGCG treatment. Within these 33 genes, the expression of 20 genes (60.6%) returned to the initial levels, and the rest [i.e., 13 genes (39.4%)] did not even after EGCG removal. Among the 251 genes related to apoptotic process, the expression of 31 genes (12.4%) was changed over twofold with EGCG treatment. Among them, the expression of 20 genes (64.5%) was restored after 2 days of EGCG removal, but that of 11 genes (35.5%) was not within 2 days. In 455 genes correlated with immune response, the expression of 34 genes (7.5%) was changed with EGCG treatment. Among these genes, that of 17 genes (50.0%) was restored, but the rest was not after the removal of EGCG. Detailed expression of cell cycle-related genes is listed in Tables 1 and 2. Most CCNs were strongly downregulated with EGCG treatment (Tr1), particularly CCNA2 (Tr1) and CCNB1 (Table 1). After removal of EGCG (Tr4), however, the expressions of CCNA2 and CCNB1 as well as CCN-dependent kinase 1 (CDK1) were not completely restored to the control levels. In contrast, the expression levels of CCND1 and CCNE2 were relatively less suppressed, but those of CCND1 and CCNE2 as well as CDK6 and CDK2 were restored to near normal levels after EGCG removal. Moreover, the expression of some kinds of CDK inhibitors, 1A, 1C, 2B and 2D, was appreciably upregulated with EGCG treatment, and this upregulation was maintained after EGCG removal. Interestingly, other CDKs and CDK inhibitors were not affected by EGCG treatment (Table 2).
List of Significantly Downregulated/Upregulated Cell Cycle-Related Genes After EGCG Treatment

Tr0: nontreated control, Tr1: incubated with 100 μg/ml EGCG for 1 day, Tr4: incubated with 100 μg/ml for 1 day, replacement with fresh media, and incubated for additional 2 days. CCN, cyclin; CDK, cyclin-dependent kinase; CDC2, cell division cycle 2.
List of Minimally or Unaffected Cell Cycle-Related Genes After EGCG Treatment
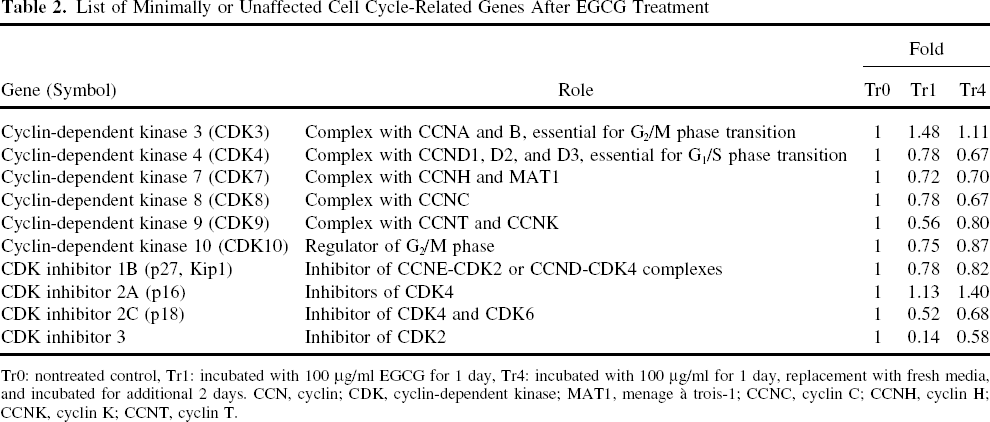
Tr0: nontreated control, Tr1: incubated with 100 μg/ml EGCG for 1 day, Tr4: incubated with 100 μg/ml for 1 day, replacement with fresh media, and incubated for additional 2 days. CCN, cyclin; CDK, cyclin-dependent kinase; MAT1, menage à trois-1; CCNC, cyclin C; CCNH, cyclin H; CCNK, cyclin K; CCNT, cyclin T.
Discussion
In this study, we found that EGCG has a hibernation-inducing effect on nHFTs and that the induction of and recovery from the hibernation are correlated with a reversible regulation of the cell cycle. Among the various biological activities of EGCG, we previously examined cytopreservative effects on mammalian cells and tissues to design a cell- or tissue-preserving medium at physiological temperature (4,8,10). In this study, we hypothesized that EGCG would temporarily suppress the expression of cell cycle-related genes in the normal cells. The cell cycle-related genes were suppressed during the period when the cells were kept in a medium containing EGCG, but once EGCG was removed from the medium, the gene expression was restored to the original levels. This reversible cell cycle regulation showed a temporal correlation with the results in the cell growth assay (Fig. 1). The cell cycle profiles of EGCG-treated cells also showed the increase of G0/G1 phase and the suppression of S and G2/M phases, indicating that EGCG arrests the ongoing cell cycle at G1 phase and prevents nuclear replication (Fig. 2). Removal of EGCG from the culture medium restored the profile of DNA contents similar to the one before EGCG treatment or the control, which suggests that the effect of EGCG on cell cycle is reversible.
The cellular uptake of FITC-EGCG treated to nHTFs was clearly observed (Fig. 3). However, the incorporation of FITC-EGCG into cells was appreciably decreased by pretreatment of free EGCG (data not shown), suggesting that a negligible amount of conjugate will accumulate within cells by virtue of competition with unlabeled EGCG for membrane binding sites. These results suggest that although the cellular sensitivity and response to EGCG would be different from those of FITC-EGCG, it might incorporate into the cytoplasm of cells through binding to specific receptors onto the membrane and forming complexes with the receptors, and further be translocated into the nucleus. These phenomena could be related to the intrinsic characteristics of the polyphenolic compound, EGCG. EGCG is amphipathic and easily binds to extracellular matrices, lipid membranes, or any types of intracellular proteins (15,22,28). Therefore, it seems that EGCG can be incorporated into cell cytosol and further translocated into a nucleus and may modulate the exogenous signals directed to genes required for the survival and apoptosis of cells. Although exact mechanism of the incorporation of EGCG into cells had not been elucidated, some evidence was reported that EGCG was bound to the membrane as well as incorporated into the cytosol and the nucleus of cancer cell lines, such as PC-9 and HT-29 cells (5,21). Recent studies have demonstrated that expression of the metastasis-associated 67-kDa laminin receptor might confer EGCG responsiveness to cancer cells at physiologically relevant concentrations, suggesting that the gallate moiety of EGCG may be critical for receptor binding and subsequent activity (26,29). Moreover, the observation that nucleic acids extracted from catechin-treated cells were colored implied that because both galloyl and catechol groups of EGCG were essential for DNA binding, both groups seemed to hold strands of DNA via their branching structure (14).
Generally, cDNA microarray analysis provides extensive information on global gene expression. Indeed, the data presented here demonstrated the global regulation of multiple genes involved in cell cycle, apoptosis, and immune response that are considered as some of the most important factors for cell or tissue preservation. Those genes that changed over twofold (i.e., either ≥2 or ≤1/2) constituted 16.2% of the entire genes examined. As we had predicted, over 60% of such changed were reversed 2 days after EGCG removal. Based on the results of cell growth assay and cytometry, it is predicted that the expression of most genes that were changed over twofold with EGCG treatment can be restored to the initial levels after 8 days of EGCG removal. Therefore, the reversible hibernation effects of EGCG may allow its safe usage on cell and tissue preservation for transplantation (20) due to the recovery of physiological and/or structural dysfunctions of treated cells and tissues.
Our findings from cDNA microarray showed that 31.4% cell cycle-related genes were strongly affected by EGCG treatment. Among cell cycle-related genes, those that were the most affected by EGCG treatment were CCNs (Table 1). Indeed, CCNs are directly involved in cell cycle regulation. Interestingly, there was substantial difference in the response to EGCG even among the cell cycle-related genes, CCNs and CDKs. For examples, CCNA2, CCNB1, and CDK1, essential for M phase and G2/M phase transition, were strongly suppressed under 1/10 levels, but not completely recovered to the original levels. In contrast, CCND1 and CCNE2 as well as CDK6 and CDK2, essential for G1 phase and G1/S phase transition, were less suppressed, but rapidly recovered to the original levels after EGCG removal (Table 2).
We further validated our hypothesis by finding positive correlations with the results from immunoblotting and RT-PCR. The results of immunoblotting showed similar to those of microarray, except for CCNA, which was strongly suppressed even 24 h after EGCG removal (Fig. 3). The results of RT-PCR largely paralleled those of microarray (Fig. 4). It is presumed that factors related with the translation of CCNA in RNA were inhibited even after the removal of EGCG (23). We also confirmed that the expression of other important genes in tissue and cell preservation was affected by EGCG treatment, but recovered after the removal (12,25,33).
Taking these results into consideration, a feasible cell cycle-regulating mechanism of EGCG would be suggested as follows. First, EGCG freely binds to membrane receptors on nHTFs, resulting in the formation of EGCG–receptor complexes. Next, it becomes internalized into the cytosol through unknown mechanism, followed by affecting various signal cascades responsible for the regulation of nuclear transcription factors. Afterwards, it is translocated into the nucleus of the cells via unknown pathways, which might be partly accounted by the fact that a phytoestrogen molecule, structurally related with catechin, binds to an estrogen receptor and then moves to the nucleus thru nuclear pores (3). Finally, it regulates cell cycle-related genes reversibly, by which the cells can be hibernated for prolonged period. Further study about what signal transduction pathways upstream are involved in cell cycle is required. Moreover, these results do not rule out the possibility of transcription factors responsible for the EGCG-mediated reversible regulation of cell cycle, and the exact mechanism needs to be elucidated.
In conclusion, the results of the present study demonstrated that EGCG induces cellular hibernation through a temporary arrest of the cell cycle, which can be reversibly resumed after EGCG removal from the culture medium. The reversible effect of EGCG on the expression levels of a significant number of genes suggests that EGCG may be a hibernation-inducing agent that allows a potential recovery of physiological functions and structural elements essential for tissue and cell preservation.
Footnotes
Acknowledgment
This work was supported in part by the grant from Seeds Innovation Project by Japan Science & Technology Agency (JST).