
Abstract
BACKGROUND:
By providing both functional and anatomical information from a single scan, digital imaging technologies like PET/CT and PET/MRI hybrids are gaining popularity in medical imaging industry. In clinical practice, the median value (SUVmed) receives less attention owing to disagreements surrounding what defines a lesion, but the SUVmax value, which is a semi-quantitative statistic used to analyse PET and PET/CT images, is commonly used to evaluate lesions.
OBJECTIVE:
This study aims to build an image processing technique with the purpose of automatically detecting and isolating lesions in PET/CT images, as well as measuring and assessing the SUVmed.
METHODS:
The pictures are separated into their respective lesions using mathematical morphology and the crescent region, which are both part of the image processing method. In this research, a total of 18 different pictures of lesions were evaluated.
RESULTS:
The findings of the study reveal that the threshold is satisfied by both the SUVmax and the SUVmed for most of the lesion types. However, in six instances, the SUVmax and SUVmed values are found to be in different courts.
CONCLUSION:
The new information revealed by this study needs to be further investigated to determine if it has any practical value in diagnosing and monitoring lesions. However, results of this study suggest that SUVmed should receive more attention in the evaluation of lesions in PET and CT images.
Introduction
Digital imaging systems have been increasingly applied in the health area to assist professionals in medical diagnosis. Therefore, investigating new methods of processing medical images becomes increasingly important, not only for improving image quality but also for extracting parameters that quantify the findings.
Among the imaging systems most used in medicine are ultrasound, magnetic resonance imaging (MRI), X-rays, computed tomography (CT), single photon emission computed tomography (SPECT), positron emission tomography (PET), PET/CT, and PET/MRI hybrids [1, 2]. The increase in clinical treatments for tumour lesions, the tendency to personalise cancer therapies, and the importance of monitoring therapies have motivated the development of new imaging systems [3]. The new systems, known as hybrid systems, have been gaining prominence for their ability to associate, in a single image, functional and anatomical information, thus allowing a better location and evaluation of lesions.
One of the fundamental steps in medical image processing is segmentation, which, according to Sharma (2008), is almost always considered a very complex problem due to the volume of data and the diversity of tissues in the image. This problem can be even more complicated depending on the image generation modality, whether it is low contrast or the presence of noise or artefacts, such as overcorrection of attenuation and respiratory movement [6]. These could impair the delimitation of the limits of anatomical structures. Thus, the main challenge of the segmentation process is to extract the contour of the organs, lesions, or regions of interest from the image. Due to the diversity of available image systems, there is no single segmentation method [4, 5].
PET images together with 2-deoxy-2-F18-fluoro-D-glucose (18F-FDG) have been widely used in clinical practise for the evaluation of tumour lesions, as they provide an image associated with the cellular metabolism of the lesions, thus allowing the evaluation of the degree of malignancy of the tumours. Since this technology has low anatomical detail, hybrid PET/CT equipment has been introduced and gradually recognised as valid for evaluating tumour lesions since the late 1990s.
The standardised Uptake Value (SUV) is the semiquantitative value used to evaluate PET and PET/CT oncological images [7–9]. To obtain this parameter, normalisation must be carried out through some parameters (weight, lean mass), which will determine different types of SUV: body weight (SUVBW), lean body weight (SUVLBW), scaled body surface area (SUVBSA), blood glucose level (SUVGLU), and tumour size (SUVTsize).
Another subdivision of SUV is associated with the activity of administering radioactive material. For the analysis and evaluation of the evolution of tumour lesions, the maximum SUV (SUVMax) is the most used. This value is associated with the maximum activity within the lesion; therefore, knowing it allows evaluating the response to the treatment [10, 11].
Just as SUVMax is associated with maximal activity within the lesion, SUVMed (average SUV) is associated with average activity within the lesion. This parameter is not used in clinical practise since the PET image does not have enough anatomic detail to allow a correct delimitation of the lesion. With the hybrid PET/CT system, there is a better anatomical location of the lesions; thus, they could be delimited with greater accuracy.
Therefore, this work will study the behaviour of these two parameters, SUVmax and SUVmed, throughout the lesion to evaluate their possible use as a complementary method and as an aid in the professional’s diagnosis. In addition, the anatomical detailing of the CT image will be used together with the metabolic mapping provided by the PET image to automatically delimit the lesion. To evaluate the behaviour of SUVmax and SUVmed in each tomographic slice and along the lesion on PET/CT images based on the segmentation of the CT images.
Literature review
More cutting-edge imaging techniques and analytic methodologies might be developed to better comprehend intratumorally heterogeneity and standardised uptake value (SUV) in PET/CT imaging, both of which are important factors in the detection and monitoring of cancer. To better measure intratumorally heterogeneity and predict patient outcomes, for instance, researchers may investigate the use of sophisticated texture analysis tools and machine learning models. A more complete image of the tumour’s features might be obtained by combining PET/CT imaging with additional imaging modalities like MRI or CT. Scientists might also look at how SUV and intratumorally heterogeneity affect therapy response prediction and the creation of individualised treatment programmes. PET/CT imaging might be used to track tumour evolution and adapt treatment strategies appropriately. Research into intratumorally heterogeneity and SUV in PET/CT imaging has great potential to further our knowledge of cancer biology and treatment response, which in turn may lead to more efficient treatment choices and improved patient outcomes.
Genetic variability [21, 22] and environmental stressor geographic variation cause regional changes in stromal architecture [23], oxygen consumption [24, 25], glucose metabolism [24], and growth factor expression [26]. Thus, tumour subregions arise with spatially different patterns of blood flow [27, 28], vascular permeability [29], cell proliferation [30], cell death [31], and other characteristics. Intertumoral and intratumor spatial heterogeneity occur in patients’ tumours. Malignant tumours are almost always heterogeneous, although the degree varies across preclinical cancer models and patients [32]. Despite these disparities, motifs emerge. Intratumor heterogeneity changes. Tumour pO2 changes over minutes to hours [25, 26]. Second, tumours become more heterogeneous [27, 33]. Thirdly, established spatial heterogeneity often signals poor clinical prognosis [34], in part because resistant cell subpopulations drive therapeutic resistance [23, 35]. Finally, effective anti-cancer treatment may enhance or reduce intratumor heterogeneity [31, 36], depending on the imaging test and tumour biology [37]. Recent academic research has examined the relationship between intratumorally heterogeneity and PET/CT image SUV. Numerous studies have used PET/CT scan textural features to characterise intratumorally heterogeneity. This research examined how intratumorally heterogeneity affects cancer diagnosis and prognosis. Intratumorally heterogeneity may affect therapy response, disease progression, and survival in several cancers [38]. PET/CT scan textures may provide extra prognostic information beyond SUVmax [39]. There is a lot of interest in developing more advanced imaging and analytic methods to better understand intratumoral heterogeneity and its effects on cancer diagnosis and treatment.
Materials and methods
The work was divided into two stages. The first was performed using a phantom image bank (PIB) and the second with real patient images (RPI). The pilot programme was developed using only the PIB; later, when applied to the RPI, adjustments were made as the image banks have different registration characteristics. The PIB and RPI were acquired using different equipment, so the images were saved with different standards. The image analysis programme was developed on a Matlab® platform (MathWorks, Natick, MA, USA), installed on a notebook (Intel® Core i7, CPU Q740, 1.73 GHz, 4GB of RAM, Microsoft Windows 7 Ultimate).
Features of the phantom image bank
The image bank was generated from the NEMA IEC Body Phantom Settrademark, designed according to the recommendations of the International Electrotechnical Commission (IEC) and modified by the National Electrical Manufacturers Association (NEMA) [12, 13]. This Body Phantom, made of material that simulates the lung parenchyma and six spheres of different diameters (10, 13, 17, 22, 28, and 37 mm), has been used to assess the quality of the PET image. The database contains PET and CT images with 47 slices each. The location of the phantoms’ “lesions” is evident; therefore, the radiologist’s evaluation is not necessary, as they are images where the position of these is known a priori.
Characteristics of the real image bank of patients
Initially, the images were evaluated by a radiologist, who located the lesions. For this evaluation, the professional used her own workstation, which is linked to the PET/CT equipment located in the radiology laboratory. They were asked to look for lesions that had metabolic activity on the PET image, specifically lesions with spot or concentrated activity. The corresponding CT image showed evidence of a morphologically distinguishable lesion. Figure 1 exemplifies this type of case.
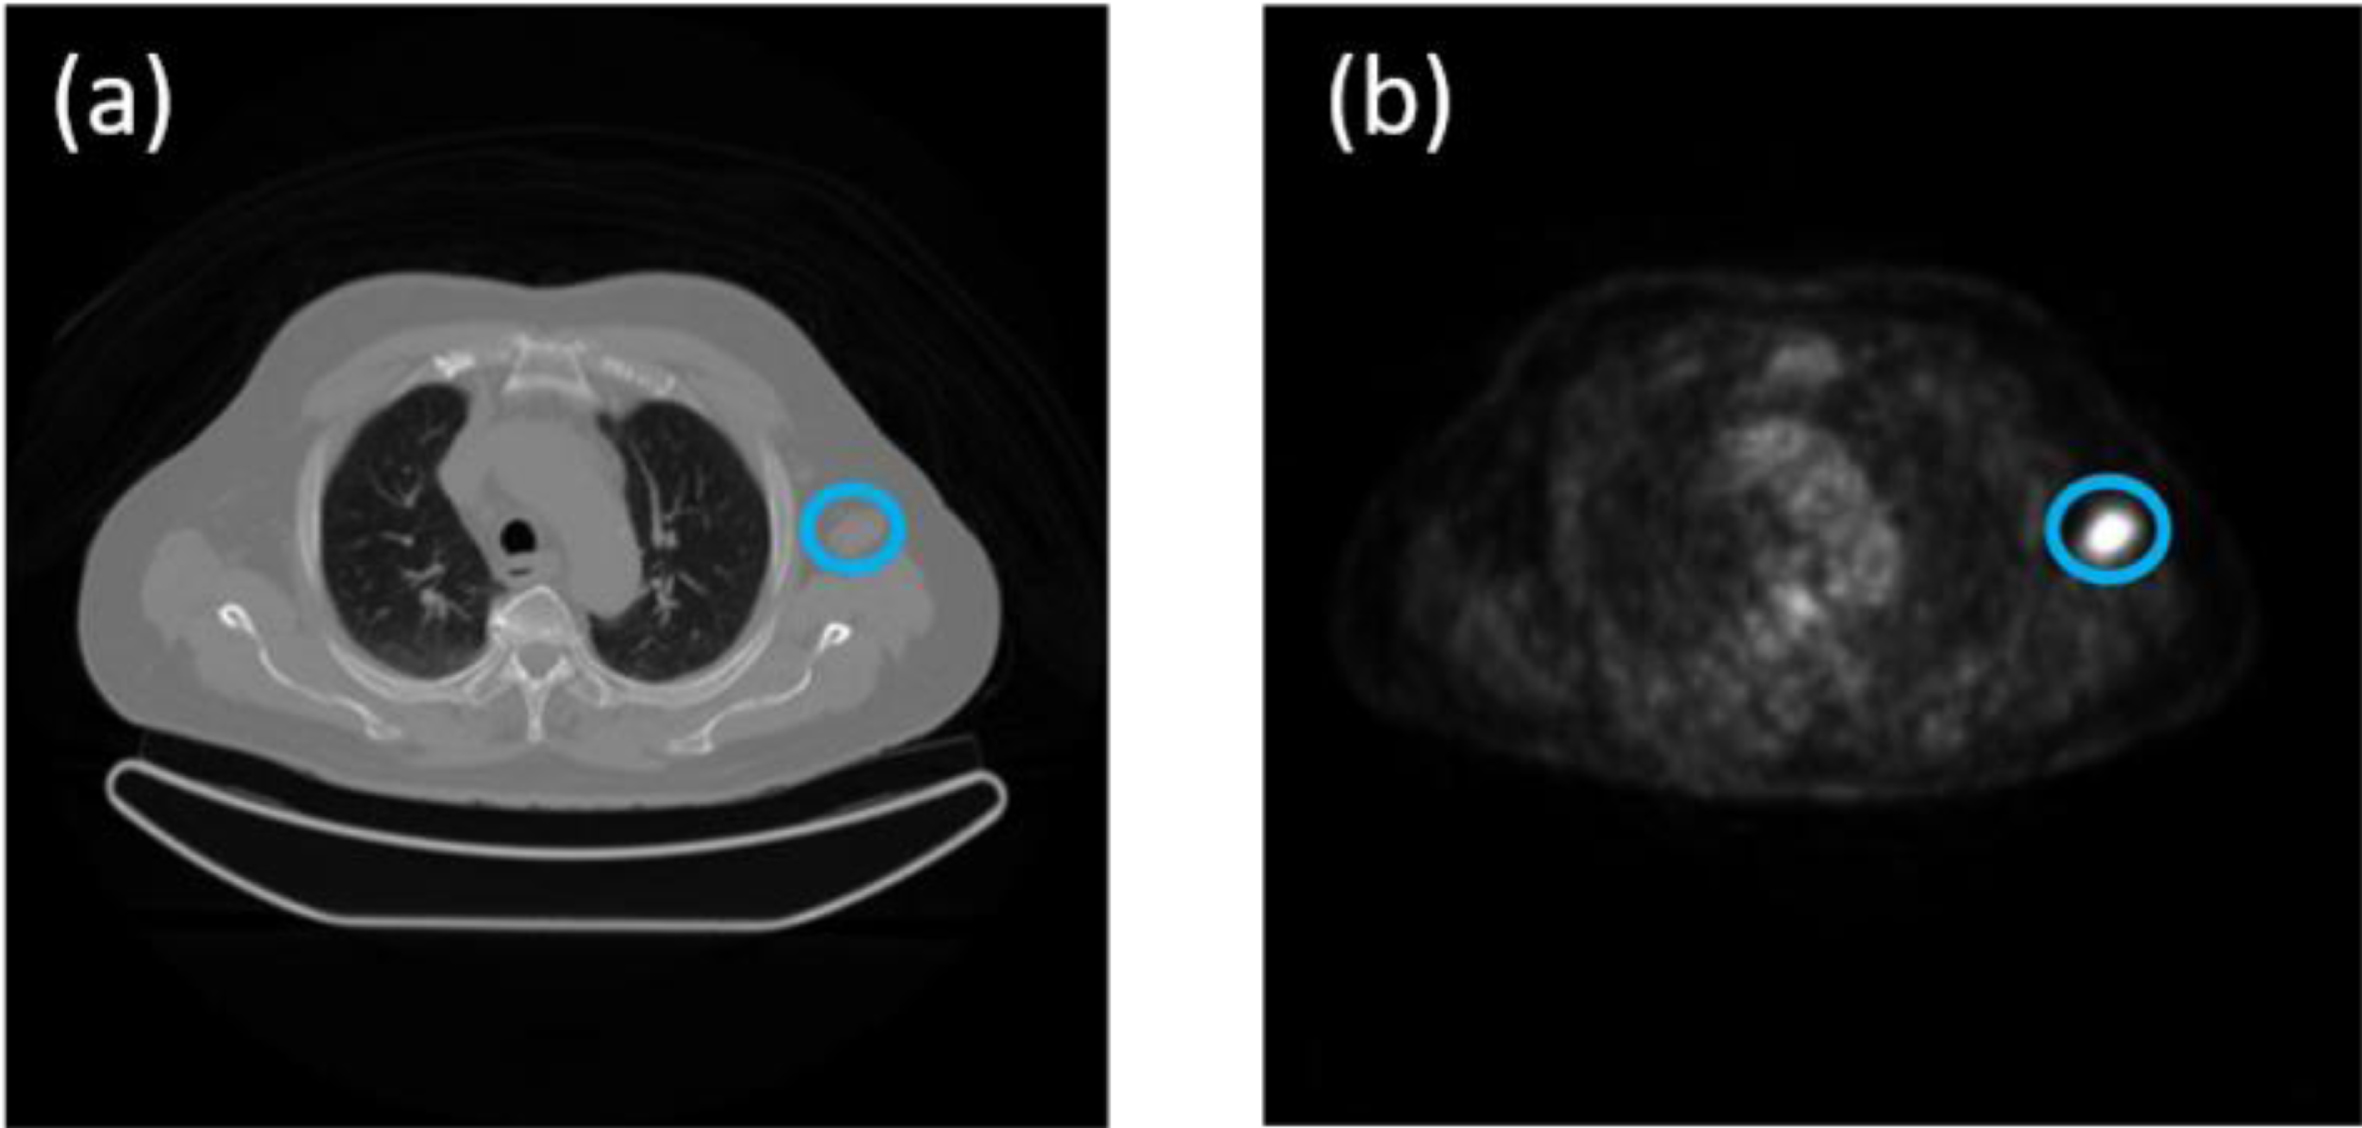
(a) CT image with the distinguishable lesion, (b) corresponding PET image with metabolic activity.
In the case of RPI, as they are images of different patients at different times, a table was made per patient to present the images’ characteristics. After performing the lesion search procedure, 18 lesions were found in the 7 patients analysed with characteristics close to those requested. These 18 lesions were used in this work.
Unsupervised machine learning methods like principal component analysis (PCA) may help medical imaging analysts find patterns and decrease dimensionality. Topic modelling may also find latent themes in picture data that indicate tumour size and form, which can aid diagnosis and therapy. Unsupervised machine learning may identify latent characteristics and decrease dimensionality in pre-processing to train models to detect tumours in photos. Topic modelling and factor analysis are widely used in medical image data analysis and interpretation, including tumour detection. Since tumour detection methods primarily analyse medical picture data, they cannot deduce factorised answer values from documents and replies. Other machine learning algorithms may be able to analyse textual input and extract factorised answer values. Unsupervised machine learning methods like LDA and NMF may detect latent themes and factorise textual data. These methods can categorise documents by content and create factorised answer values. Factorised response values from textual data may be used to complement medical pictures and other sources to help diagnose and treat tumours. While tumour detection programmes may not directly employ textual data to deduce factorised answer values, other machine learning techniques and models may analyse text data and create factorised replies. After finding the location of each lesion, in all the cases studied, the evaluation of each of these lesions was performed separately, following the procedure to be described. Figure 2 shows the flowchart for a better understanding of the procedure.
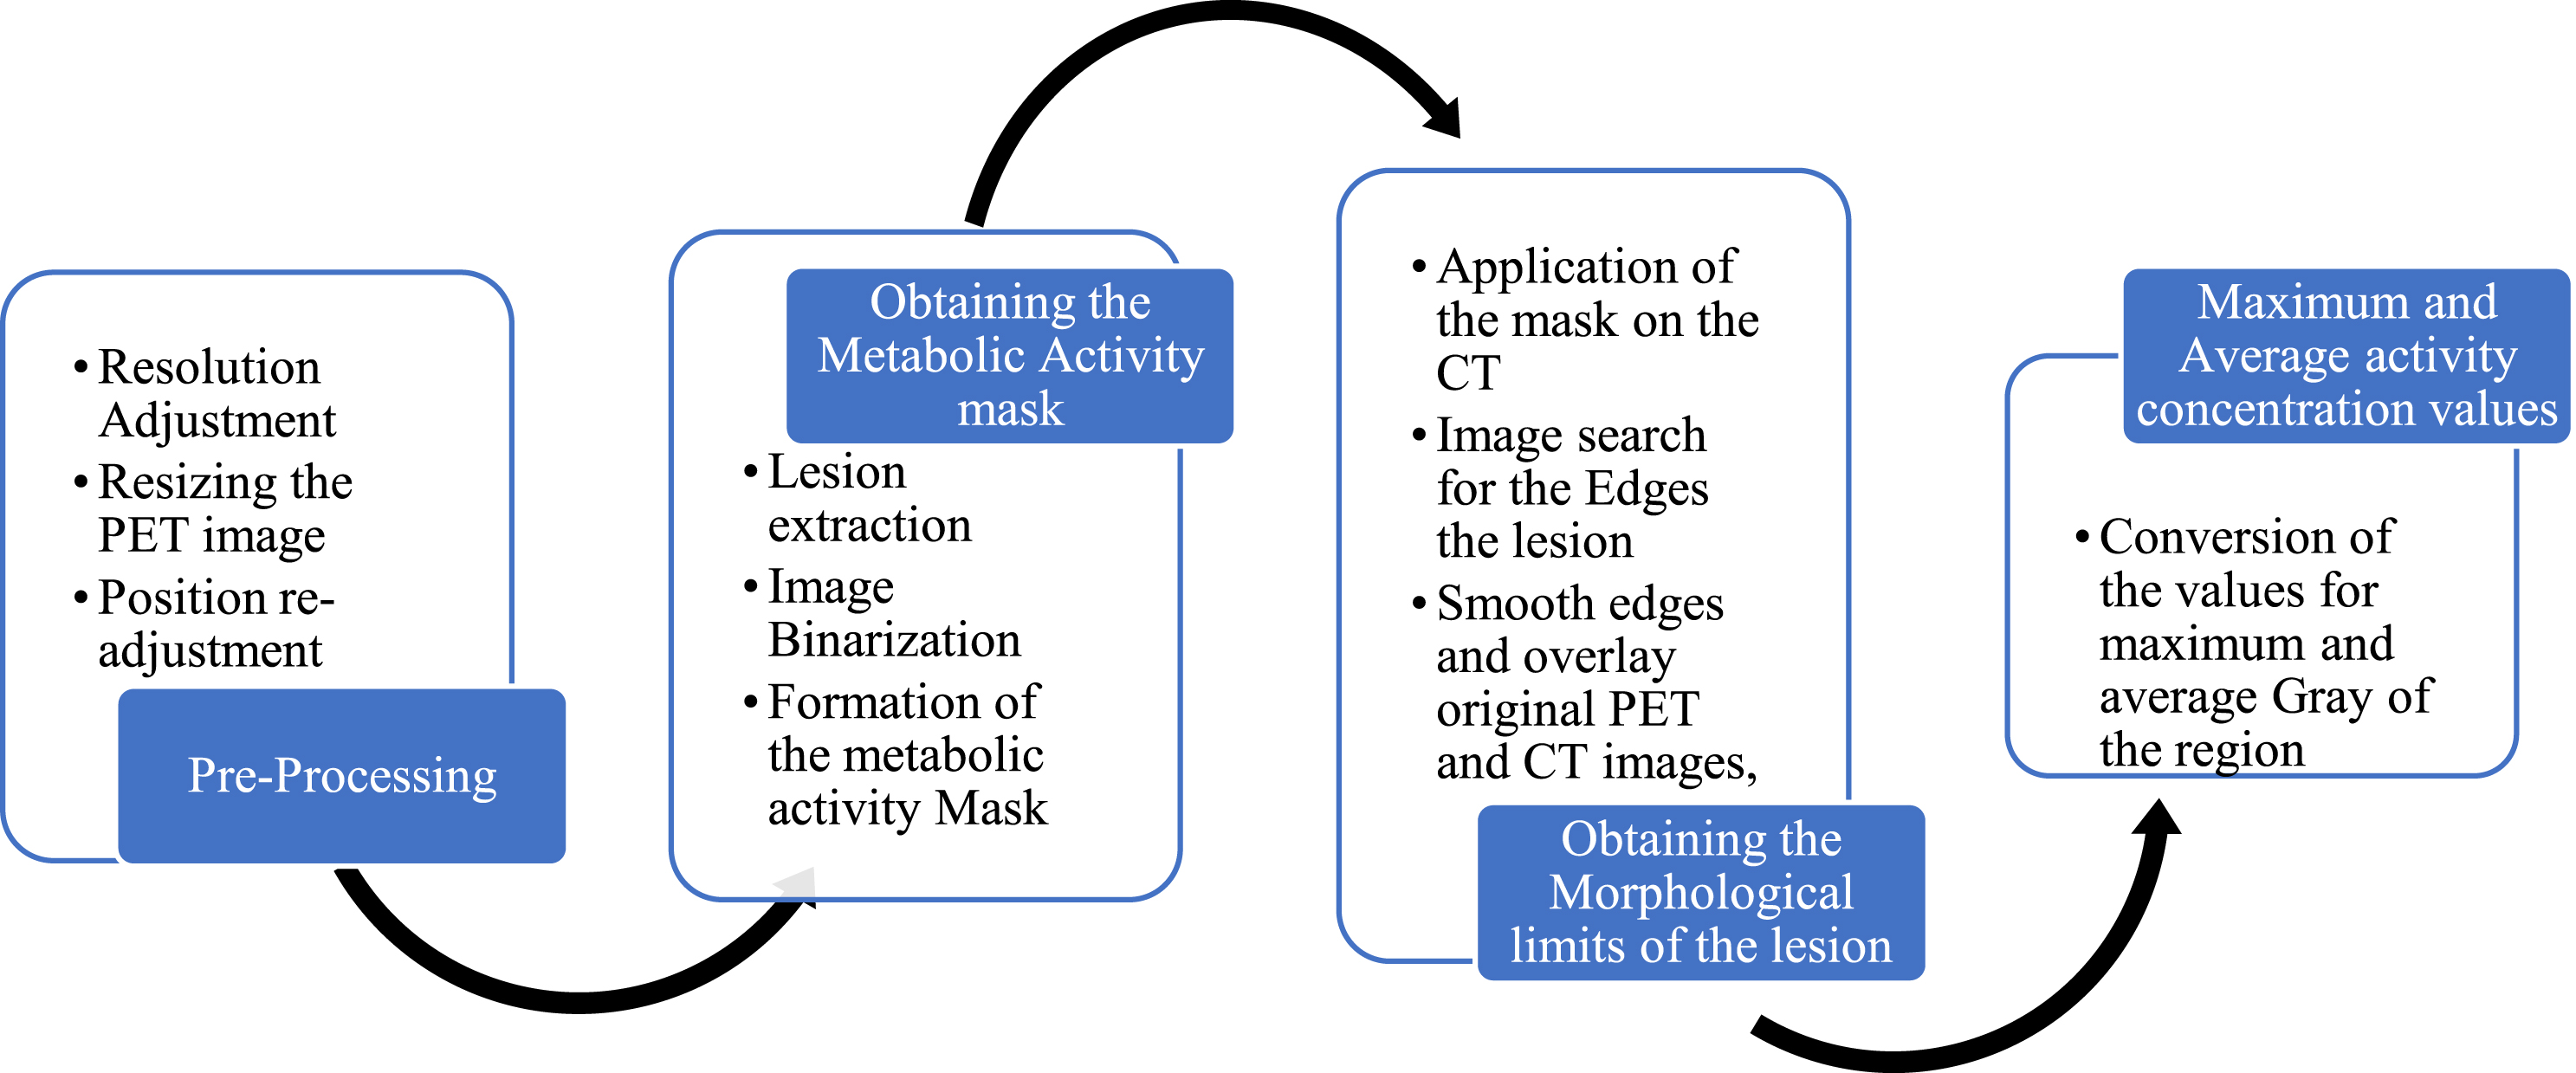
Image processing flowchart.
In both image banks, PET and CT images have different spatial resolutions; this characteristic is inherent to the difference between the technologies. To work with both images, the PET image was resized so that both images had the same resolution. To carry out this process, the ratio between the resolutions of the PET and CT images, both for the rows and for the columns, was used as a resizing multiplier factor [14]. Figure 3 compares the original image and the result of the resizing performed on a PET image that belongs to the PIB. The same procedure was performed on the images that belong to the RPI.
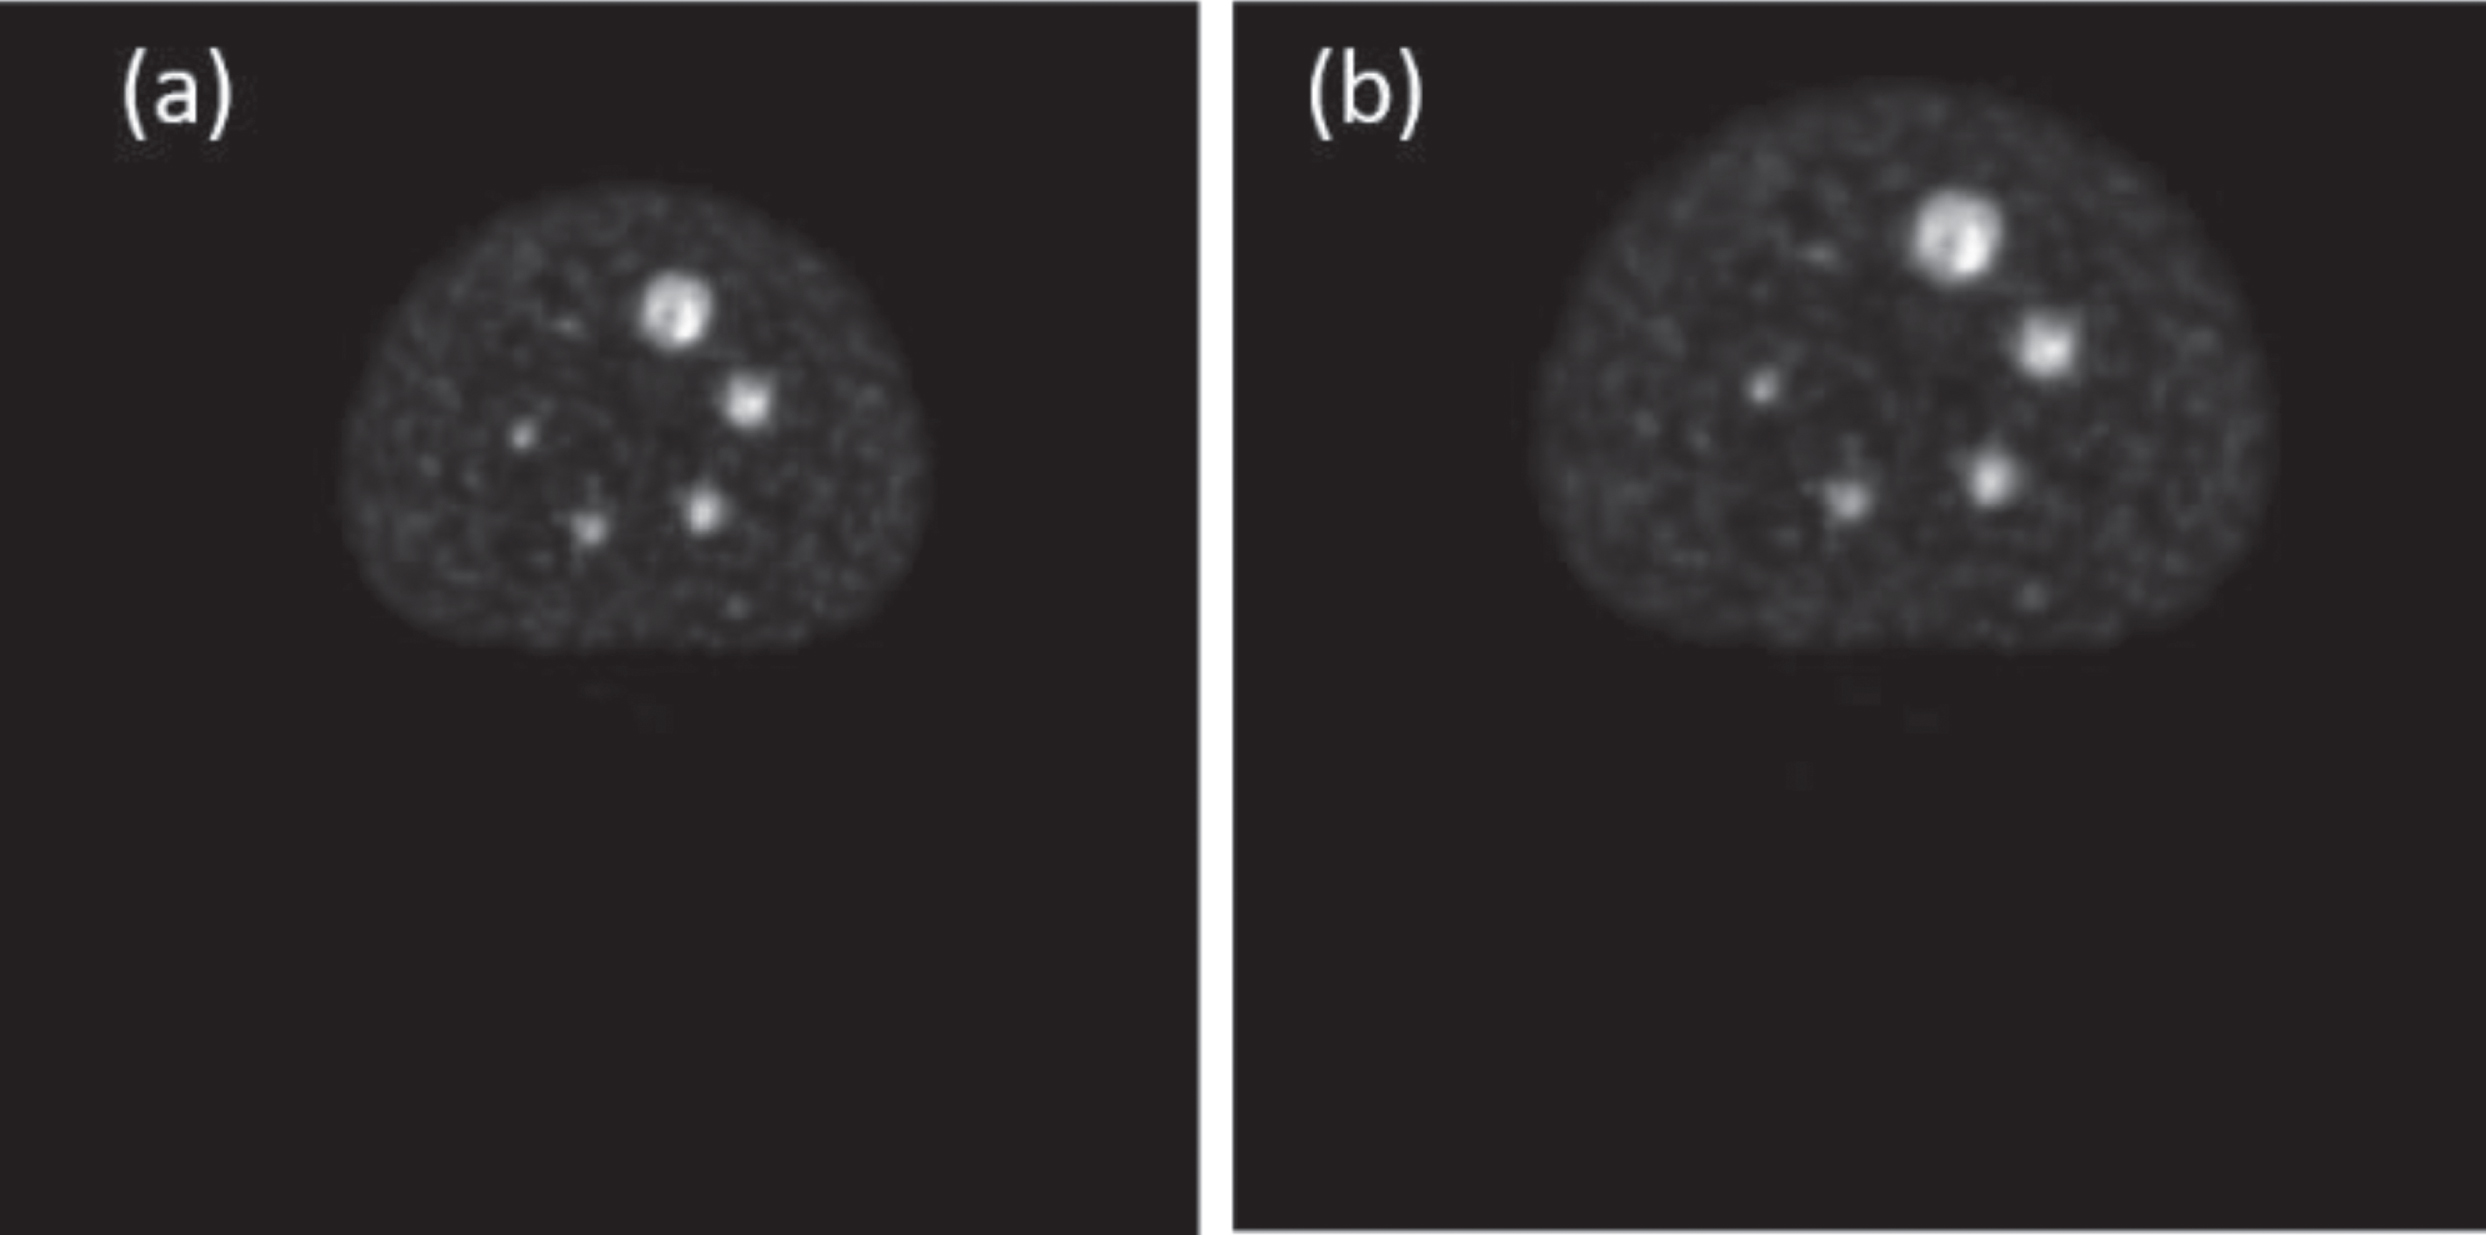
(a) Original PET image with 4.688 mm resolution, (b) PET image after being resized and with spatial position correction; new resolution of 0.977 mm.
The resized PET image has a greater number of pixels (approximately 699x699) than the CT image (512x512); for this reason, it is necessary to extract from this image an image that contains the same number of pixels as the CT image.
In addition to the difference in resolution, both images have a difference in spatial position as the coordinates of the first pixel in the plane of both images are different. This fact can be seen in Table 1 for the case of PIB images. Thus, to solve the problem of spatial position and the problem of having a larger PET image, after resizing, a position readjustment was performed so that both images would be equally positioned in space and contain the same number of pixels. In addition, they can be independently analysed without worrying about possible problems when one of them is used to evaluate the other. For this process, the following relationships were used:
Comparison of proposed method with existing techniques
The data obtained from these relations is the number of pixels that must be discarded in both coordinate axes of the resized PET image to be able to extract a PET image with the same spatial position, resolution of 0.977, and number of pixels from the CT image. This process is done at the four edges of the image (top, bottom, left, and right).
The intention of using the PET image as a mask was to associate this technology’s advantages with those of the CT image. It is known that PET imaging provides information associated with cellular metabolism; for this reason, regions of greater brightness within the image may be associated with tumor lesions. On the other hand, CT images provide better anatomical detailing of bodies because they are associated with their densities. The combination of these two advantages would allow for an image with great morphological detail in regions with high metabolic activity.
To obtain this mask, a rectangle was manually delimited that included the lesion already located by the radiologist (Fig. 4a), thus extracting a sub-image totally independent of the original image (Fig. 4b).
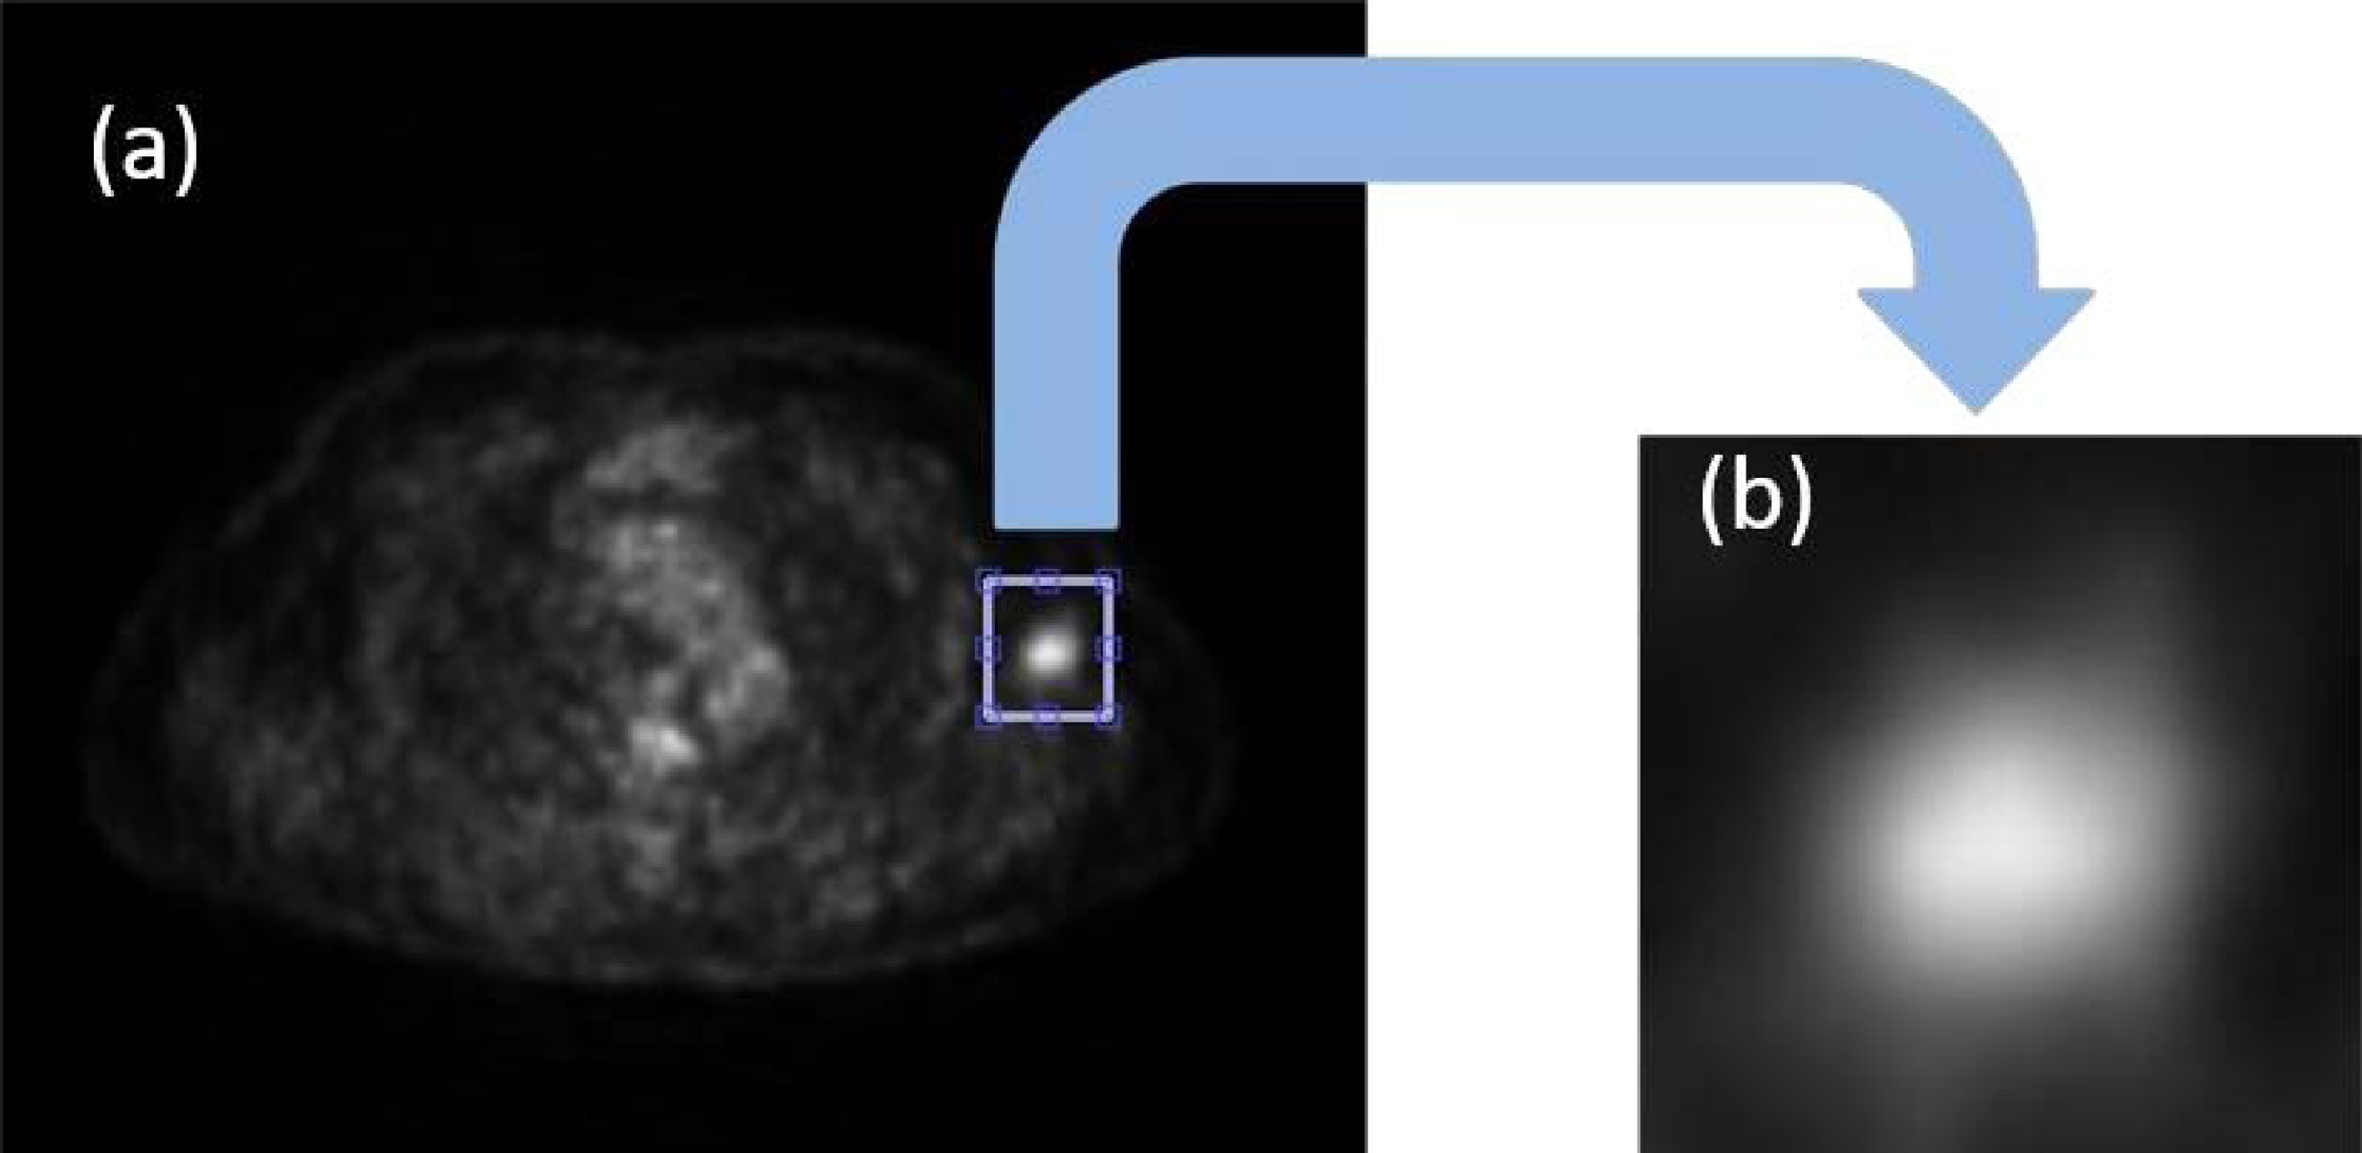
(a) Delimitation of the lesion to be evaluated, (b) extracted sub-image that contains the lesion to be evaluated.
After having a smaller image that included the lesion to be evaluated, it was binarized, applying the Otsu method. This process can be visualised in Fig. 5. The binarization threshold value is associated with the sub-image histogram; if the value were obtained from the original image, it would be different. To avoid possible gaps, smooth the outline of the binarized image, and increase the size without losing its shape, the morphological operator closure was used with a structuring element disc of radius 4, followed by the morphological operator fill, which fills the gaps that are within a closed region.
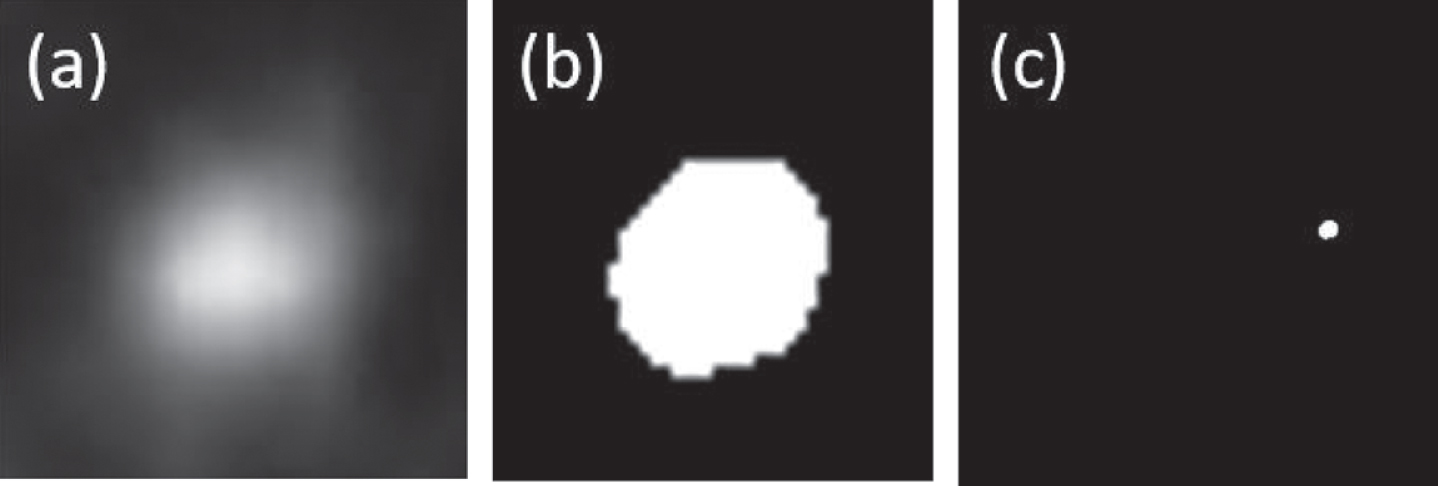
(a) PET sub-image contains the lesion without being binarized, (b) PET sub-image after binarization process and (c) Resulting metabolic activity mask with a dimension of 512x512 pixels.
The resulting image has dimensions different from those of the original PET image. Therefore, a new image was created with the original image’s dimensions, making the pixels that do not belong to the sub-image, delimited by the rectangle, have a value of zero (Fig. 5c). After this process has been carried out, the metabolic activity mask is ready to be used.
Once the metabolic activity mask is ready, it is applied to the CT image. The result of the process described above will allow for the identification, in an isolated way, of the corresponding area in the CT image of the region with metabolic activity. In other words, the image resulting from the multiplication will provide morphological information about the region to be evaluated. Figure 6 shows the CT image before and after the application of the activity mask. It is observed that in Fig. 6b, the region of interest is shown in the CT image in isolation.
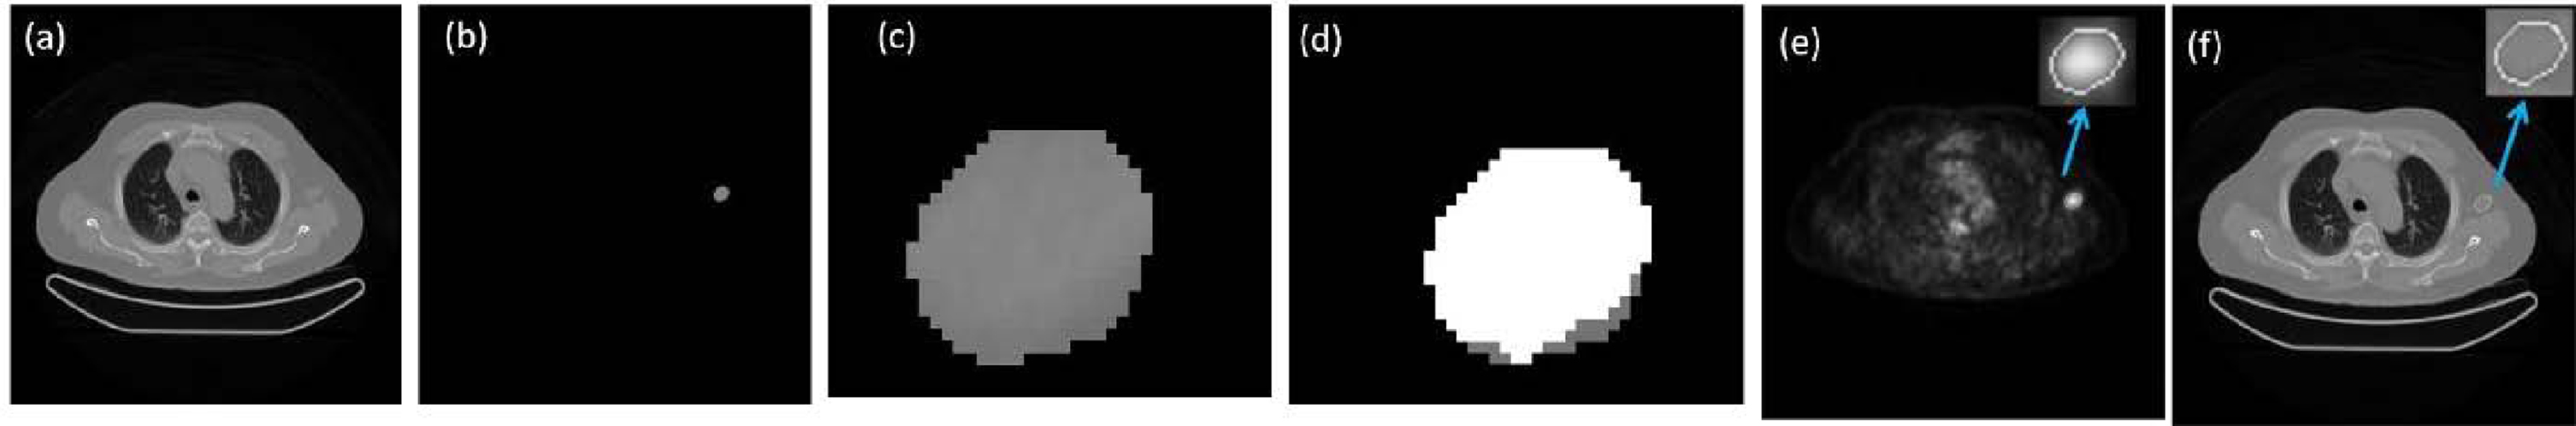
(a) original CT image, (b) image resulting from the application of the metabolic activity mask over the same CT image. (c) image after applying the metabolic activity mask, (d) result of region growing, the white area contains the pixels that satisfied the condition. (e) segmented PET image, (f) corresponding segmented CT image.
This resulting CT image is the one that will be used to obtain the lesion boundaries. For this process, the region-growing segmentation method was used. This method is based on the evaluation of the grey level of neighbouring pixels. The pixel is considered a close neighbour and is included in the region if the difference between its grey value and the average of the region is less than a stipulated value. To start the growth process, you need a seed pixel. This is the pixel whose value is used as a reference for subsequent comparisons. In other words, this value is taken as the first average to be considered for the comparison with the neighbourhoods. Right after obtaining the second pixel, the new average will be obtained from the grey-level values of the nearby pixels, including the seed pixel value. Growth is automatically suspended when there are no neighbouring pixels that satisfy the condition.
The choice of pixel seed can be done manually or automatically. In this case, it was chosen automatically. The seed pixel was taken as the centroid of the region, and the distance or maximum difference to consider a pixel as a close neighbour was 0.04, with 1 being the grey level with the highest value within the image and zero being the lowest value in other images. In other words, the image was normalised before applying the described method. The chosen distance was empirically obtained after analysing the different images used in this work and was kept constant in the evaluation process of each of the images. Figure 6 (c,d) shows the image resulting from the application of the method to a lesion. When the proposed method does not find a region within the area delimited by the activity mask, the region used for further evaluation is the same activity mask.
After applying this process, you have a region that is limited by the edges of the lesion. For observation purposes, the contours of this lesion are obtained using the Sobel delimitation method, and the original CT and PET images are superimposed, as seen in Fig. 6 (e, f).
The region obtained in the previous procedure was used to evaluate two parameters of the lesion: the maximum activity concentration and the average activity concentration. The first is associated with the pixel within the lesion with the highest activity, and the second with the average of activities within the region of interest. Both values are directly associated with the grey levels of the image. This relationship is stipulated in the DICOM protocol itself [15]. The values of these parameters can be found in the space dedicated to DICOM protocol metadata.
The U values obtained, the patient’s weight, and the injected dose would define the SUVMax and SUVMed. As the values of weight and injected dose are constant in the patient, it was decided to use only the values of concentrations to evaluate their behaviour throughout the lesion.
In parallel, the values of maximum activity concentration were obtained using specialised software to validate the data. For this, the software Osirix, Pixmeo, Geneva, Switzerland, was used, and the procedure followed by the radiologist to evaluate the images in each of the sections of the lesions was reproduced.
With the data obtained, graphs were made to evaluate the behaviour of both concentrations along the lesion.
Results
This work presents graphs and example tables to elucidate the behaviour of both activity concentrations along the same lesion. These data are divided into two types: the maximum and mean activity concentrations are found in the same slice, and the second is where both are found in different slices. Figure 7 presents the results of the evaluation of the 18 lesions with reference to the locations of SUVmax and SUVmed. In addition, some images of the segmented lesions are also presented.
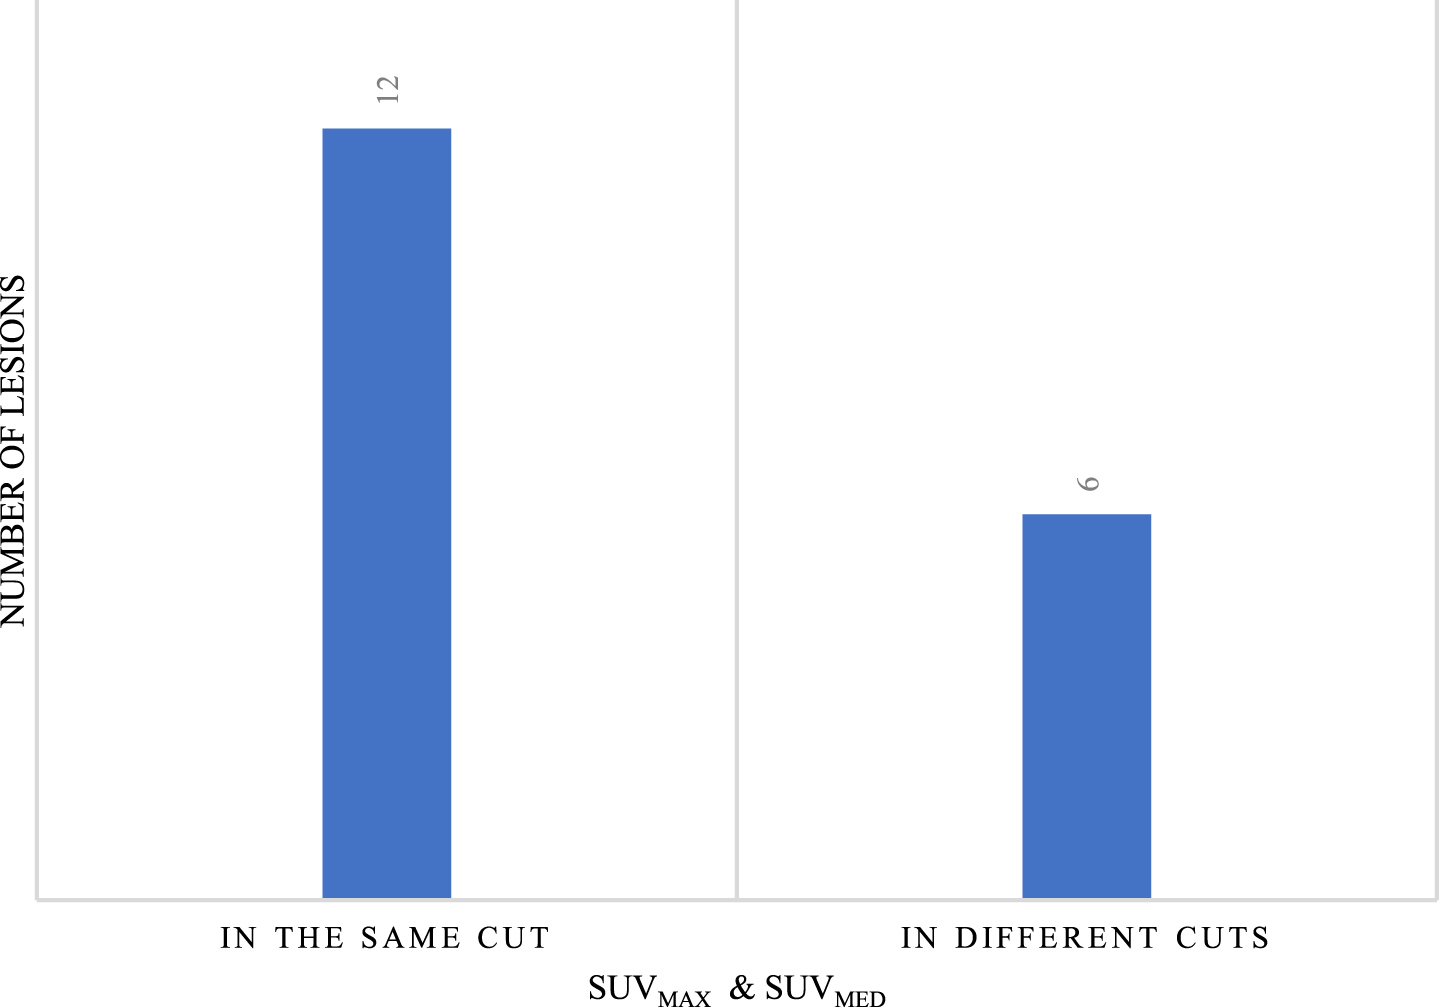
Number of lesions with SUVmax and SUVmed in the same and different sections.
Of the total number of lesions, both when SUVmax and SUVmed are in the same slice and when they are in different slices, in 50% of them it was possible to delimit edges in the CT image with the proposed method. In other words, in the first group, with six lesions, the edge obtained in the CT image was used to evaluate both SUVs, and in the second group, with three lesions,
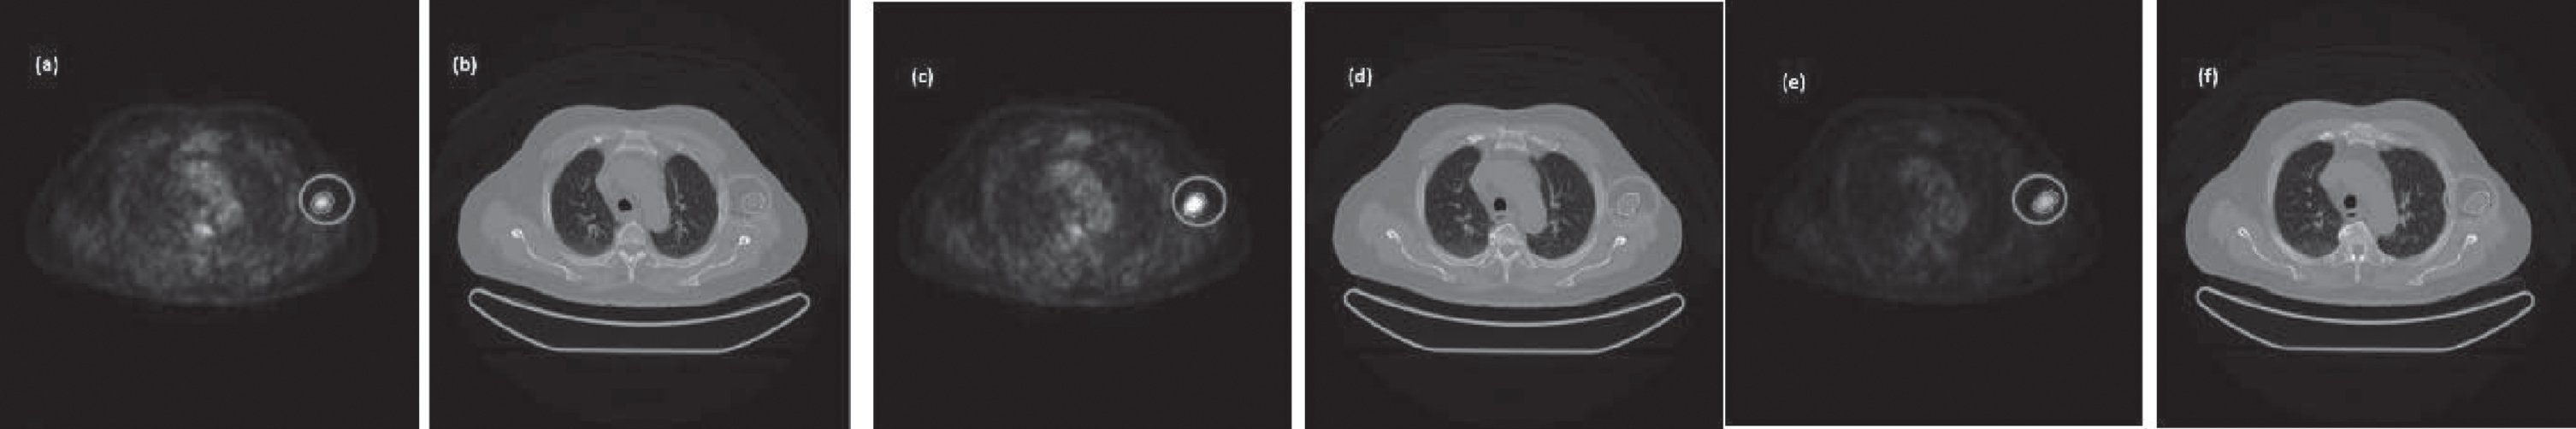
Four examples of lesion segmentation are presented. Each of them belongs to a different patient. The first example is a lesion that has three cuts. The image group below contains segmented PET and CT images of each slice of the lesion in question shown in Fig. 8. In this second example, a lesion with five cuts is presented. For a better presentation, it has been divided into three groups marked as Part 1, Part 2, and Part 3 and is shown in Fig. 9. Each of the groups contains the segmented PET and CT images associated with each slice. The third example is a leison that has seven cuts. The image group below contains segmented PET and CT images of each slice of the lesion in question shown in Fig. 10. The fourth example is a leison that has seven cuts. The image group below contains segmented PET and CT images of each slice of the lesion in question shown in Fig. 11.
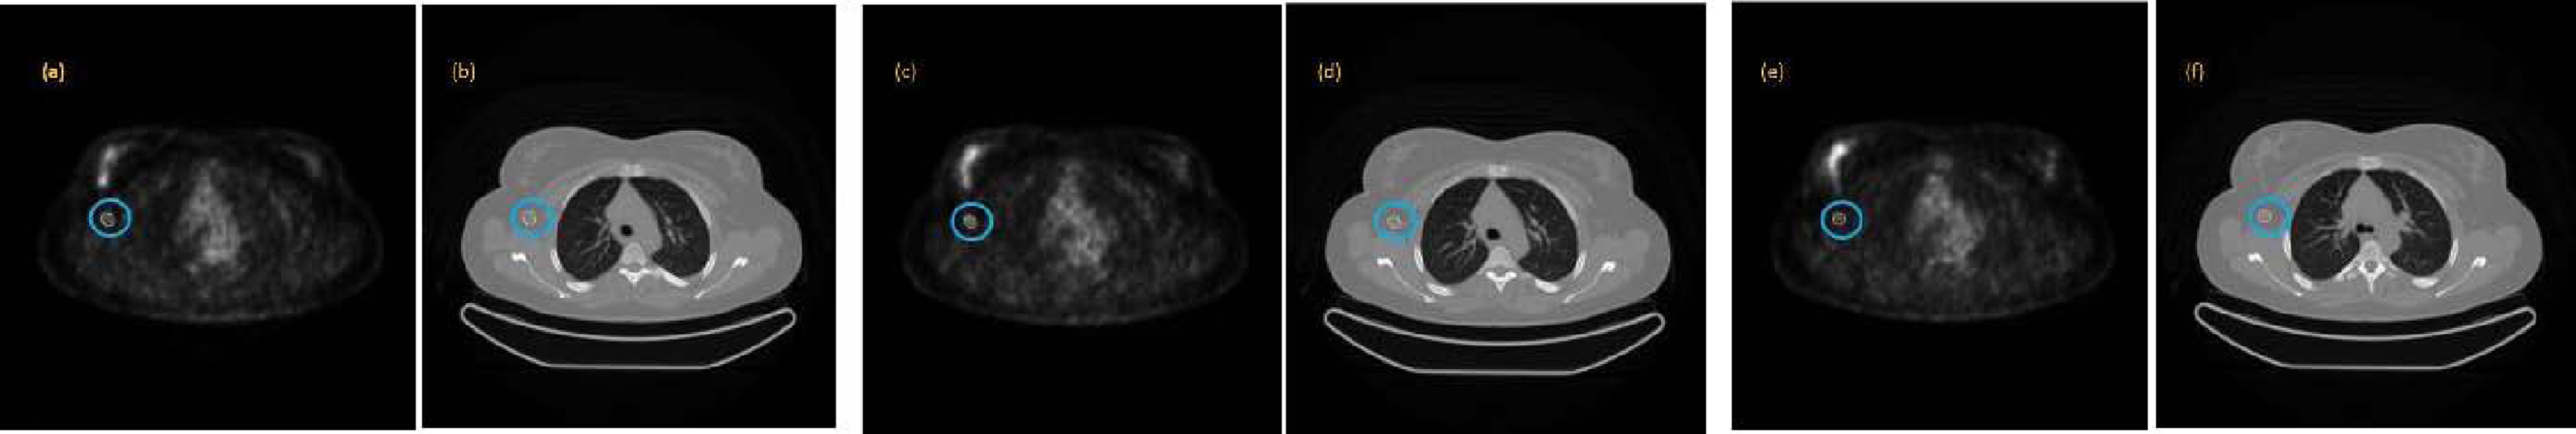
Example of a lesion segmented with three cuts along all its sections, both in the PET image (a, c, e) and in the corresponding CT image (b, d, f).
Example of a segmented lesion with five cuts along all its sections, both in the PET image (a, c, e) and in the corresponding CT image (b, d, f).

Example of a lesion segmented with seven cuts along all its sections, both in the PET image (g, i, k) and in the corresponding CT image (h, j, l).
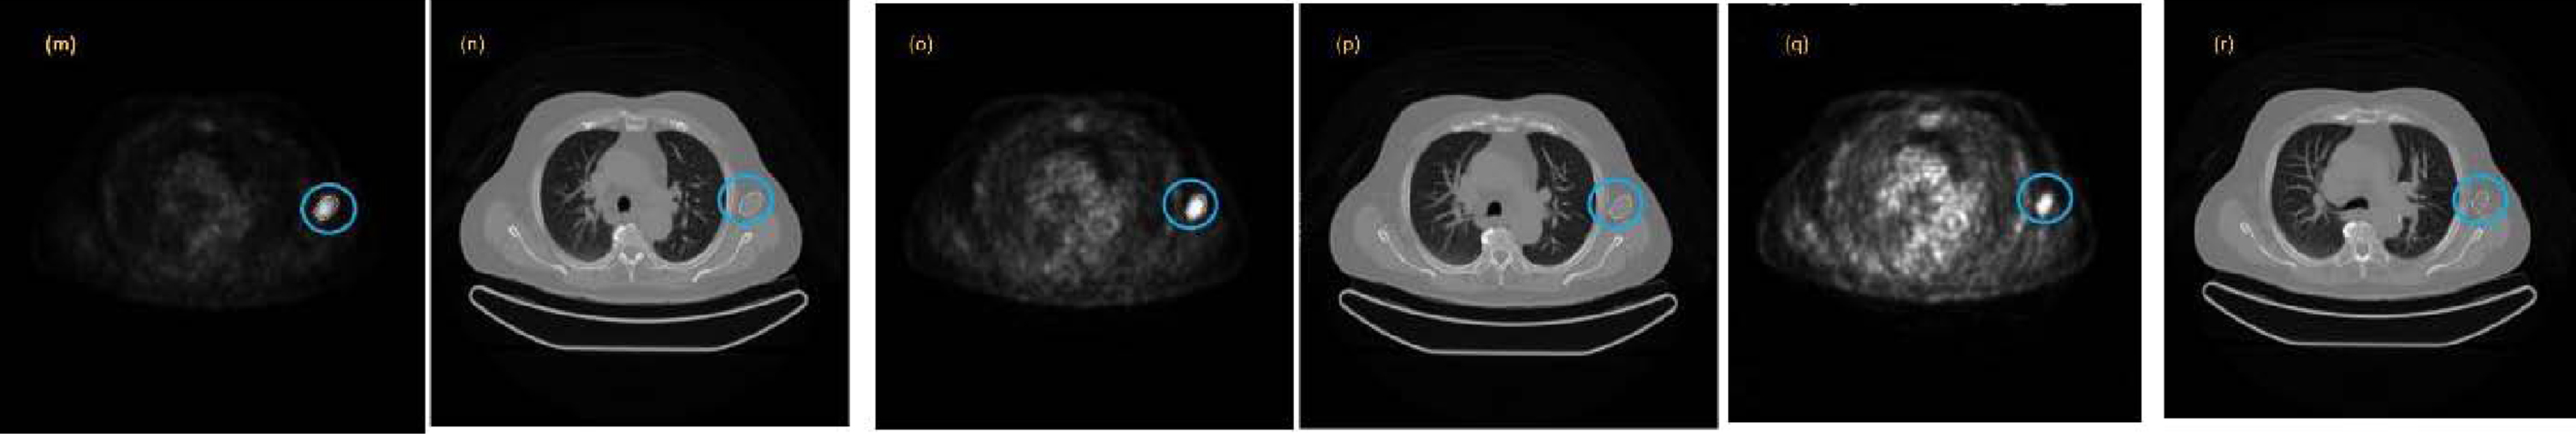
Example of a lesion segmented with nine cuts along all its sections, both in the PET image (m, o, q) and in the corresponding CT image (n, p, r).
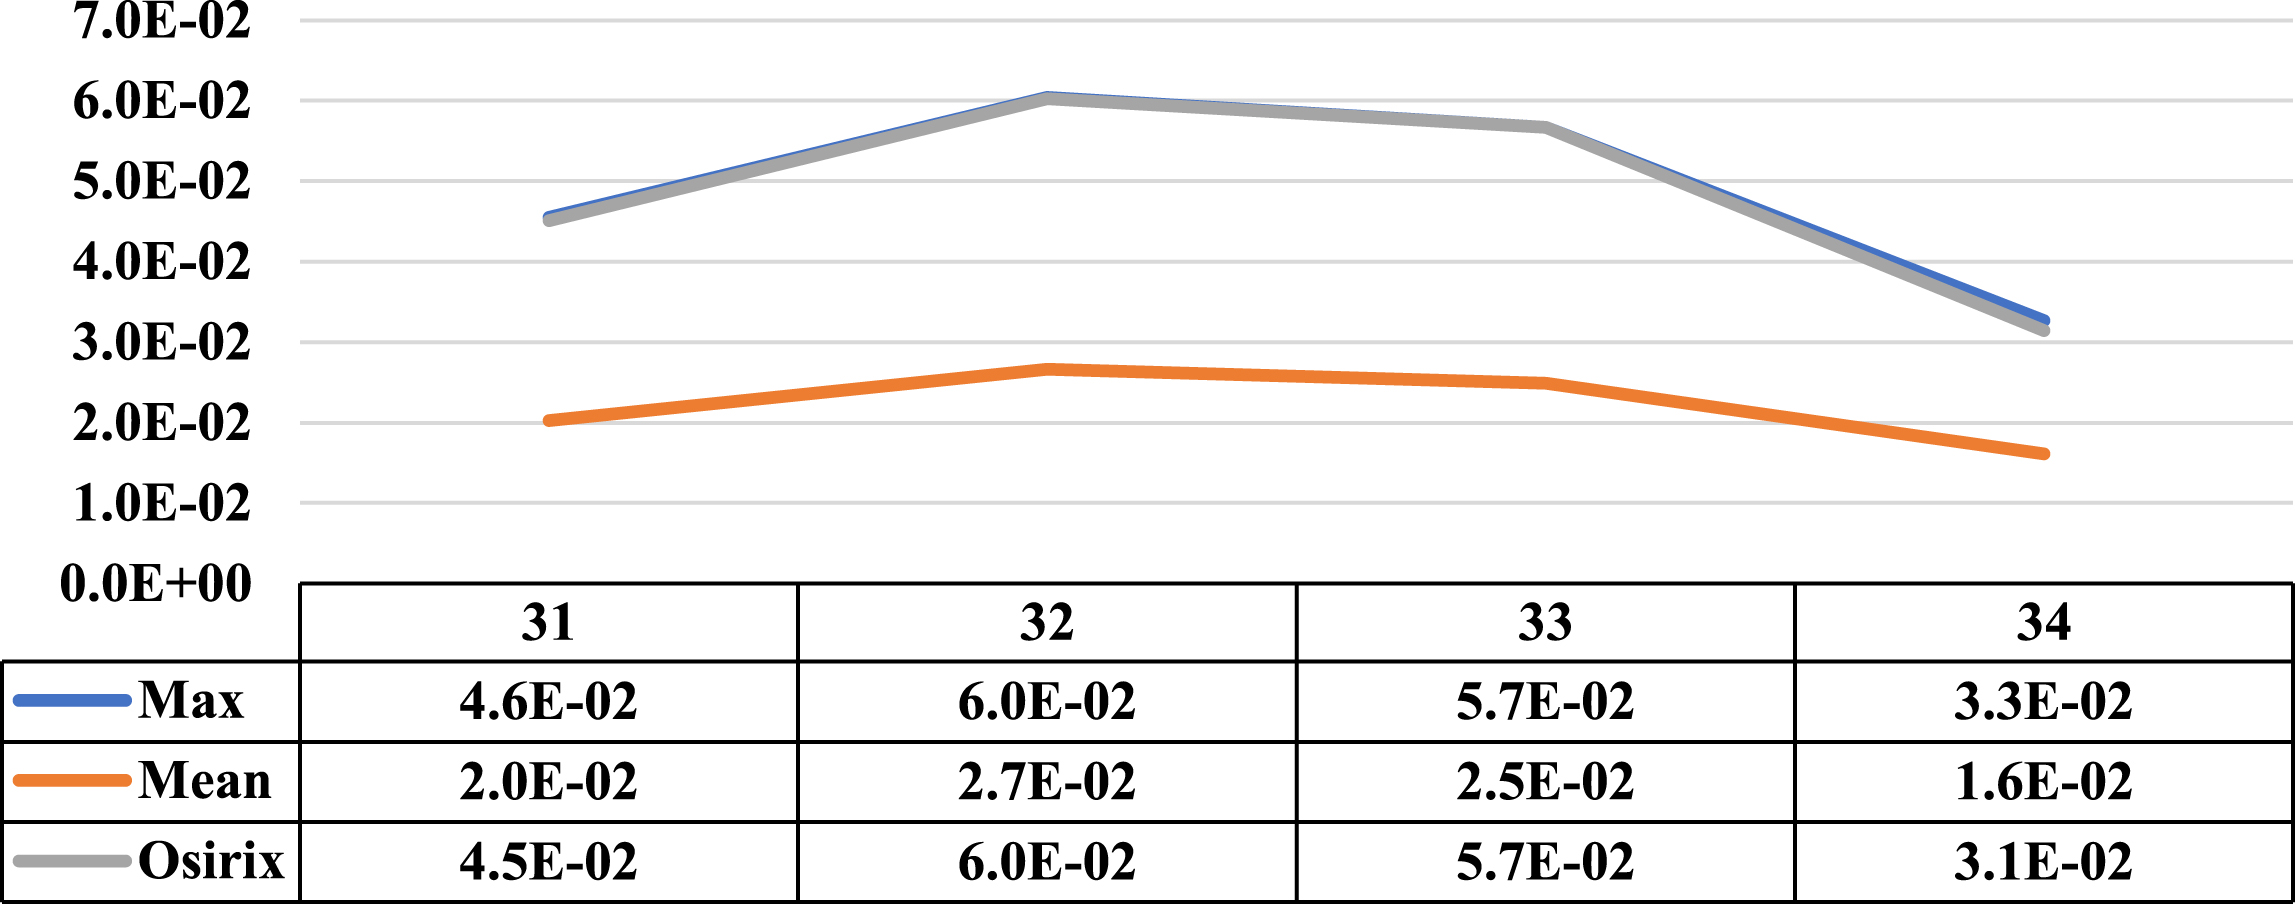
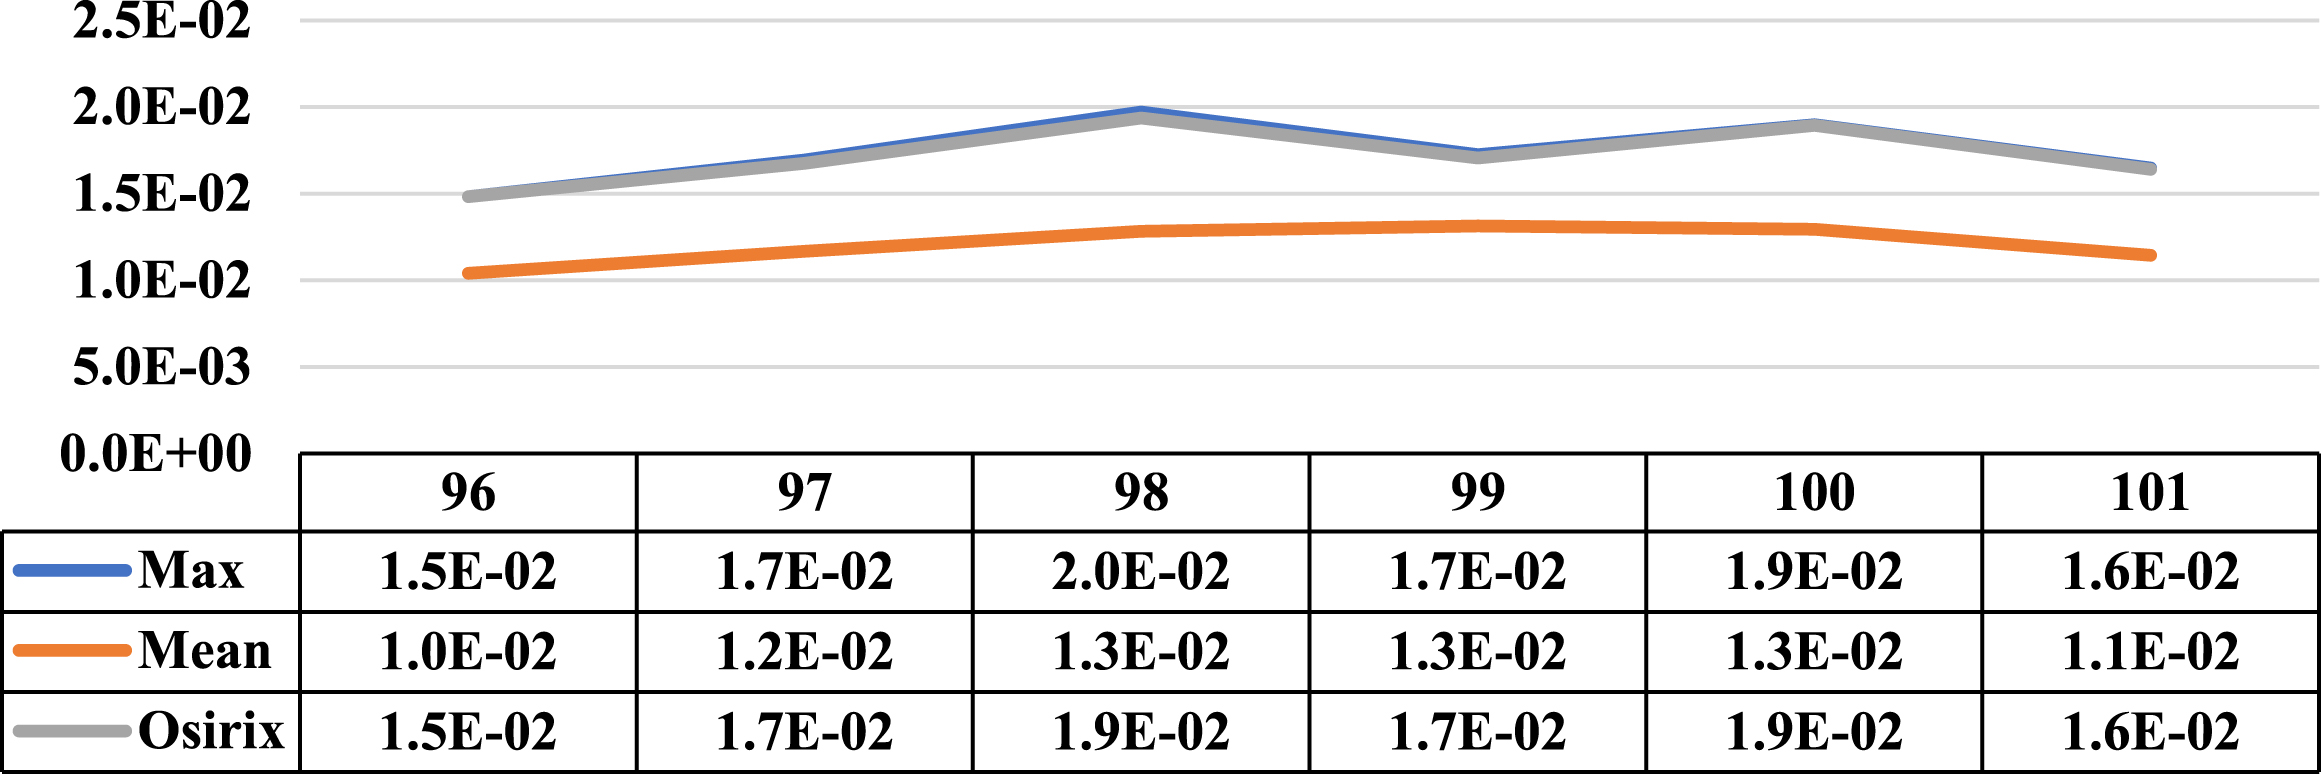
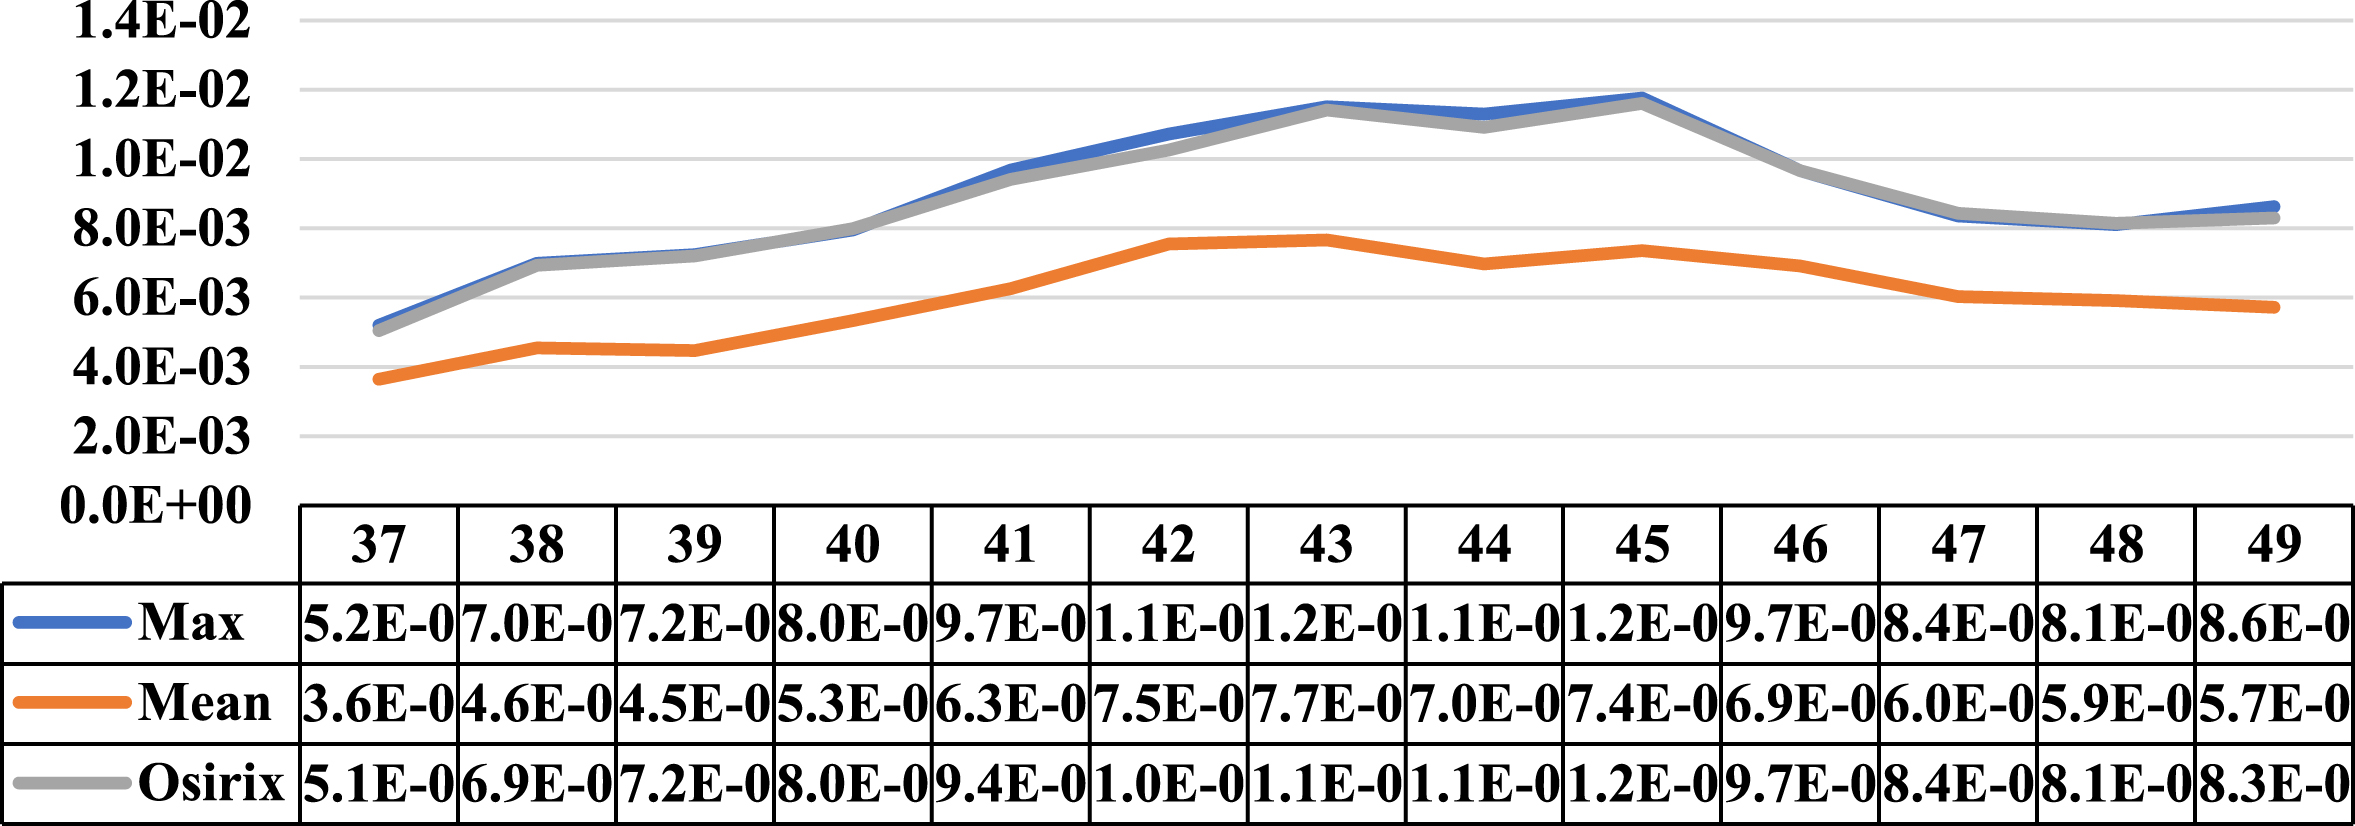
Three cases where the maximum and average concentration activities coincided in the same cut are presented in this section. Next to the illustrative graphs of the behaviour of both concentrations along the lesion sections, there is a table with the data for a better interpretation. Specifically, Figs. 12 to 14 show lesion graph of three lesions detected from one patient.
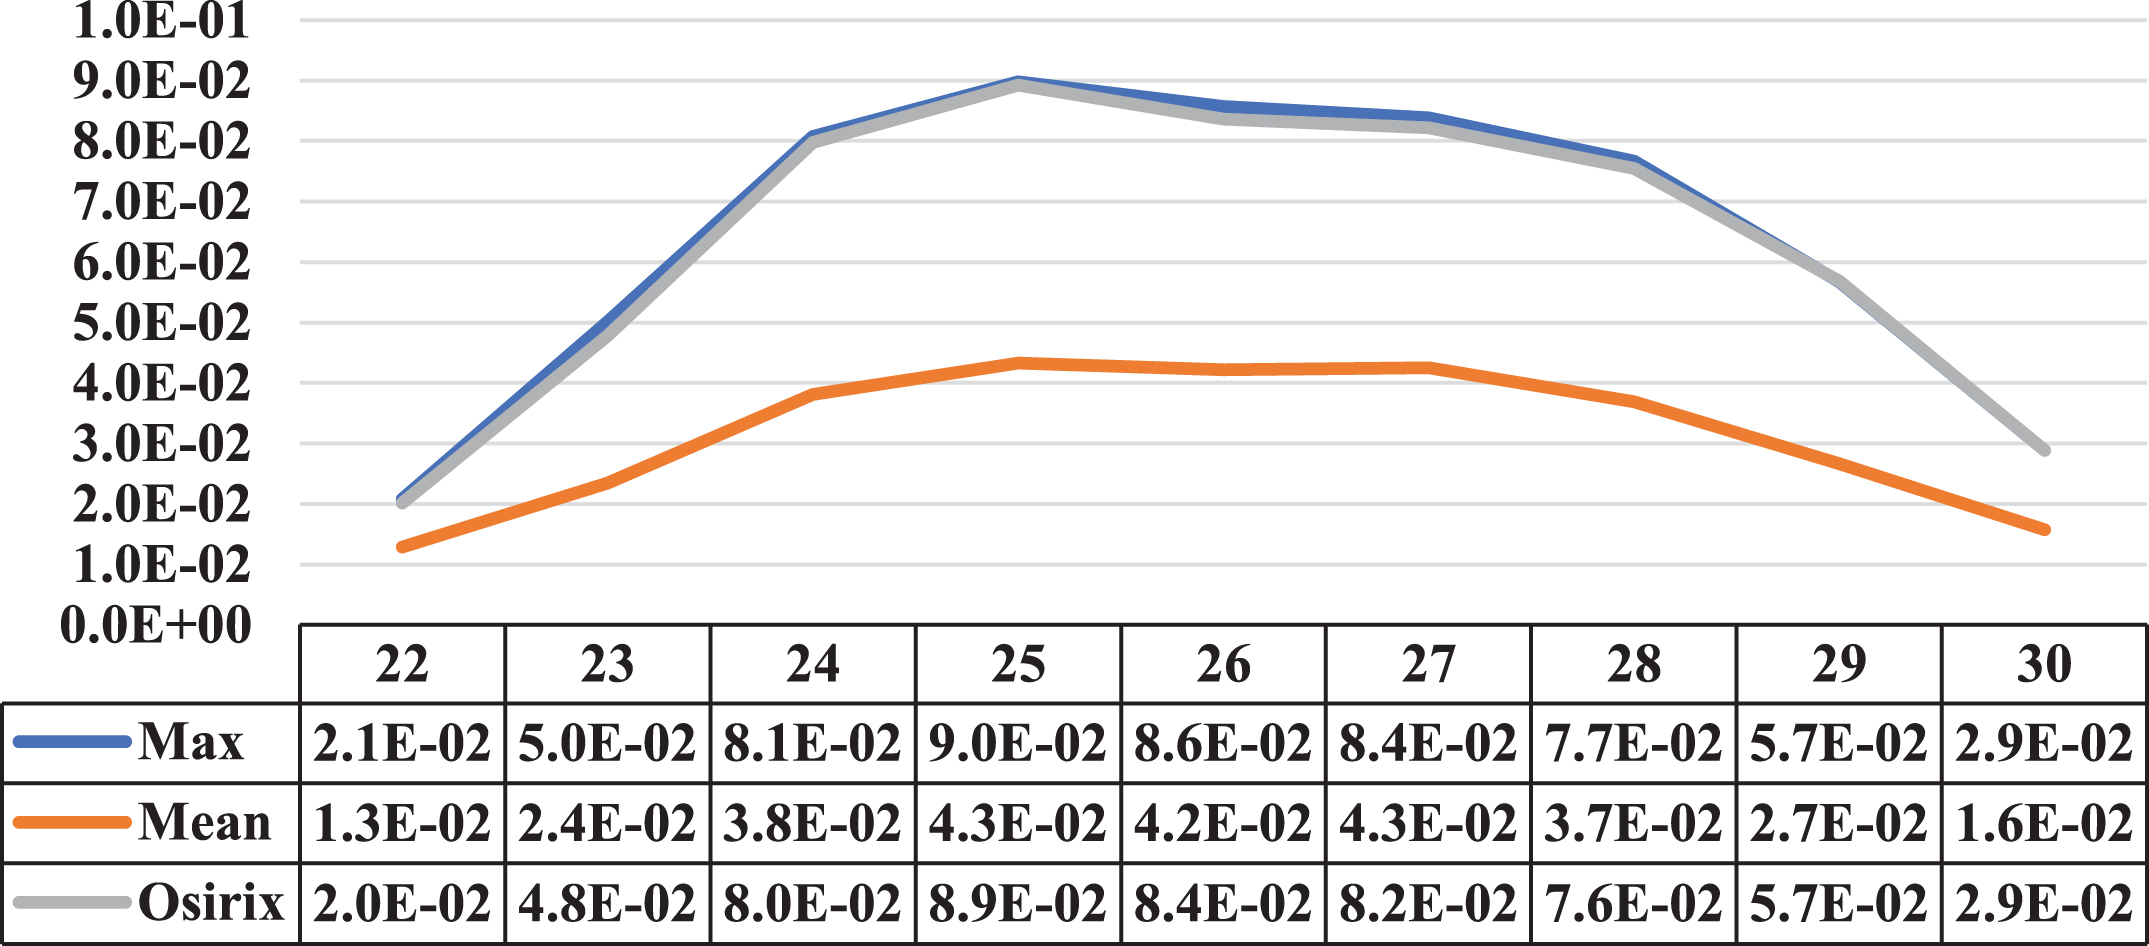
A Comparative graph of the behaviour of the Maximum Activity Concentration (max) and the Mean Activity Concentration (mean), both within the ROI, along one of the lesions of patient 1 Next to them is the graph of the behaviour of the Maximum Activity Concentration within ROI, obtained using specialised Osirix software. The cuts involved on the vertical axis, the concentrations in MBql/ml, and on the horizontal axis.
Comparative graph of the behaviour of the Maximum Activity Concentration (max) and the Mean Activity Concentration (mean), both within the ROI, along another of the lesions of patient 1. Next to them is the graph of the behaviour of the Maximum Activity Concentration within ROI obtained using specialized Osirix software. On the vertical axis, the concentrations in MBql/ml and on the horizontal axis the cuts involved.
Comparative graph of the behaviour of the Maximum Activity Concentration (max) and the Mean Activity Concentration (mean), both within the ROI, along one more of the lesions of patient 1. Next to them is the graph of the behaviour of the Maximum Activity Concentration within the ROI obtained using the specialized Osirix software. On the vertical axis the concentrations in MBql/ml and on the horizontal axis the cuts involved.
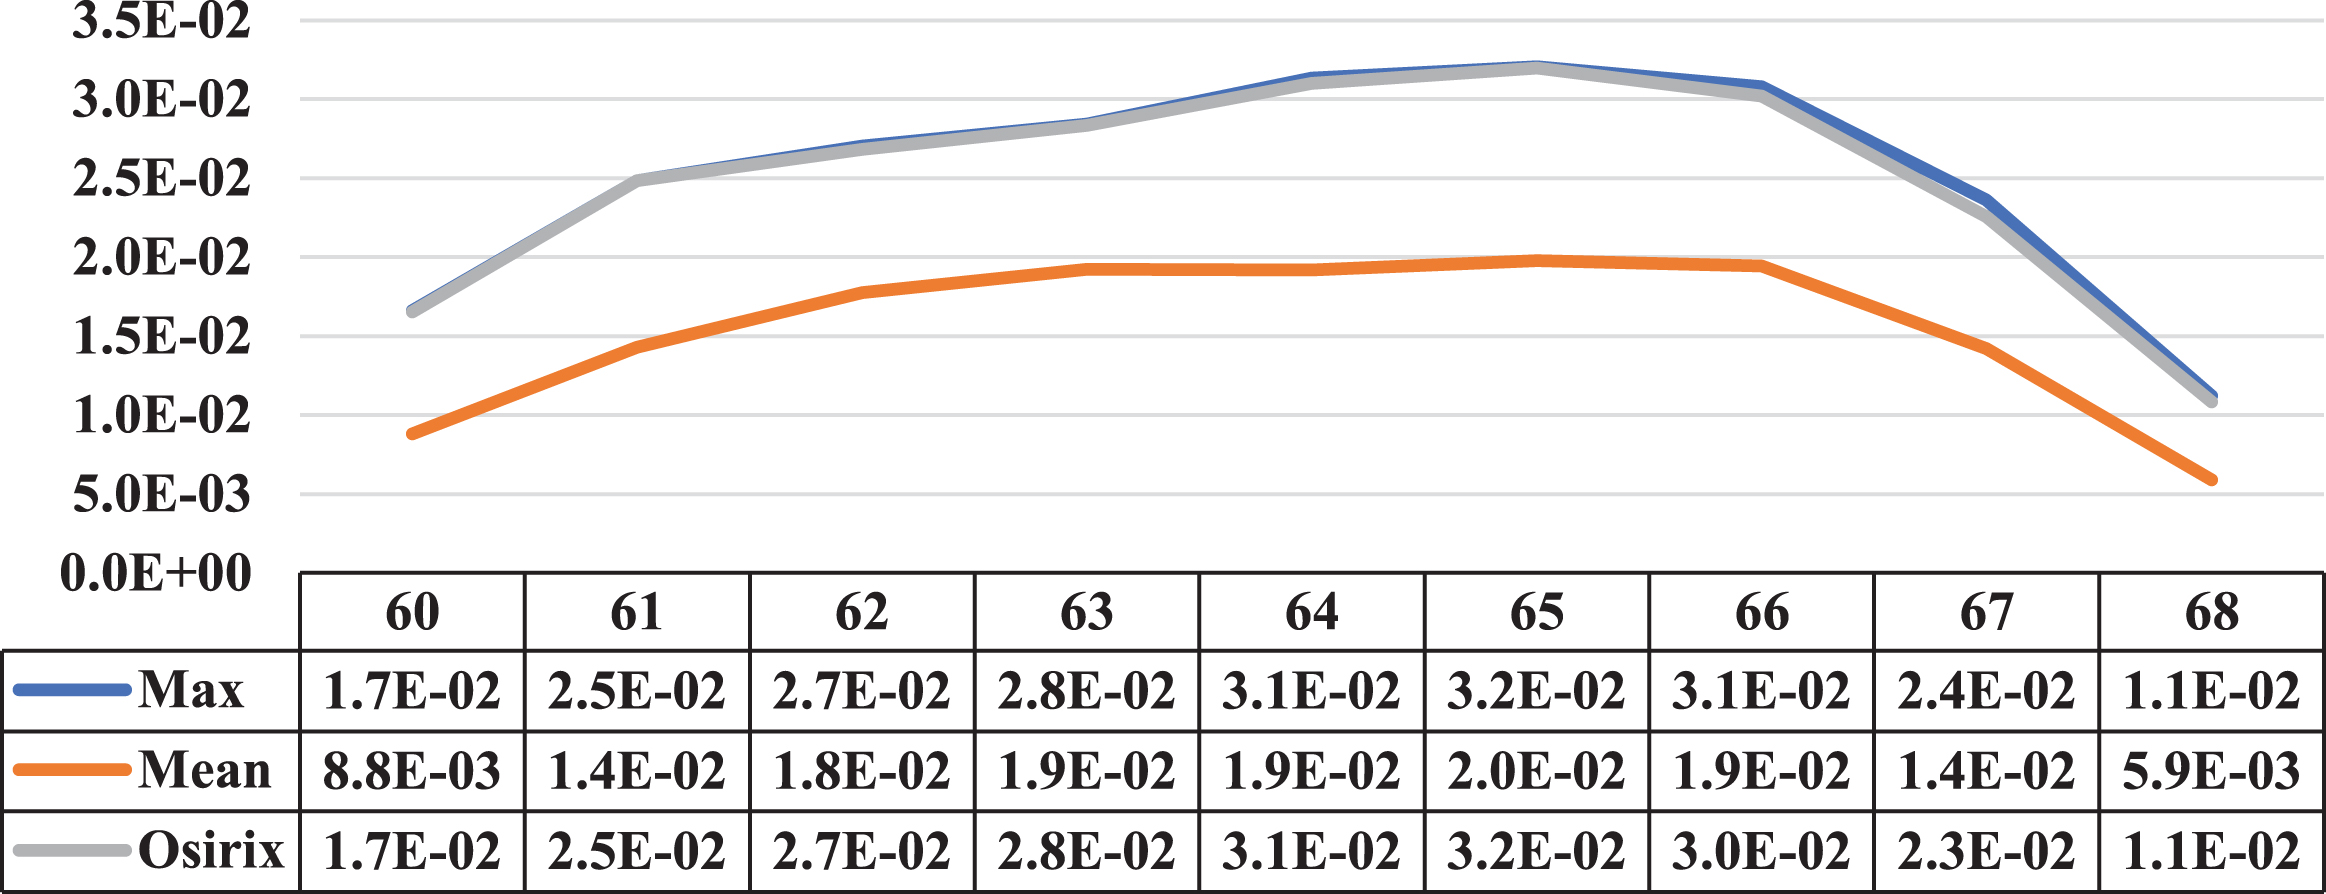
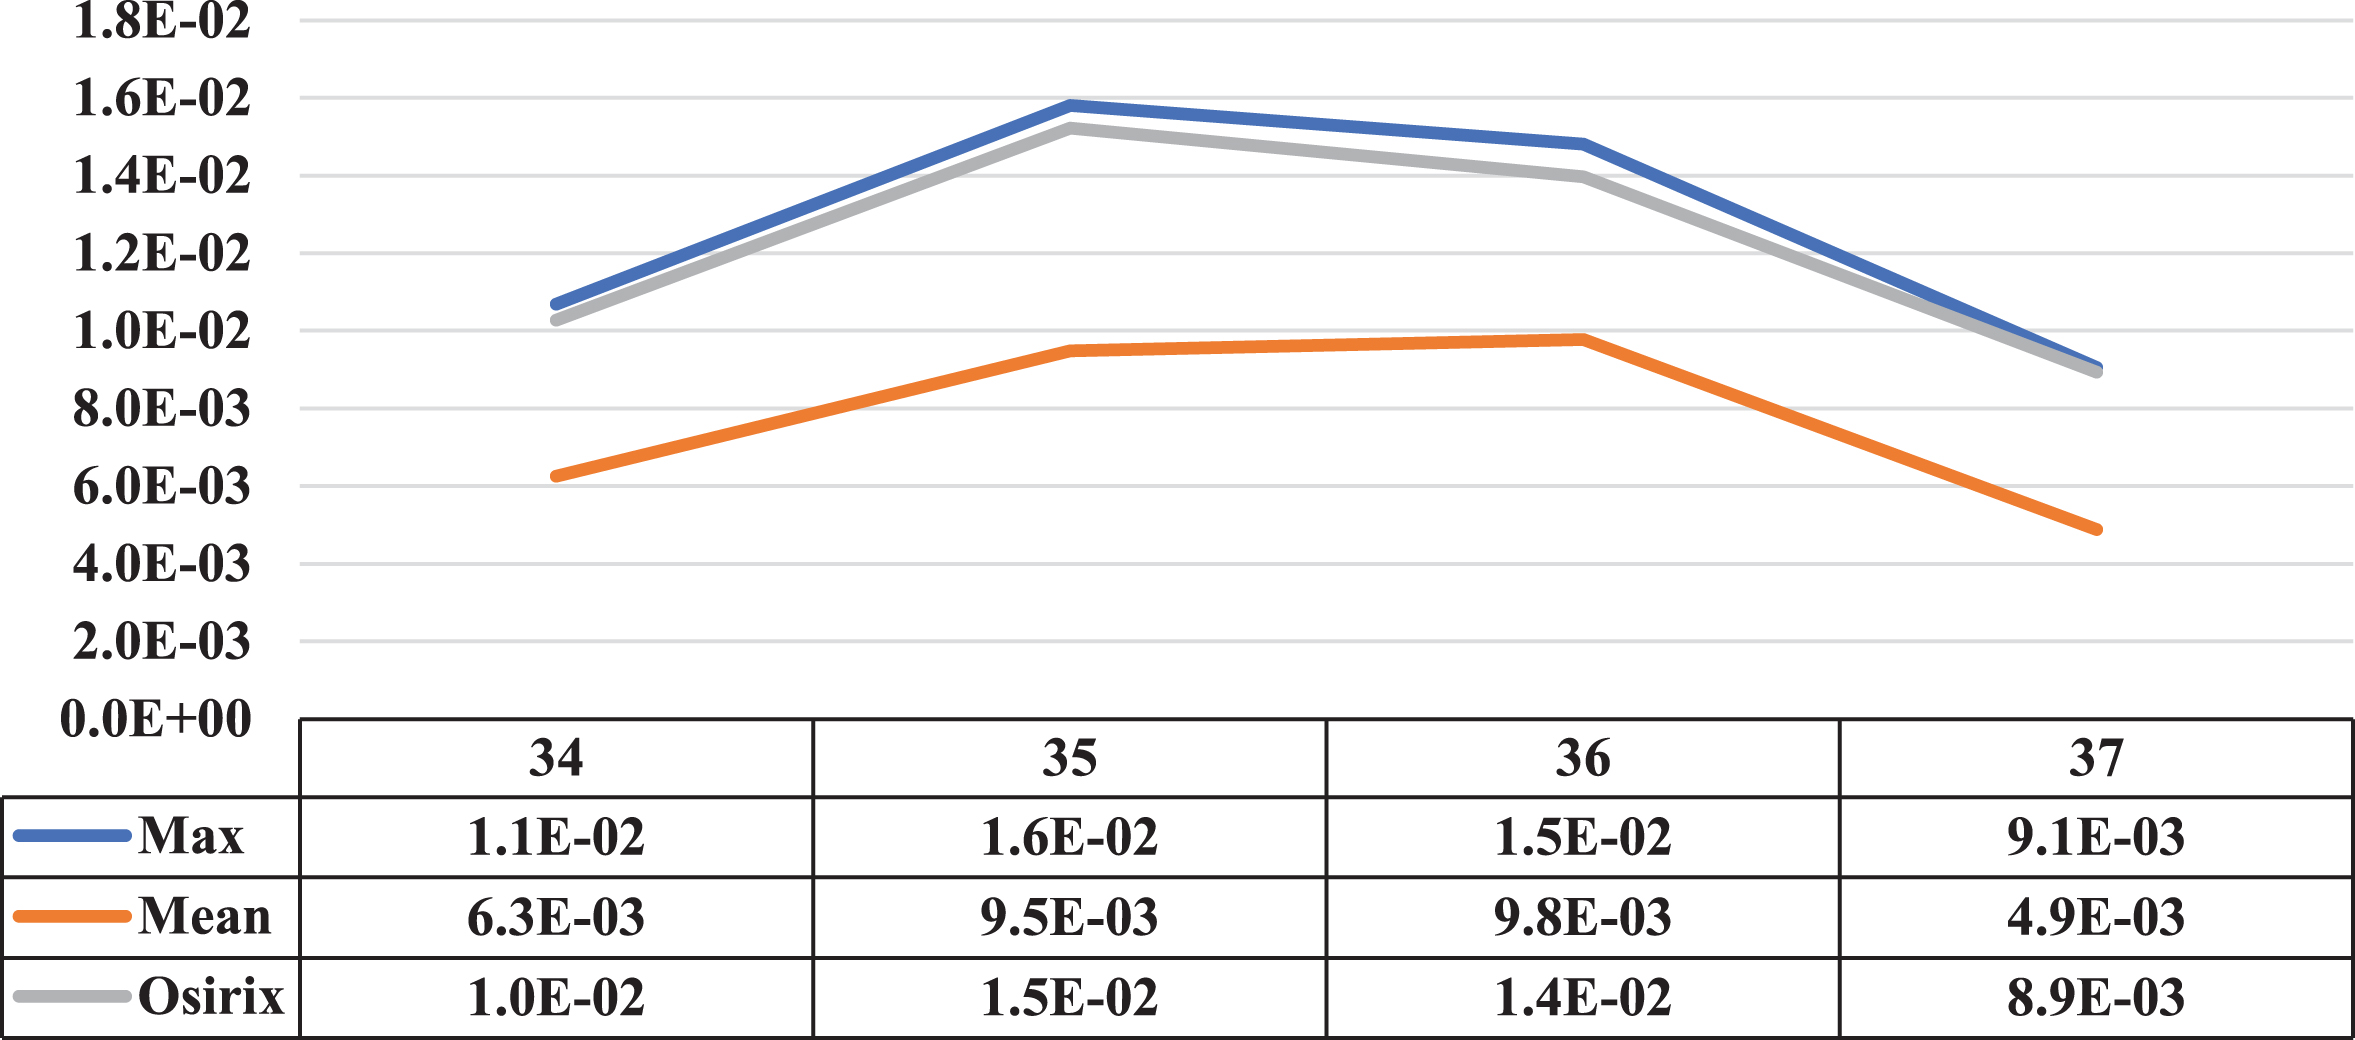
Three cases where the maximum and mean concentration activity did not coincide on the same slice are presented in this section. Next to the illustrative graphs of the behaviour of both concentrations along the lesion sections, there is a table with the data for a better interpretation as shown in Figs. 15 to 17 (for patients 2 and 3).
Comparative graph of the behaviour of the Maximum Activity Concentration (max) and the Mean Activity Concentration (mean), both within the ROI, along one of the lesions of patient 2. Next to them is the graph of the behaviour of the Maximum Activity Concentration within ROI obtained using specialized Osirix software. On the vertical axis, the concentrations in MBql/ml, and on the horizontal axis, the cuts involved.
Comparative graph of the behaviour of the Maximum Activity Concentration (max) and the Mean Activity Concentration (mean), both within the ROI, along one of the lesions of patient 7. Next to them is the graph of the behaviour of the Maximum Activity Concentration within ROI obtained using specialized Osirix software. On the vertical axis the concentrations in MBql/ml and on the horizontal axis the cuts involved.
Comparative graph of the behaviour of the Maximum Activity Concentration (max) and the Mean Activity Concentration (mean), both within the ROI, along one of the lesions of patient 3. Next to them is the graph of the behaviour of the Maximum Activity Concentration within ROI obtained using specialized Osirix software. On the vertical axis are the concentrations in MBql/ml, and on the horizontal axis are the cuts involved.
The correlation between intratumorally heterogeneity and standardised uptake value (SUV) in PET/CT images has been the subject of a substantial amount of academic investigation in recent years. Numerous studies have investigated the use of textural characteristics generated from PET or CT scans to enhance the characterization of intratumorally heterogeneity. These studies have focused on the ways in which intratumorally heterogeneity may influence the diagnosis and prognosis of different forms of cancer. In many different forms of cancer, the presence of intratumorally heterogeneity may influence how well a patient responds to treatment, how quickly the illness progresses, and whether they survive [38]. Textural characteristics that are obtained from PET or CT scans have the potential to provide additional prognostic information above and beyond what is supplied by conventional measures like SUVmax [39].
To better characterise and comprehend intratumorally heterogeneity and its influence on cancer diagnosis and therapy, there is a great deal of interest in the development of more sophisticated imaging tools and analytic methodologies. Therefore, the association between intratumorally heterogeneity and SUV in PET/CT scans is a topic of active study, and the studies that are now being conducted are expected to significantly increase our understanding of this phenomenon and its implications for the diagnosis and treatment of cancer. Table 1 shows the comparison of the proposed method with existing techniques. The standardised uptake value (SUV) and SUVmax are used in clinical practise to semi-quantitatively evaluate tissue radioactive tracer uptake, which may help diagnose and stage different medical disorders, including cancer. SUV measures the tracer concentration in a tissue related to the injected dosage and patient weight. SUVmax is the region’s highest SUV value. Univocal SUV and SUVmax evaluations improve medical imaging interpretation across institutions and practitioners. This measurement standardisation ensures precise, consistent, and similar imaging findings across patients, enabling more accurate diagnoses and treatment choices. Due to their precision, repeatability, and semi-quantitative tissue tracer uptake assessments, the SUV and SUVmax are commonly utilised in medical imaging analysis.
As seen in the Bibliographic review section, no articles were found with works similar to the ones exposed in this dissertation. Works related to the subject focus attention on the study of physiological and anatomical factors (e.g., amount of blood glucose and weight correction) that influence the value provided by the SUV [16]. An evaluation of the different means of obtaining the SUV was described in [17], in which it was concluded that, with different forms of evaluation, different diagnoses could be obtained even when dealing with the same patient. The variant among these methods described in the literature is how the ROI was chosen, which is associated with the activity concentration value required by the formula that defines the SUV. Therefore, for a univocal evaluation of the SUV in clinical practise, the SUVMax is mainly used [18]. This parameter is not influenced by the choice of ROI because the maximum value of the activity concentration does not depend on the area limited by it.
Quantitative measures may be derived from PET and CT images by the use of various mathematical and statistical techniques, which are used in the process of parameter estimation. Standardised uptake value, often known as SUV, is a semi-quantitative measure of tracer uptake that is frequently used in PET imaging. It is calculated by dividing the radioactivity concentration in the tissue of interest by the administered dosage of the tracer and then normalising that number to the patient’s body weight. SUV is often used in order to compare the amount of tracer uptake that occurs in various locations of interest or in various patients. Another method that may be used to estimate parameters from PET pictures is called kinetic analysis. Modelling the kinetics of the tracer in the tissue of interest and calculating the kinetic parameters such as the inflow and efflux rates, distribution volume, and clearance rate are required steps in this process. These measures may reveal tracer absorption and metabolism in the tissue of interest. CT imaging uses Hounsfield units (HU) to distinguish tissue types based on X-ray attenuation. HU values may estimate tissue density and identify areas of interest based on X-ray attenuation. The estimation of the parameters of PET and CT images is an essential part of quantitative imaging, and it has the potential to provide very helpful information for the purposes of diagnosis, prognosis, and the planning of therapy. To parameter estimation, a wide variety of mathematical and statistical approaches have been created, and most of the work that is being done now focuses on increasing the accuracy and repeatability of these methods.
PET/CT imaging is often used to analyse intratumoral heterogeneity and standardised uptake value (SUV) to get insight into tumour features and therapeutic efficacy. In order to anticipate patient outcomes and choose the most effective therapy, PET/CT scans may give in-depth information on the metabolic activity and heterogeneity inside a tumour. Variation in metabolic rate inside a tumour is referred to as intratumoral heterogeneity. This may be measured in several ways, including by analysing the tumour’s texture and metabolic tumour volume (MTV). Radiation oncologists should take intratumoral heterogeneity’s association with poor prognosis and treatment resistance into account when assessing patients. PET/CT imaging also makes use of the standardised uptake value (SUV) to evaluate tumour features. The tumour’s SUV may be interpreted as a measure of its metabolic activity by comparing the quantity of tracer absorption in the tumour to that in the surrounding tissue. Variation exists across tumour types and imaging protocols, but higher SUV values indicate more metabolic activity inside the tumour. Standardised uptake value and intratumoral heterogeneity are both helpful factors in PET/CT imaging for assessing tumour features and predicting patient outcomes.
Researchers can create more successful treatment regimens for patients with esophageal cancer if they have a better grasp of these factors and the role they play in radiation therapy. An essential measure for gauging tumour metabolic activity and radiation treatment efficacy is the average activity concentration along the tumour. PET/CT imaging is useful for evaluating this factor because it shows where and how much radiotracer was taken up by the tumour. Researchers may learn about the metabolic activity of the tumour as a whole and the degree of its heterogeneity by evaluating the average activity concentration along the tumour. In the context of radiation therapy for esophageal cancer, this knowledge may help forecast patient outcomes and choose the most effective therapies. In general, higher metabolic activity and more aggressive tumours are linked to a greater activity concentration along the tumour. However, depending on criteria including tumour subtype, stage, and location, there may be a wide range in the concentration of activity inside a tumour. When it comes to radiation therapy for esophageal cancer, calculating the average activity concentration throughout the tumour may help anticipate patient outcomes and choose the best course of treatment. Researchers can improve treatment recommendations for patients by gaining a deeper grasp of this parameter and its relevance in PET/CT imaging.
For image manipulation on both PET and CT, adjustments associated with image registration had to be made, which is inherent to the equipment itself. The main adjustments were related to the difference between the spatial resolutions of both images and the difference in the spatial origin of the images. The position in the plane of the first pixel of the image and the spacing between slices are different between both images and do not have a relationship between them. These adjustments are performed automatically with software developed based on the DICOM protocol. This protocol stipulates filling in the information used above, among others, in the “metadata” field contained in the file with the image itself. Therefore, for evaluating PET and CT images in software not developed for these, it is necessary to be familiar with the “metadata” field of the DICOM protocol [15].
The segmentation method used for PET and CT images was not a very specific process, as it worked with images of different areas of the body. It is important, in future works, to develop a more specific segmentation programme for an area or biological tissue, if necessary and based on the principle used here. Other important limitations associated with the method chosen to search for lesion contours are the choice of the seed pixel and the distance for a pixel to be considered a near neighbour [19]. The first value greatly influences the result since the grey value of this first point defines the character of the following pixels, and the second value determines when the growth will be suspended. In other words, choosing a small distance might not be enough to stop growth at the edges of the lesion, and choosing a greater distance would lead to a larger region than the one sought.
In relation to the real images, it was seen that not all lesions that present PET activity have a noticeable delimitation in the corresponding CT image. This fact occurs mainly because the PET/CT device in the clinical application has less resolution than a specific device for CT images [20]. However, according to the radiologist, it is possible to increase the contrast of the CT image by inserting a radiopaque contrast in the patient, but that would not be a process applied frequently because it exposes the patient to large amounts of radiation, in addition to being economically unfeasible. For all these reasons, we suggest the study of more robust CT image segmentation methods and pre-processing methods that can highlight the limits of the lesions, allowing their evaluation.
In about 70% of cases, it was found that the cut with the highest value of maximum activity concentration within the ROI throughout the entire lesion is also the cut with the highest mean activity value. This fact alone indicates that the maximum value used in the SUV has discriminatory potential. In the other cases, it was seen that the peaks of maximum and average activity concentration were found in different sections. This finding raised some questions: What is the relationship between cellular metabolism and lesion size? Which cut would best represent the metabolism of the lesion, the one where the peak concentration of maximum activity is higher or the one where the concentration of average activity is higher? Is cellular metabolism evenly distributed? During treatment, will this behaviour be the same? Which lesion is more aggressive, the one with a high average activity concentration along the lesion or the one with a higher maximum activity concentration but a small average activity concentration along it?
In other words, it would be important to study the relationship between the maximum concentration value and the maximum mean value on PET/CT images to see if there is additional information with diagnostic potential.
Conclusion
The elaboration of this work made it possible to know the behaviour of the average and maximum Standardised Uptake Value (SUV) throughout the lesion. It was observed that this behaviour is not the same in all the evaluated lesions. This finding led to the generation of some hypotheses for the continuation of the study. Regarding the processing performed, it was observed that the proposed segmentation method met the cases in question. Still, there is room for the search for more robust and even pre-processing methods to make the edges more evident in the CT images. Using the PET image as a mask over the CT image allowed us to centre the study on the region of interest. Similar procedures were not found in the literature. It was impossible to find edges in all the CT images; therefore, the mask obtained from the PET image was used instead as the edge of the lesion. A complementary study would be necessary to know if the edge obtained directly from the PET image, when used as a substitute for the edge of the CT, could be of any clinical value. The proposed method’s limitation is that its application is restricted to lesions with punctual metabolic activity (the lesion is well located spatially). Further methodological development would be necessary to cover lesions with diffuse metabolic activity.
Footnotes
Funding statement
This research was funded by Deputy for Research and Innovation- Ministry of Education, Kingdom of Saudi Arabia for this research through a grant (NU/IFC/ENT/01/008) under the institutional Funding Committee at Najran University, Kingdom of Saudi Arabia.
Acknowledgment
Authors would like to acknowledge the support of the Deputy for Research and Innovation- Ministry of Education, Kingdom of Saudi Arabia for this research through a grant (NU/IFC/ENT/01/008) under the institutional Funding Committee at Najran University, Kingdom of Saudi Arabia.
Conflict of interest
The author declares that there is no conflict of interest.
Data availability
The data used to support the findings of this study are included in the article.