
Abstract
BACKGROUND:
Neoadjuvant chemotherapy (NAC) has been regarded as one of the standard treatments for patients with locally advanced breast cancer. No previous study has investigated the feasibility of using a contrast-enhanced spectral mammography (CESM)-based radiomics nomogram to predict pathological complete response (pCR) after NAC.
OBJECTIVE:
To develop and validate a CESM-based radiomics nomogram to predict pCR after NAC in breast cancer.
METHODS:
A total of 118 patients were enrolled, which are divided into a training dataset including 82 patients (with 21 pCR and 61 non-pCR) and a testing dataset of 36 patients (with 9 pCR and 27 non-pCR). The tumor regions of interest (ROIs) were manually segmented by two radiologists on the low-energy and recombined images and radiomics features were extracted. Intraclass correlation coefficients (ICCs) were used to assess the intra- and inter-observer agreements of ROI features extraction. In the training set, the variance threshold, SelectKBest method, and least absolute shrinkage and selection operator regression were used to select the optimal radiomics features. Radiomics signature was calculated through a linear combination of selected features. A radiomics nomogram containing radiomics signature score (Rad-score) and clinical risk factors was developed. The receiver operating characteristic (ROC) curve and calibration curve were used to evaluate prediction performance of the radiomics nomogram, and decision curve analysis (DCA) was used to evaluate the clinical usefulness of the radiomics nomogram.
RESULTS:
The intra- and inter- observer ICCs were 0.769–0.815 and 0.786–0.853, respectively. Thirteen radiomics features were selected to calculate Rad-score. The radiomics nomogram containing Rad-score and clinical risk factor showed an encouraging calibration and discrimination performance with area under the ROC curves of 0.906 (95% confidence interval (CI): 0.840–0.966) in the training dataset and 0.790 (95% CI: 0.554–0.952) in the test dataset.
CONCLUSIONS:
The CESM-based radiomics nomogram had good prediction performance for pCR after NAC in breast cancer; therefore, it has a good clinical application prospect.
Keywords
List of abbreviations
Full name
Apparent diffusion coefficient
Carbohydrate antigen 125
Carbohydrate antigen 153
Cranial caudal
Carcinoembryonic antigen
Contrast-enhanced spectral mammography
Confidence interva
Chinese society of clinical oncology
Decision curve analysis
Estrogen receptor
Epidermal growth factor receptor-2
Intraclass correlation coefficients
Immunohistochemistry
Selection operator
Mediolateral oblique
Magnetic resonance imaging
Neoadjuvant chemotherapy
National comprehensive cancer network
Pathological complete response
Positron emission tomography/computed tomography
Progesterone receptor
Receiver operating characteristic
Regions of interest
Introduction
Neoadjuvant chemotherapy (NAC) has been regarded as one of the standard treatments for patients with locally advanced breast cancer, and for patients with triple-negative or human epidermal growth factor receptor-2 (HER2)–positive tumor biological expression [1]. It is a preoperative systemic treatment that can provide information to predict the prognosis for each patient, detect the sensitivity of the tumor to the drug, reduce the local size of the tumor, reduce the scope of surgery, and even achieve pathological complete response (pCR) [2]. pCR is the absence of invasive tumor cells within excised breast and related tissues following NAC [3], while non-pCR refers to patients with partial response or no response, meaning that invasive cancer remains after NAC. Patients with pCR have a better prognosis than those with non-pCR [4, 5]. However, only 10% –50% of patients with breast cancer can achieve pCR after NAC treatment [6]. Some patients cannot benefit from NAC and are negatively influenced by the toxicity and adverse effects caused by chemotherapy owing to their poor pathological response. Therefore, a noninvasive and effective method for predicting pCR in patients undergoing NAC without delaying patient treatment is needed.
Several studies have demonstrated the potential of Magnetic resonance imaging (MRI) in predicting the efficacy of NAC. Some MRI studies [7–9] have a certain guiding importance in clinical practice. However, breast MRI has some problems. It is expensive and time consuming, and its high sensitivity leads to additional examinations and biopsies [10, 11]. MRI also has some relative contraindications, such as patients with metal substances in their bodies and patients suffering from claustrophobia, which limits the application of MRI [12]. Contrast-enhanced spectral mammography (CESM) is a new, simpler, and more cost-effective test and is a better supplement for breast imaging than MRI. CESM combines an iodinated contrast agent with conventional mammography to improve diagnostic accuracy [13]. Many pieces of evidence indicate that the performance of CESM is equivalent to that of MRI, and CESM can improve specificity and reduce false-positive interpretations [14].
With the rapid development of technology, radiomics has developed rapidly as a new tool for noninvasive tumor analysis [15]. Radiomics has shown excellent performance in predicting breast cancer prognosis [16, 17]. Related studies on CESM-based radiomics have also achieved good results in predicting axillary lymph node metastasis in breast cancer, even neoadjuvant chemotherapy-insensitive breast cancers, and in distinguishing benign and malignant breast lesions [18–22]. Among them, the radiomics of CESM applied to neoadjuvant chemotherapy is only to predict the efficacy of neoadjuvant chemotherapy [19, 22]. However, the application of CESM-based radiomics before surgery to predict the pathological complete response of patients after NAC has not been reported yet.
The purpose of this study was to develop a CESM-based radiomics nomogram for pCR prediction in patients with locally advanced breast cancer.
Materials and methods
Patients
This study was approved by the institutional review board of Yantai Yuhuangding Hospital, and the patients right to informed consent was waived.
A total of 196 patients with locally advanced breast cancer who had underwent CESM examination before NAC treatment from March 2018 to January 2021 were enrolled. The inclusion criteria were as follows: (i) the patients had biopsy-confirmed unilateral primary invasive breast cancer before NAC; (ii) the patients received no treatment other than NAC and completed the full course of NAC; (iii) surgery was followed by the completion of NAC, and postoperative pathology was obtained; and (iv) the CESM examination was conducted 2 weeks before NAC. The exclusion criteria were as follows: (i) multifocal, bilateral, or occult breast cancer; (ii) lack of pre-treatment CESM image or clinical data; (iii) the patients who received non-standard treatment or did not complete the NAC regimen; (iv) no surgery was performed or the results of postoperative pathological immunohistochemistry (IHC) were incomplete; and (v) the image quality of CESM is insufficient to obtain measurement results. Finally, 118 patients were included in this study and randomly divided into a training set (n = 82, included 21 pCR and 61 non-pCR) and a test set (n = 36, included 9 pCR and 27 non-pCR) in a ratio of 7:3. We also repeated this training/testing process 6 times to prevent biases from in case partition. The screening diagram of the study population is shown in Fig. 1.
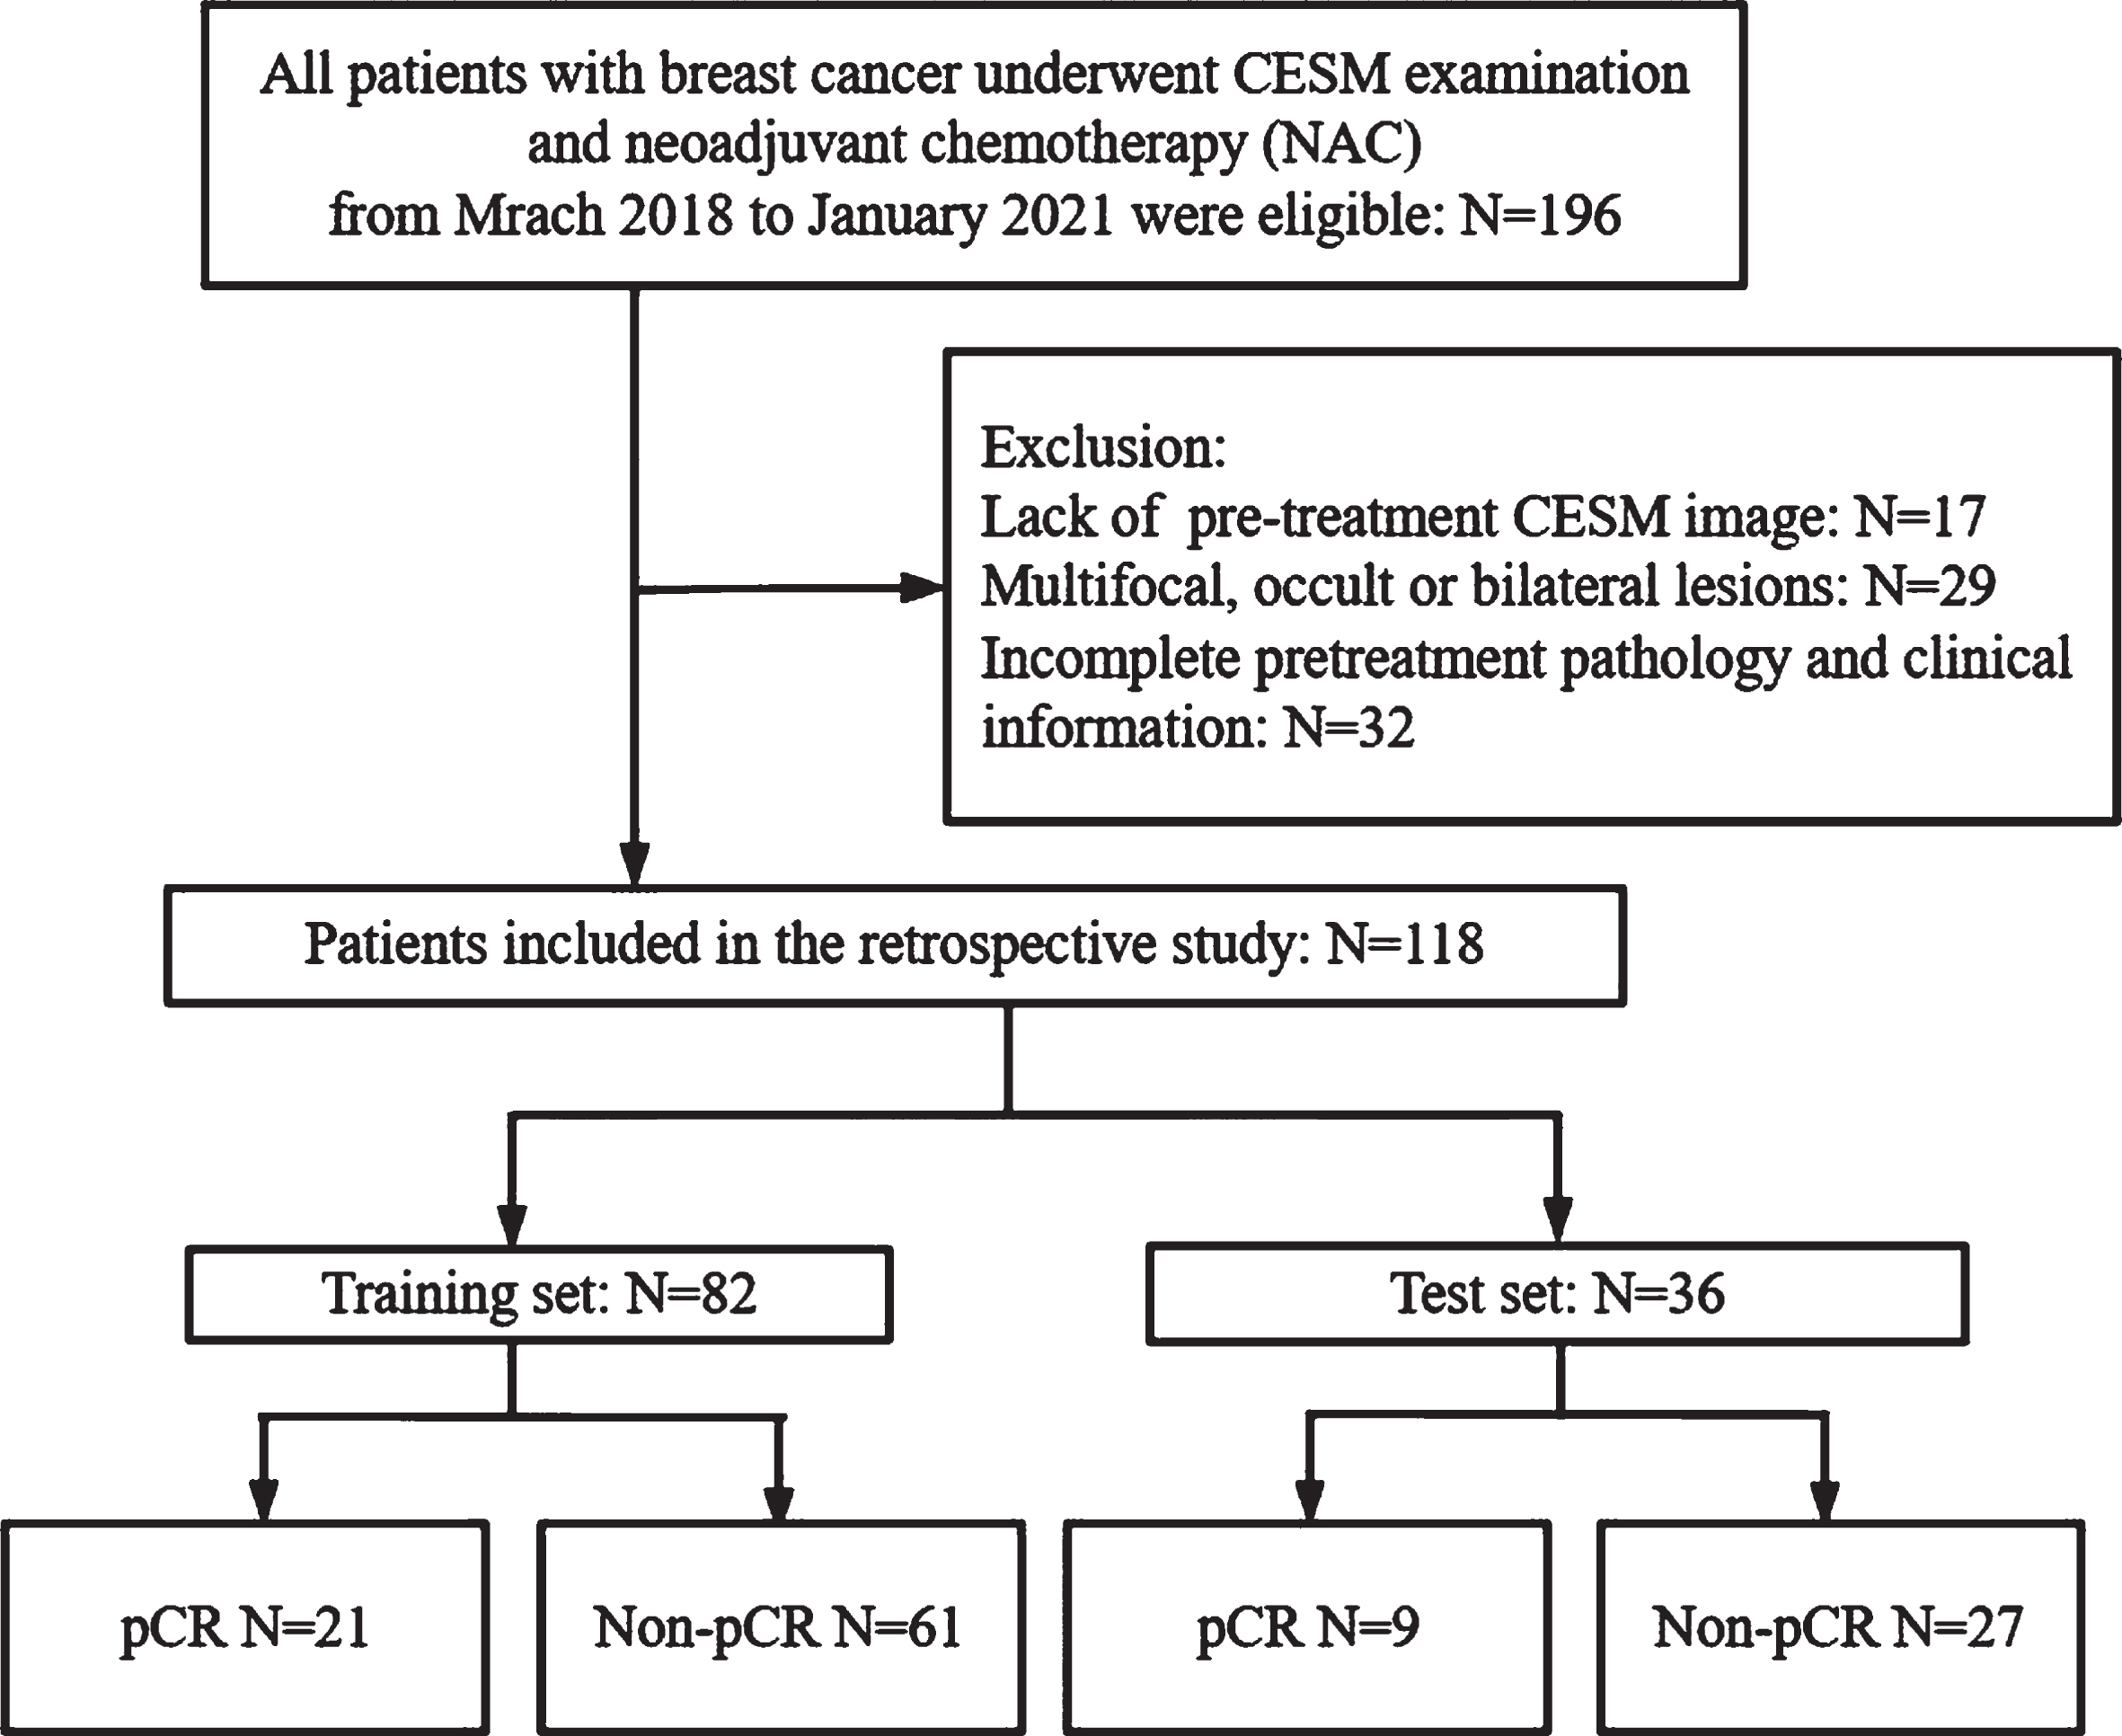
Flow chart of patient enrolment.
The CESM used in our breast center is based on a full-digital breast machine (Senographe DS SenoBright, GE Healthcare). The contrast agent Omnipaque 300 (GE Healthcare, Inc., Princeton, NJ) is injected through the patient’s upper arm vein at a dose of 1.5 mg/kg and a flow rate of 3.0 mL/s. About 2 min after the contrast agent is injected, the bilateral breasts are pressed in the cranial caudal (CC) view and mediolateral oblique (MLO) view. Moreover, low- and high-energy images are rapidly acquired. Usually, the contralateral mammary gland is photographed first and then the suspicious side is photographed. Bilateral breast CC and MLO views are photographed at low- and high-energy exposures. Low- and high-energy exposures are continuously performed within 1.5 s, and then recombined images are obtained using a post-processing system. The low-energy image is similar to a conventional mammogram, whereas the recombined image shows the contrast medium uptake [13].
Clinical and histopathological characteristics
Clinical and histopathological data were obtained from the medical record system, including age, carcinoembryonic antigen (CEA), carbohydrate antigen 153 (CA153), carbohydrate antigen 125 (CA125), and molecular subtype (according to the status of estrogen receptor [ER], progesterone receptor [PR], epidermal growth factor receptor-2 [HER2], and proliferation marker Ki-67). Immunohistochemical (IHC) staining shows the stained tumor cell nuclei:< 1% positive tumor cells mean ER/PR negative and≥1% positive tumor cells mean ER/PR positive [23]. The cutoff level for Ki67 is 20%. The IHC results for HER2 status were interpreted as follows:+3 was defined as positive, 0 to+1 was defined as negative, and+2 required a fluorescence in situ hybridization (FISH) of the biopsied tissue for validation. The non-amplified FISH results were considered HER2–, whereas the amplified FISH results were defined as HER2 + [24]. Tumors were stratified into molecular subtypes using IHC surrogate markers. Luminal A was defined as ER positive, PR (20%) positive, HER2 negative, and Ki67 < 20%. Luminal B was defined as ER positive and/or PR (< 20%) positive, HER2 negative or ER/PR/HER2 positive, or ER and PR positive but Ki67 > 20%. HER2 positive was defined as ER/PR negative and HER2 positive. The triple-negative group was defined as ER/PR/HER2 negative.
NAC and pathological assessment
In accordance with the National Comprehensive Cancer Network (NCCN) guideline and Chinese Society of Clinical Oncology (CSCO) guideline for breast cancer, all patients received six or eight cycles of NAC before breast surgery. The NAC regimens were based on taxane (11 patients, 9.3%) or taxane and anthracycline (107 patients, 90.7%). All HER2-positive patients also received trastuzumab or trastuzumab and pertuzumab. Surgical operations were performed 2–3 weeks after completing NAC.
pCR is defined as the absence of residual infiltrating primary breast cancer (which can be ductal carcinoma in situ) and residual regional lymph nodes after completing NAC [3], while non-pCR refers to patients with partial response or no response, meaning that invasive cancer remains after NAC.
Region of interest segmentation and radiomic feature extraction
The radiologist 1 (with 9 years of experience in breast imaging) manually segmented the tumor regions of interest (ROIs) by following the outline of the tumor on the low-energy and recombined images of the CC and MLO views on ITK-SNAP software (version 3.8.0). The sample ROI segmentation is shown in Fig. 2.
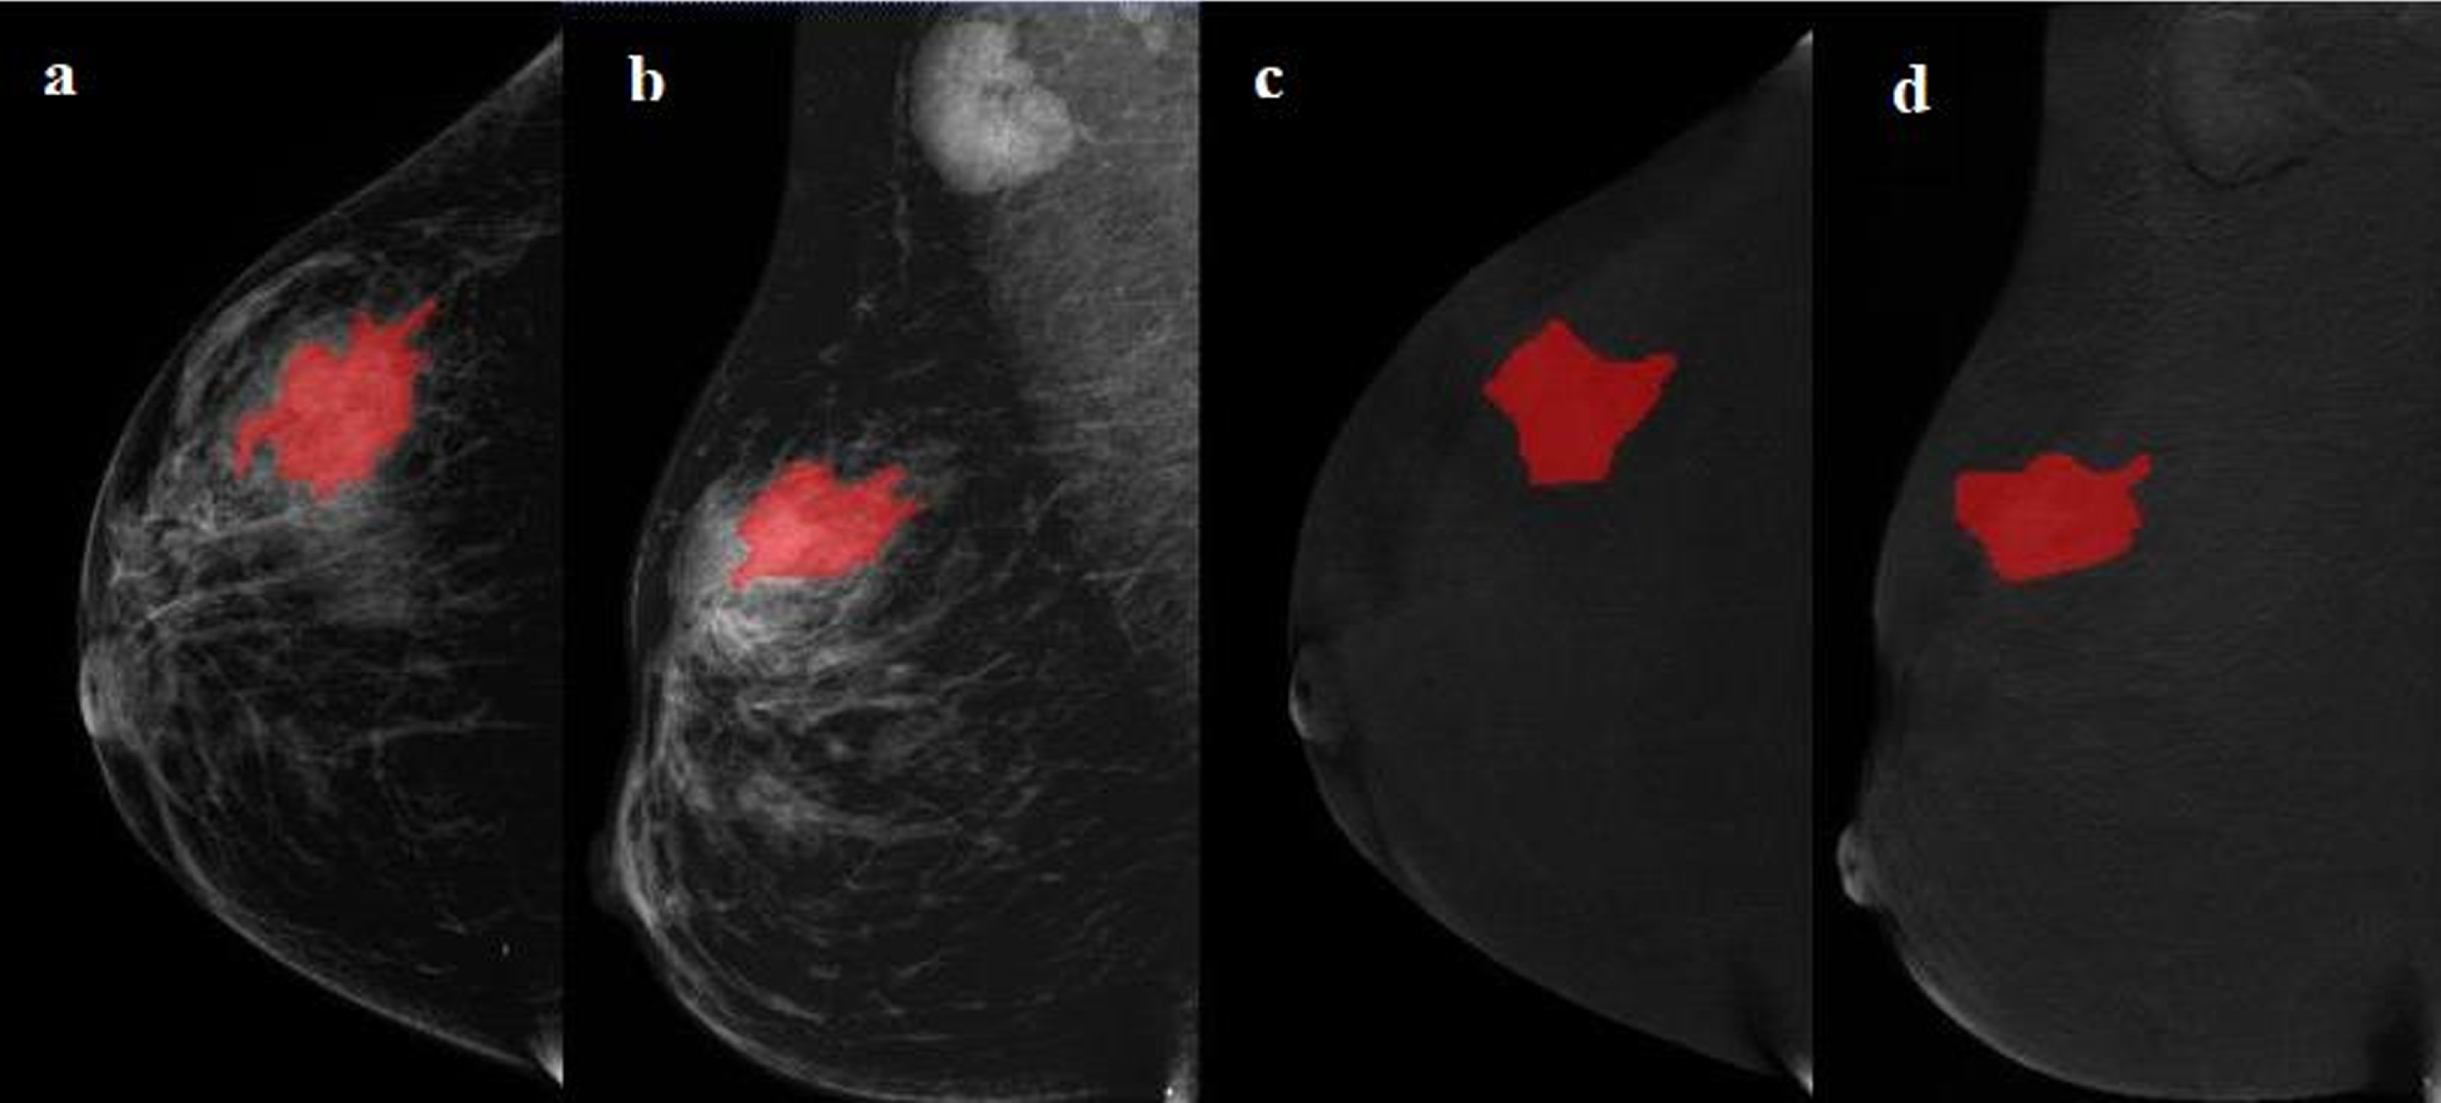
Examples of regions of interest (ROIs) segmentation on contrast-enhanced spectral mammography (CESM) images. (A, C) The low-energy and recombined images with cranial caudal (CC) view. (B, D) The low-energy and recombined images with mediolateral oblique (MLO) view. The ROIs of breast lesions were drawn manually on low-energy and recombined images, respectively.
Image preprocessing is required before feature extraction. It includes the standardization of the gray value of the ROI, discretization of gray level, and image resampling. The μ±3σ method is used to standardize the image of the ROI. Image normalization can improve the texture difference features between two image classes [25]. Therefore, normalization was performed first, and the gray value greater than μ±3σ was set to 0. The gray scale of the image was adjusted by gray scale discretization. In this study, 64 gray levels were used to reduce the calculation time and effect of noise [18, 26]. Finally, the image was re-sampled to ensure that the scale of the feature was unchanged, and the anisotropic pixel was converted to 0.1 mm×0.1 mm [27].
Radiomics features were then extracted from each ROI of the low-energy images and the recombined images from CC and MLO views respectively using “RadiomicsFeatureExtractor” by Pyradiomics, including three categories: first-order features (270), shape-based features (14), and texture features (1125).
Intraclass correlation coefficients (ICCs) were used to assess the intra- and inter-observer agreement of ROI feature extraction to evaluate the reproducibility of radiomics feature extraction. The CESM images of 30 patients were randomly selected to calculate ICCs. Radiologist 1 repeated the ROI segmentation after 2 months to evaluate intra-observer agreement. Radiologist 2 (with 13 years of experience in breast imaging) segmented the ROIs manually and extracted features using the same method to evaluate inter-observer agreement. ICC > 0.75 was considered a good agreement, and features with ICCs > 0.75 within the training set were used for further analysis.
Radiomics feature selection and radiomics score construction
Radiomics features were selected by low variance method, SelectKBest method, and least absolute shrinkage and selection operator (LASSO) in the training set. In the low variance method, the threshold was 0.8, and the eigenvalues of the variance larger than 0.8 were included. In the SelectKBest method, the features with p < 0.05 between NAC pCR and NAC non-pCR were selected. LASSO regression was finally used for selecting the key radiomics features with non-zero coefficients. The 7-fold cross-validation was used to select the optimal tuning parameter (alpha) of LASSO via minimum criteria. Radiomics score (Rad-score) was calculated using a linear combination of the final selected features weighted by their LASSO coefficients. The area under the receiver operating characteristic (ROC) curve (AUC) value of Rad-score was calculated to assess the predictive performance of radiomics features.
Radiomics nomogram construction and assessment
In the training set, univariate and multivariate logistic regression were used to select independent predictive factors, including clinic radiological characteristics (age, CEA, CA153, CA125, ER, PR, HER-2, Ki67, tumor size, and molecular subtypes) and Rad-score. Factors with p < 0.05 in were selected as independent predictive factors and were integrated into the multivariate logistic regression. Likelihood ratio test with backward step-down selection was applied for logistic regression. With Akaike information as the criterion, when the minimum Akaike information criterion was reached, the step-by-step process was stopped. A radiomics nomogram incorporating Rad-score and independent predictive factors was built by multivariate logistic regression, which could be used as a convenient visible tool to predict the individual probability of NAC pCR. To train the model, we performed a grid search and fivefold cross-validation to find the optimal parameters in the training set and examine the performance of generalization. The accuracy of the model was taken as the indicator for extracting the model parameters. We then trained the model using the entire training set.
The predictive performance of the radiomics nomogram was evaluated by ROC in the training and test sets. In addition, the point on the ROC curve farthest from the diagonal line corresponds to the largest Youden index, which is calculated by the sum of sensitivity and specificity and then subtracting 1 over all the possible threshold values. This index was used to determine the cutoff value for dividing the patients with NAC pCR and NAC non-pCR. Accuracy, sensitivity, and specificity were calculated in the training and test sets according to the cutoff value.
The agreement between the observed results and predictive probability was assessed by calibration curve. Decision curve analysis (DCA) was employed to evaluate the net benefit of the radiomics nomogram under the different threshold probabilities.
Statistical analysis
The statistical analysis was conducted in Python (version 3.6), R software (version 3.4.1), and SPSS (version 26). The categorical clinical variables (ER, PR, HER-2, Ki67, and molecular subtypes) between training and test sets were compared using the chi-square test or Fisher’s exact test, whereas continuous clinical variables (age, tumor size, CEA, CA153, and CA125) were analyzed by two-sample t test. The “glmnet” and “glm” packages were used for LASSO logistic regression. The “rms” and “pROC” packages were used for nomogram construction and ROC analysis, respectively. The “Calibration Curves” package was used for calibration curve analysis, whereas the “Decision Curve” package was used for DCA. p < 0.05 was interpreted as statistically significant difference.
Results
Clinical characteristics
A total of 118 patients were finally enrolled in this retrospective study. 82 patients (with 21 pCR, 61 non-pCR) were included in the training set, and 36 patients (with 9 pCR, 27 non-pCR) were included in the test set. The patient characteristics in the training and test sets are shown in Table 1. Significant differences in ER (p = 0.048) and PR (p = 0.002) but no significant differences in age (p = 0.135), diameter (p = 0.624), CEA (p = 0.329), CA153 (p = 0.525), CA152 (p = 0.354), HER2 (p = 0.405), Ki-67 (p = 0.440), and molecular subtype (p = 0.202) were found between NAC pCR and NAC non-pCR in the training set.
Clinico-radiological characteristics in the training and validation cohorts
Clinico-radiological characteristics in the training and validation cohorts
SD, standard deviation; CEA, carcinoembryonic antigen; CA153, carbohydrate antigen 153; CA125 carbohydrate antigen 125; ER, estrogen receptor; PR, progesterone receptor; HER2, epidermal growth factor receptor-2; Ki-67, proliferation marker; pCR, pathological complete response.
A total of 5636 radiomics features were extracted from each patient’s CESM images. The intra- and inter- observer ICCs among 5636 radiomics features were 0.769–0.815 and 0.786–0.853, respectively, which represented good reproducibility in radiomics feature extraction.
Moreover, 4110 radiomics features were selected by low variance method, and 33 radiomics features were further selected by SelectKBest method. Finally, the optimal 13 radiomics features with non-zero coefficients in LASSO logistic regression were selected, whereas the optimal value of alpha was 0.0198, and the optimal –log(alpha) was 1.7 (Fig. 3, Table 2). The Rad-score of each patient was calculated by the 13 radiomics features.
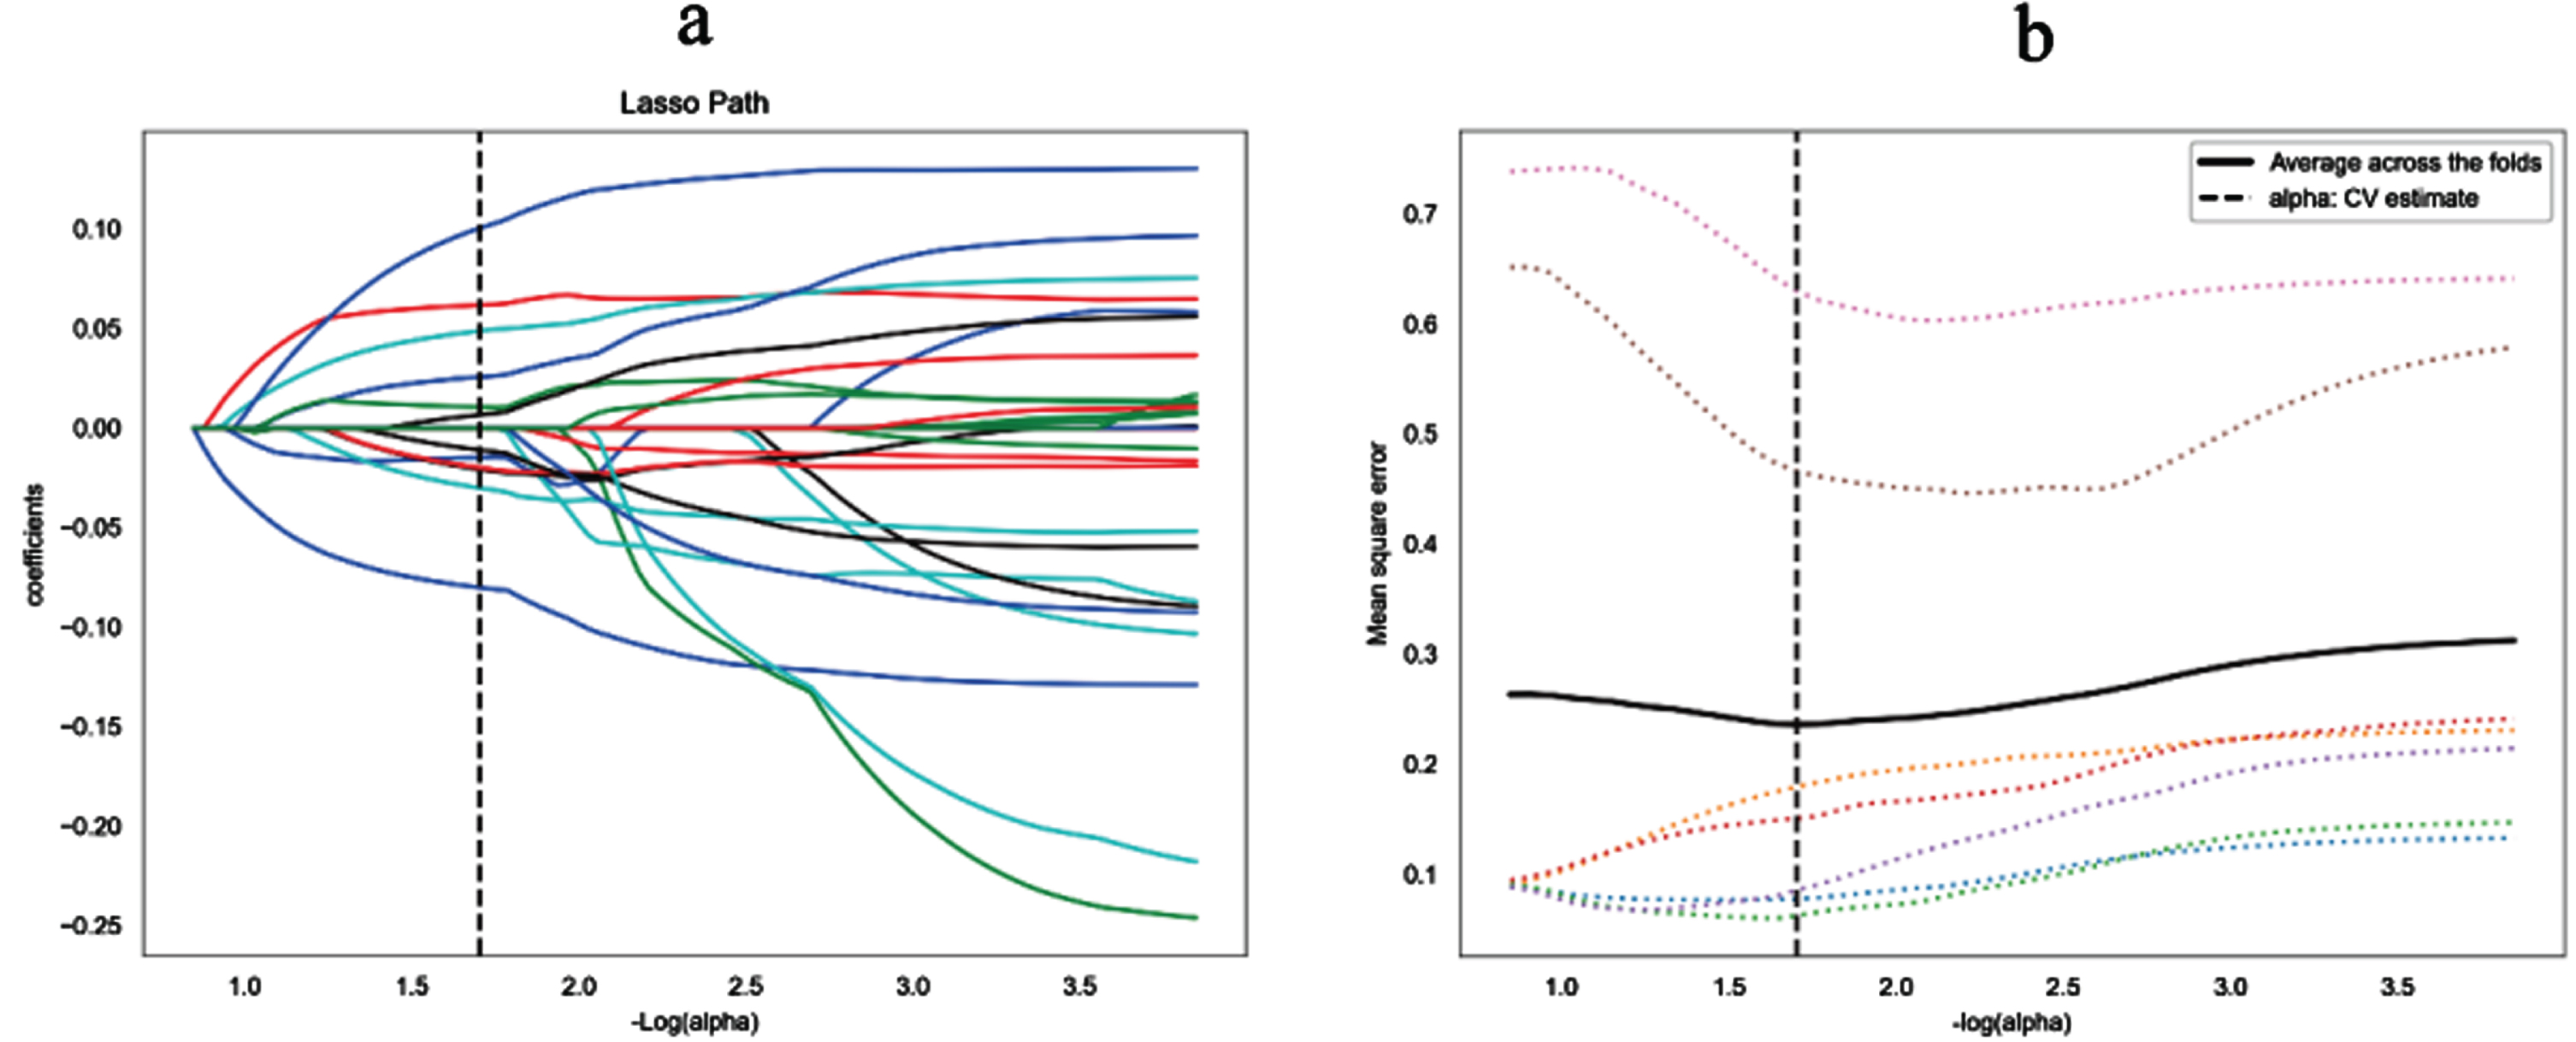
Lasso algorithm for radiomics features selection. (a) Least absolute shrinkage and selection operator (LASSO) coeffificient profifiles of the 33 features. The y-axis represents coeffificient of each feature. The optimal value of alpha was 0.0198, and the optimal -log(alpha) was 1.7, where 13 features with non-zero coeffificient were selected. (b) Mean square error path using seven-fold cross-validation.
Radiomics feature for establishing radiomics score
glszm, gray level size zone matrix; glrlm, gray level run length matrix; gldm, gray level dependence matrix; glcm, gray level co-occurrence matrix.
In univariate logistic regression, ER (P = 0.049), PR (P = 0.001), molecular subtypes (P = 0.034), and Rad-score (P < 0.01) were included into multivariate logistic regression. After multivariate logistic regression, Rad-score and PR were remarkably related to pCR after NAC (both P < 0.001). Thus, the radiomics nomogram was developed with the combination of Rad-score and PR as shown in Fig. 4.
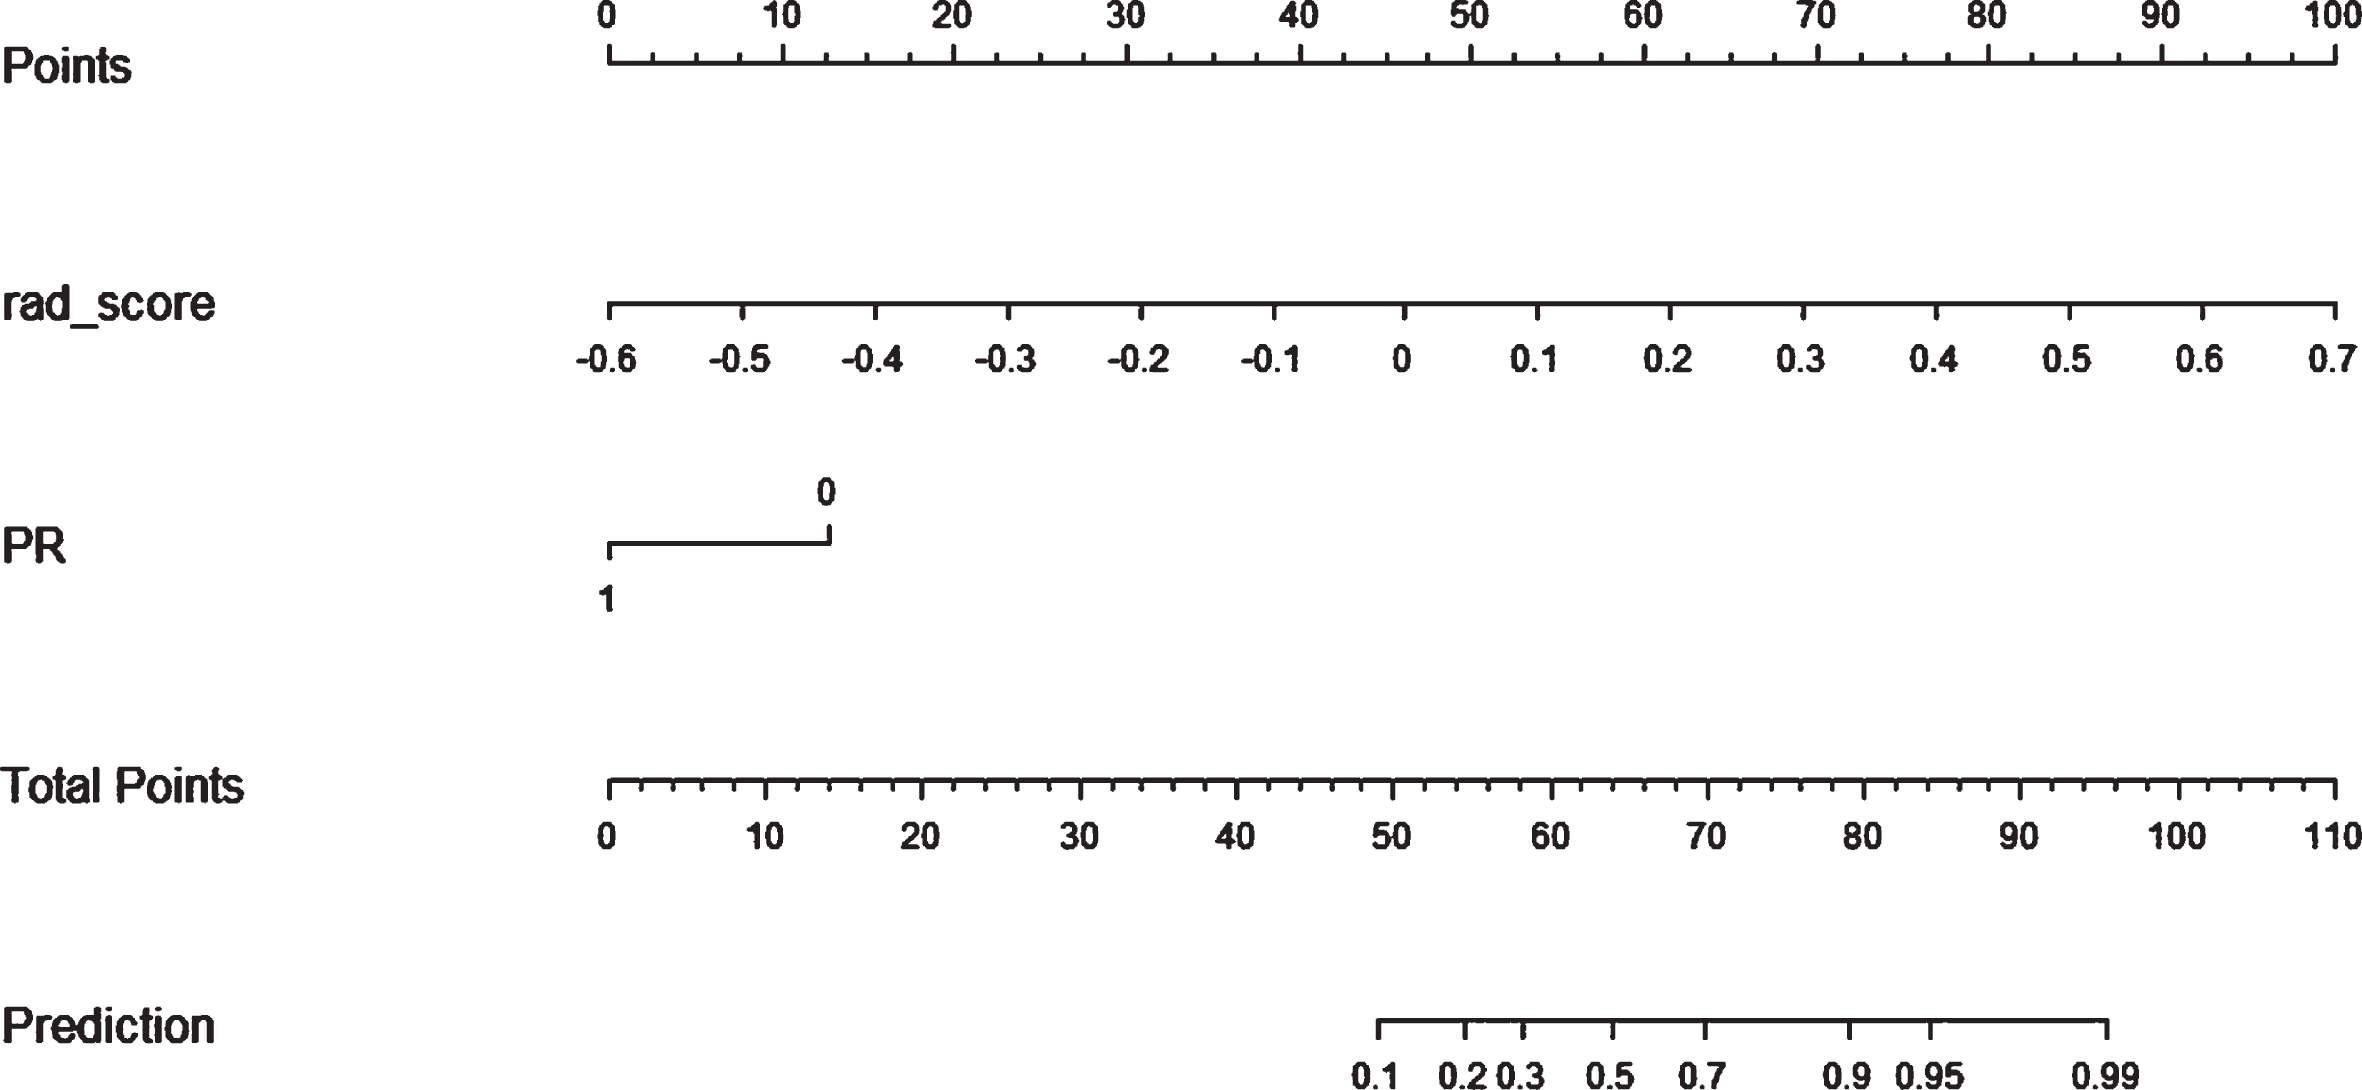
A radiomics nomogram with Rad-score and PR incorporated for predicting the probability of NAC pCR in breast cancer patients.
The radiomics nomogram yielded AUCs of 0.906 (95% CI, 0.840–0.966) and 0.790 (95% CI, 0.554–0.952) in the training and test sets, respectively (Fig. 5). The results showed that the radiomics nomogram has favorable predictive performances. The AUCs of the Rad-score and clinical model were 0.873 (95% CI, 0.808–0.948) and 0.694 (95% CI, 0.581–0.782) in the training set and 0.700 (95% CI, 0.506–0.911) and 0.759 (95% CI, 0.617–0.870) in the test set, respectively. The diagnostic performances of the three models are shown in Table 3. The results revealed that the radiomics nomogram’ performance was better than Rad-score and clinical model in the training and test sets. The average AUC and standard deviation (STD) of the nomogram after repeating training/testing process 6 times are shown in Fig. 6. The results showed a mean AUC of 0.943 and 0.785, and a STD of 0.027 and 0.038, respectively, for the nomogram in the training and test sets. The nomogram was experimentally shown to be robustness.
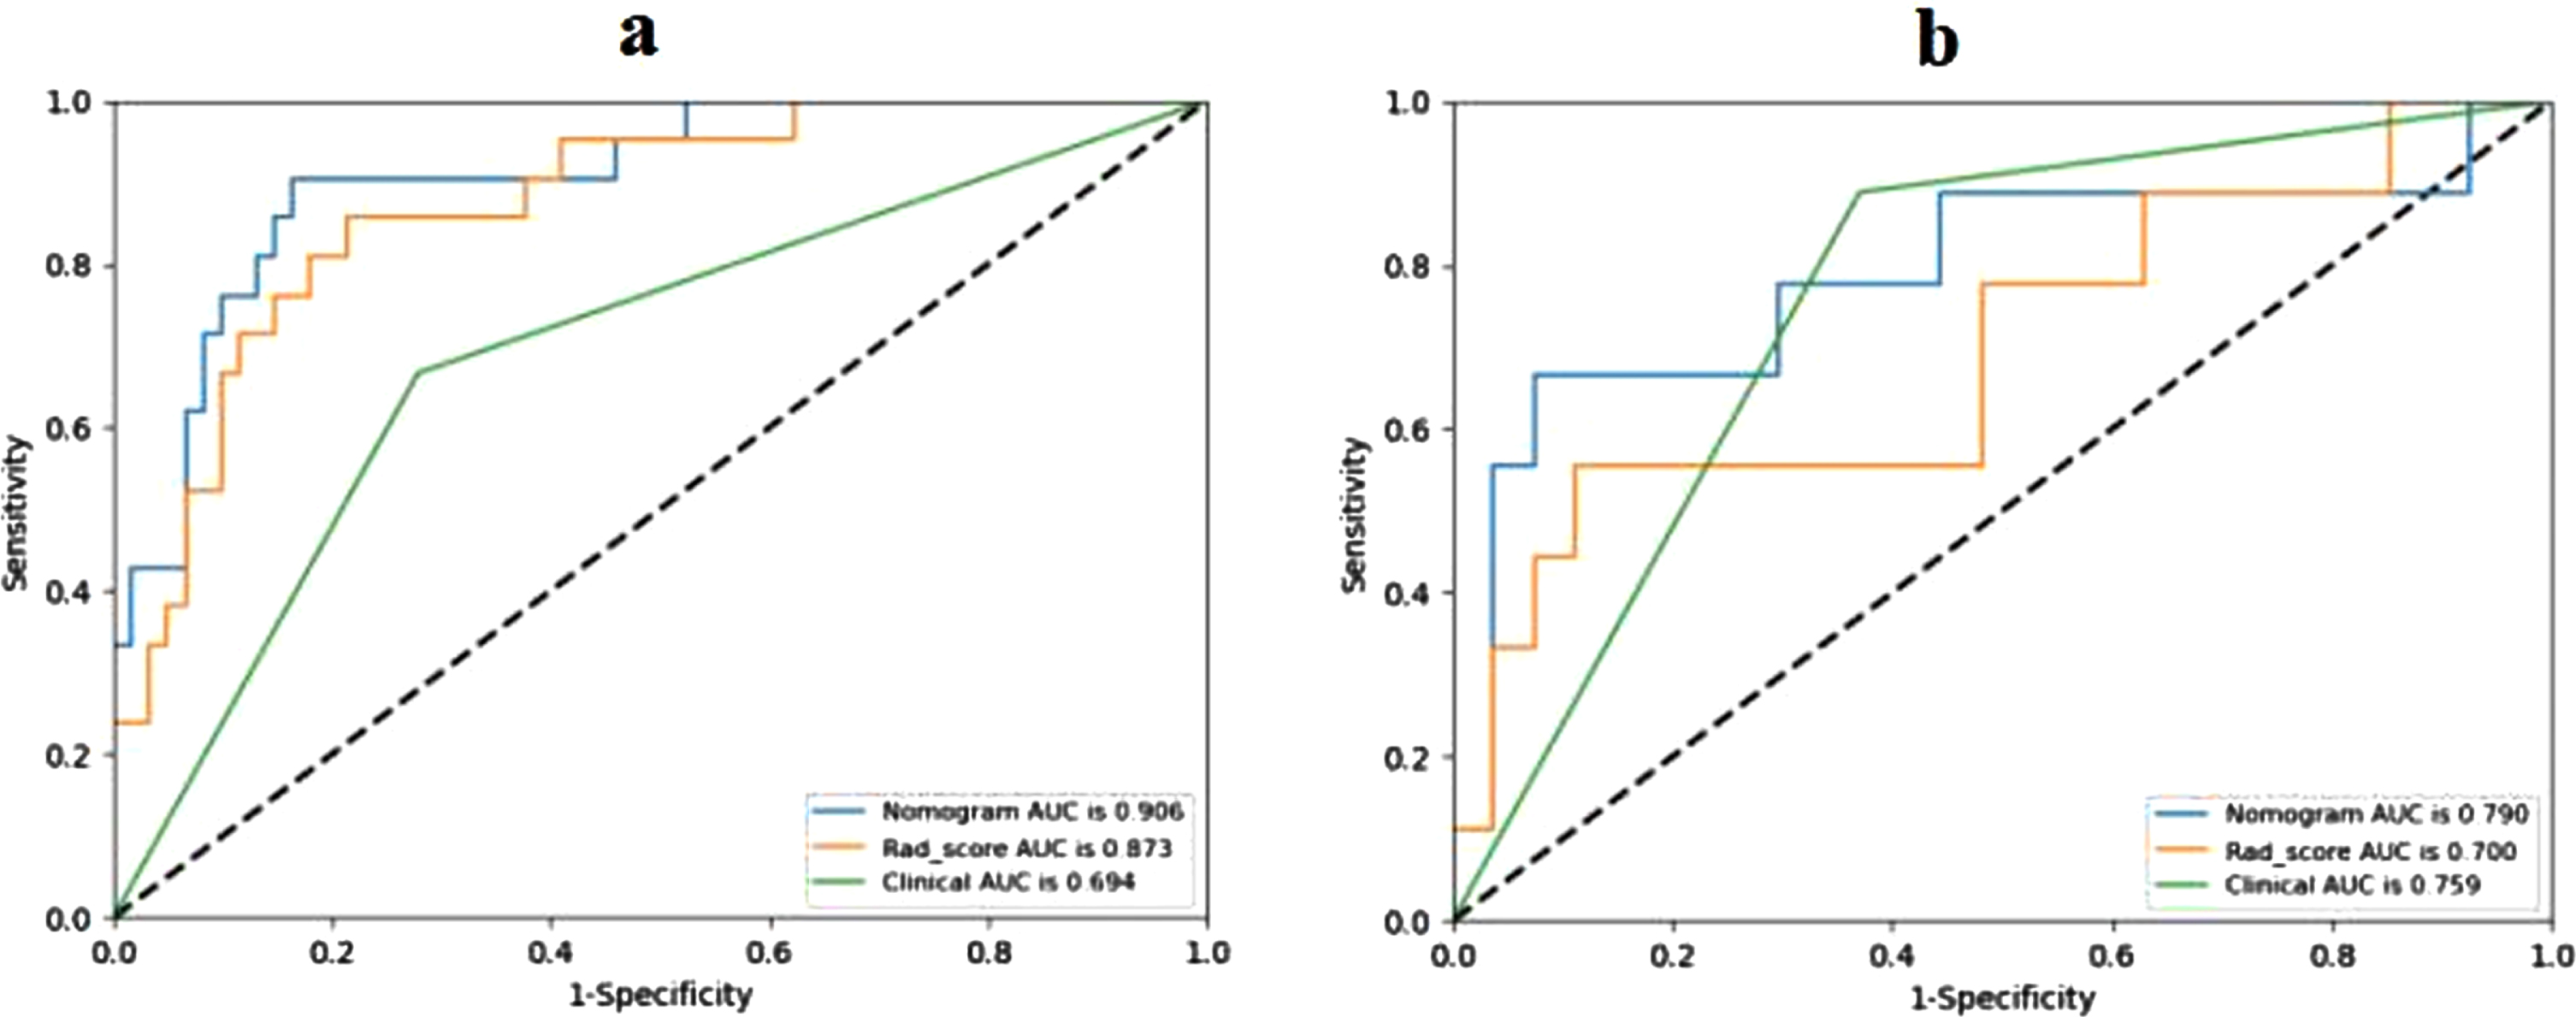
Receiver operating characteristic (ROC) curves of Rad-score, clinical model and radiomics nomogram in the training (a) and validation (b) cohorts.
Predictive performances of the three models
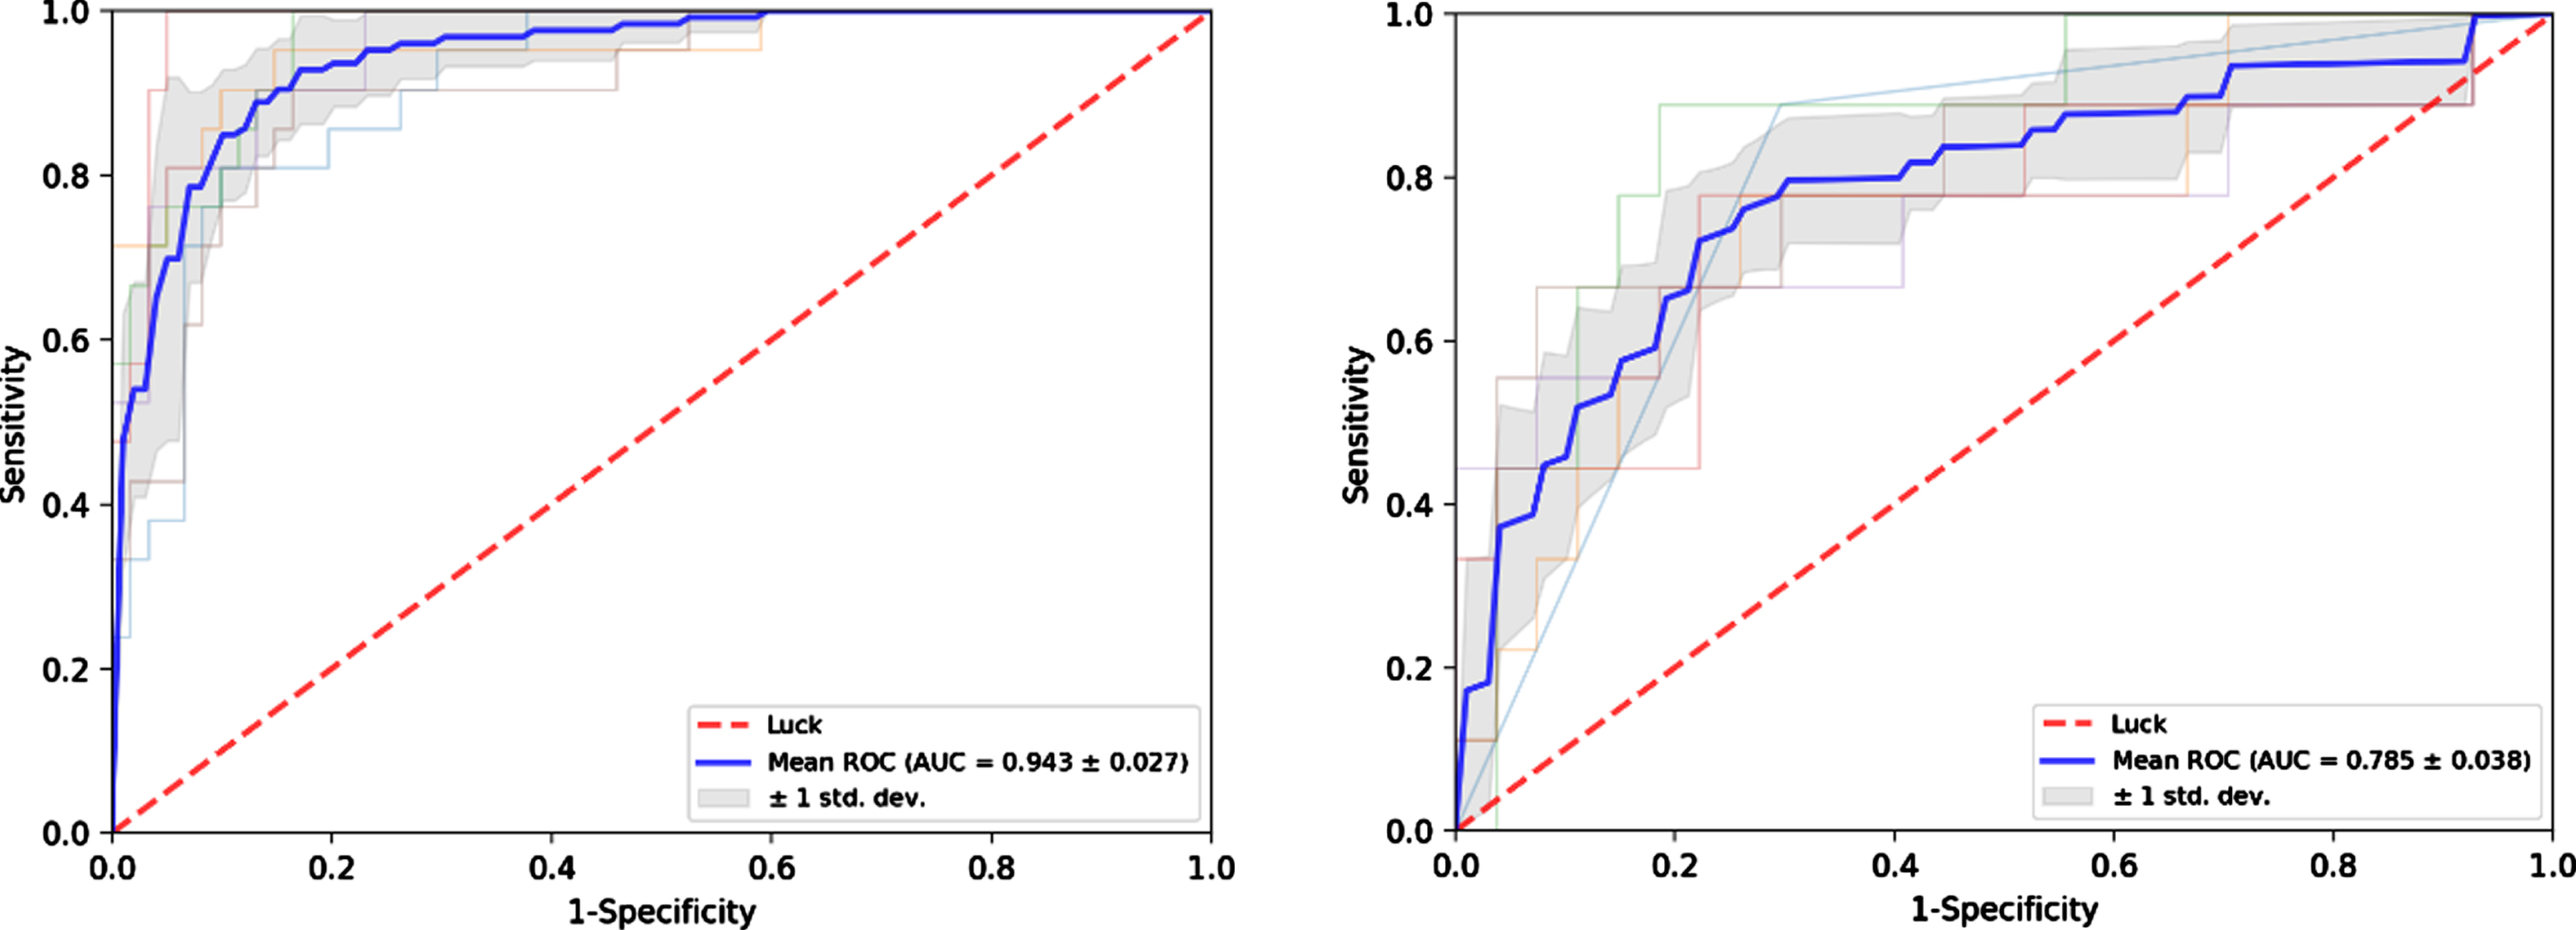
Receiver operating characteristic (ROC) curves of the nomogram after repeating training/testing process 6 times in the training (a) and test (b) sets.
DCA showed that the radiomics nomogram had net benefit than the “treat all” or “treat none” scheme, whereas the threshold probability ranged from 0 to 0.65 in the test set (Fig. 7). The calibration curves of the radiomics nomogram demonstrated good consistency between predictive outcome and observation in the training and test sets (Fig. 8).
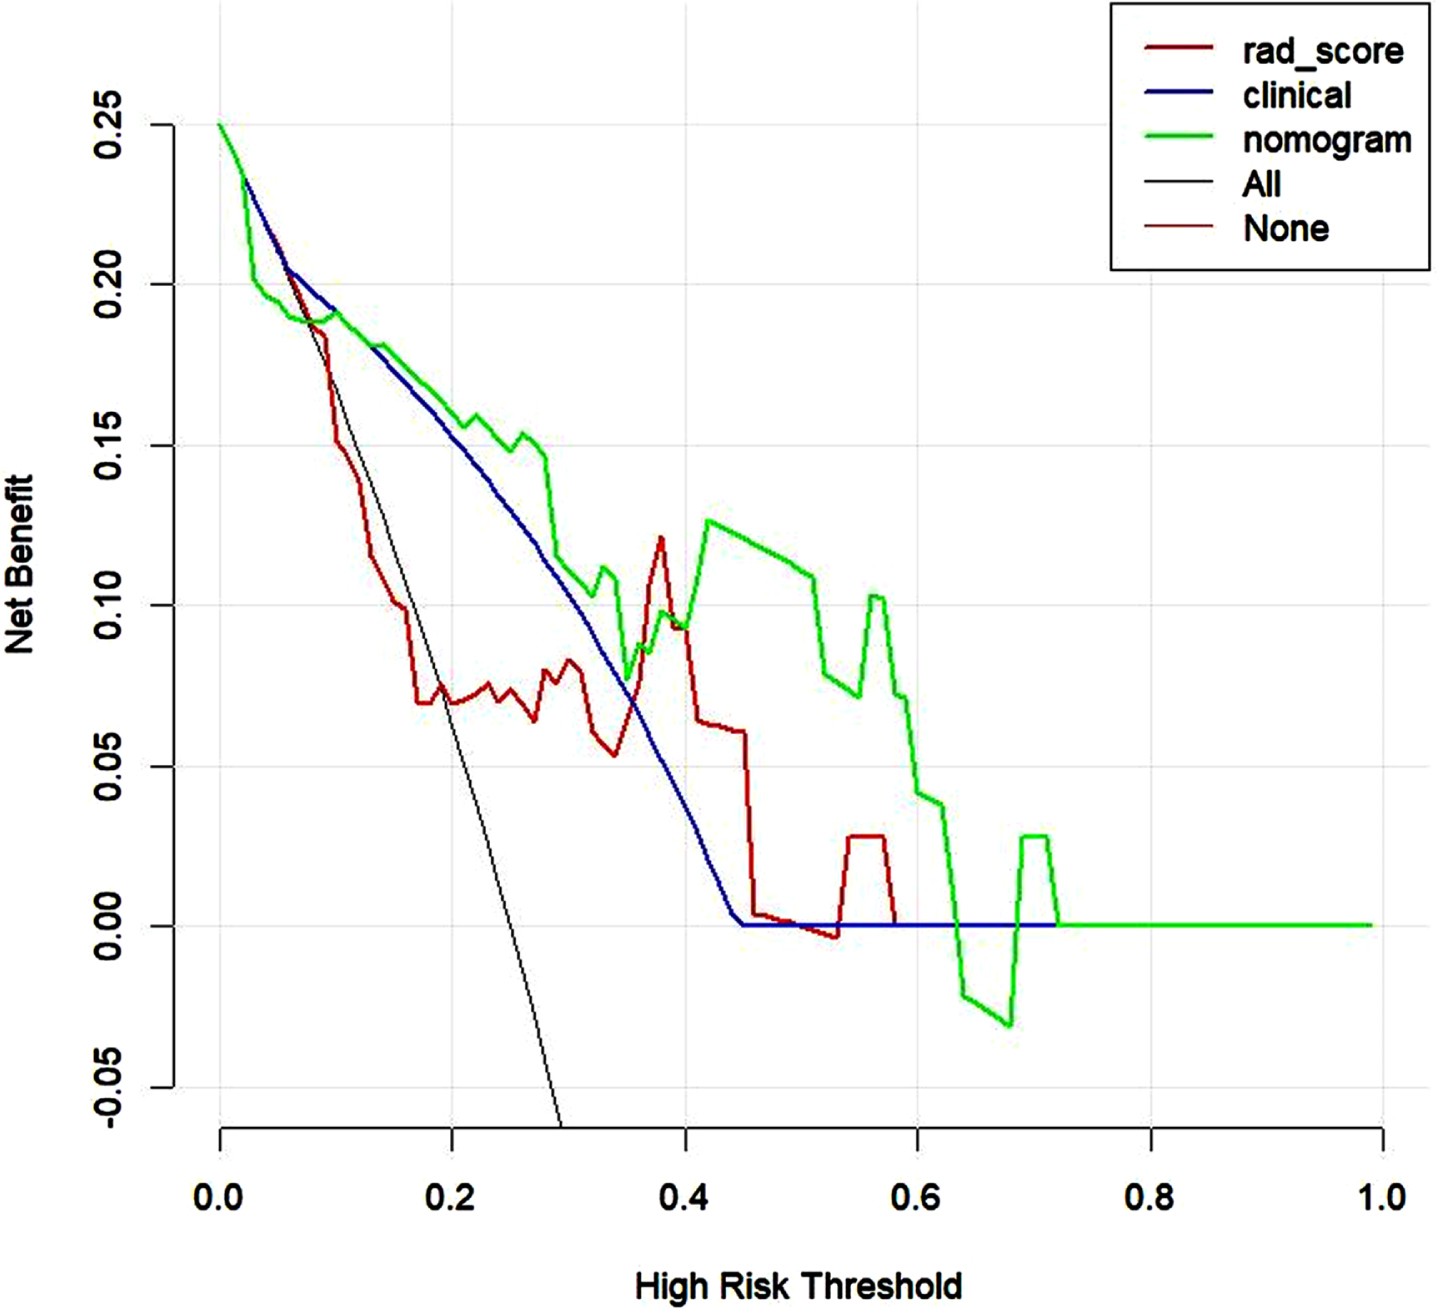
Decision curve analysis of three models in validation set. The y-axis measures the net benefit. The green line represents the radiomics nomogram. The red line represents the radiomics score. The blue line represents the clinical model. The black line represents the assumption that all patients achieve the PCR after NAC. The horizontal red thin line represents the assumption that no patients reach the PCR after NAC.
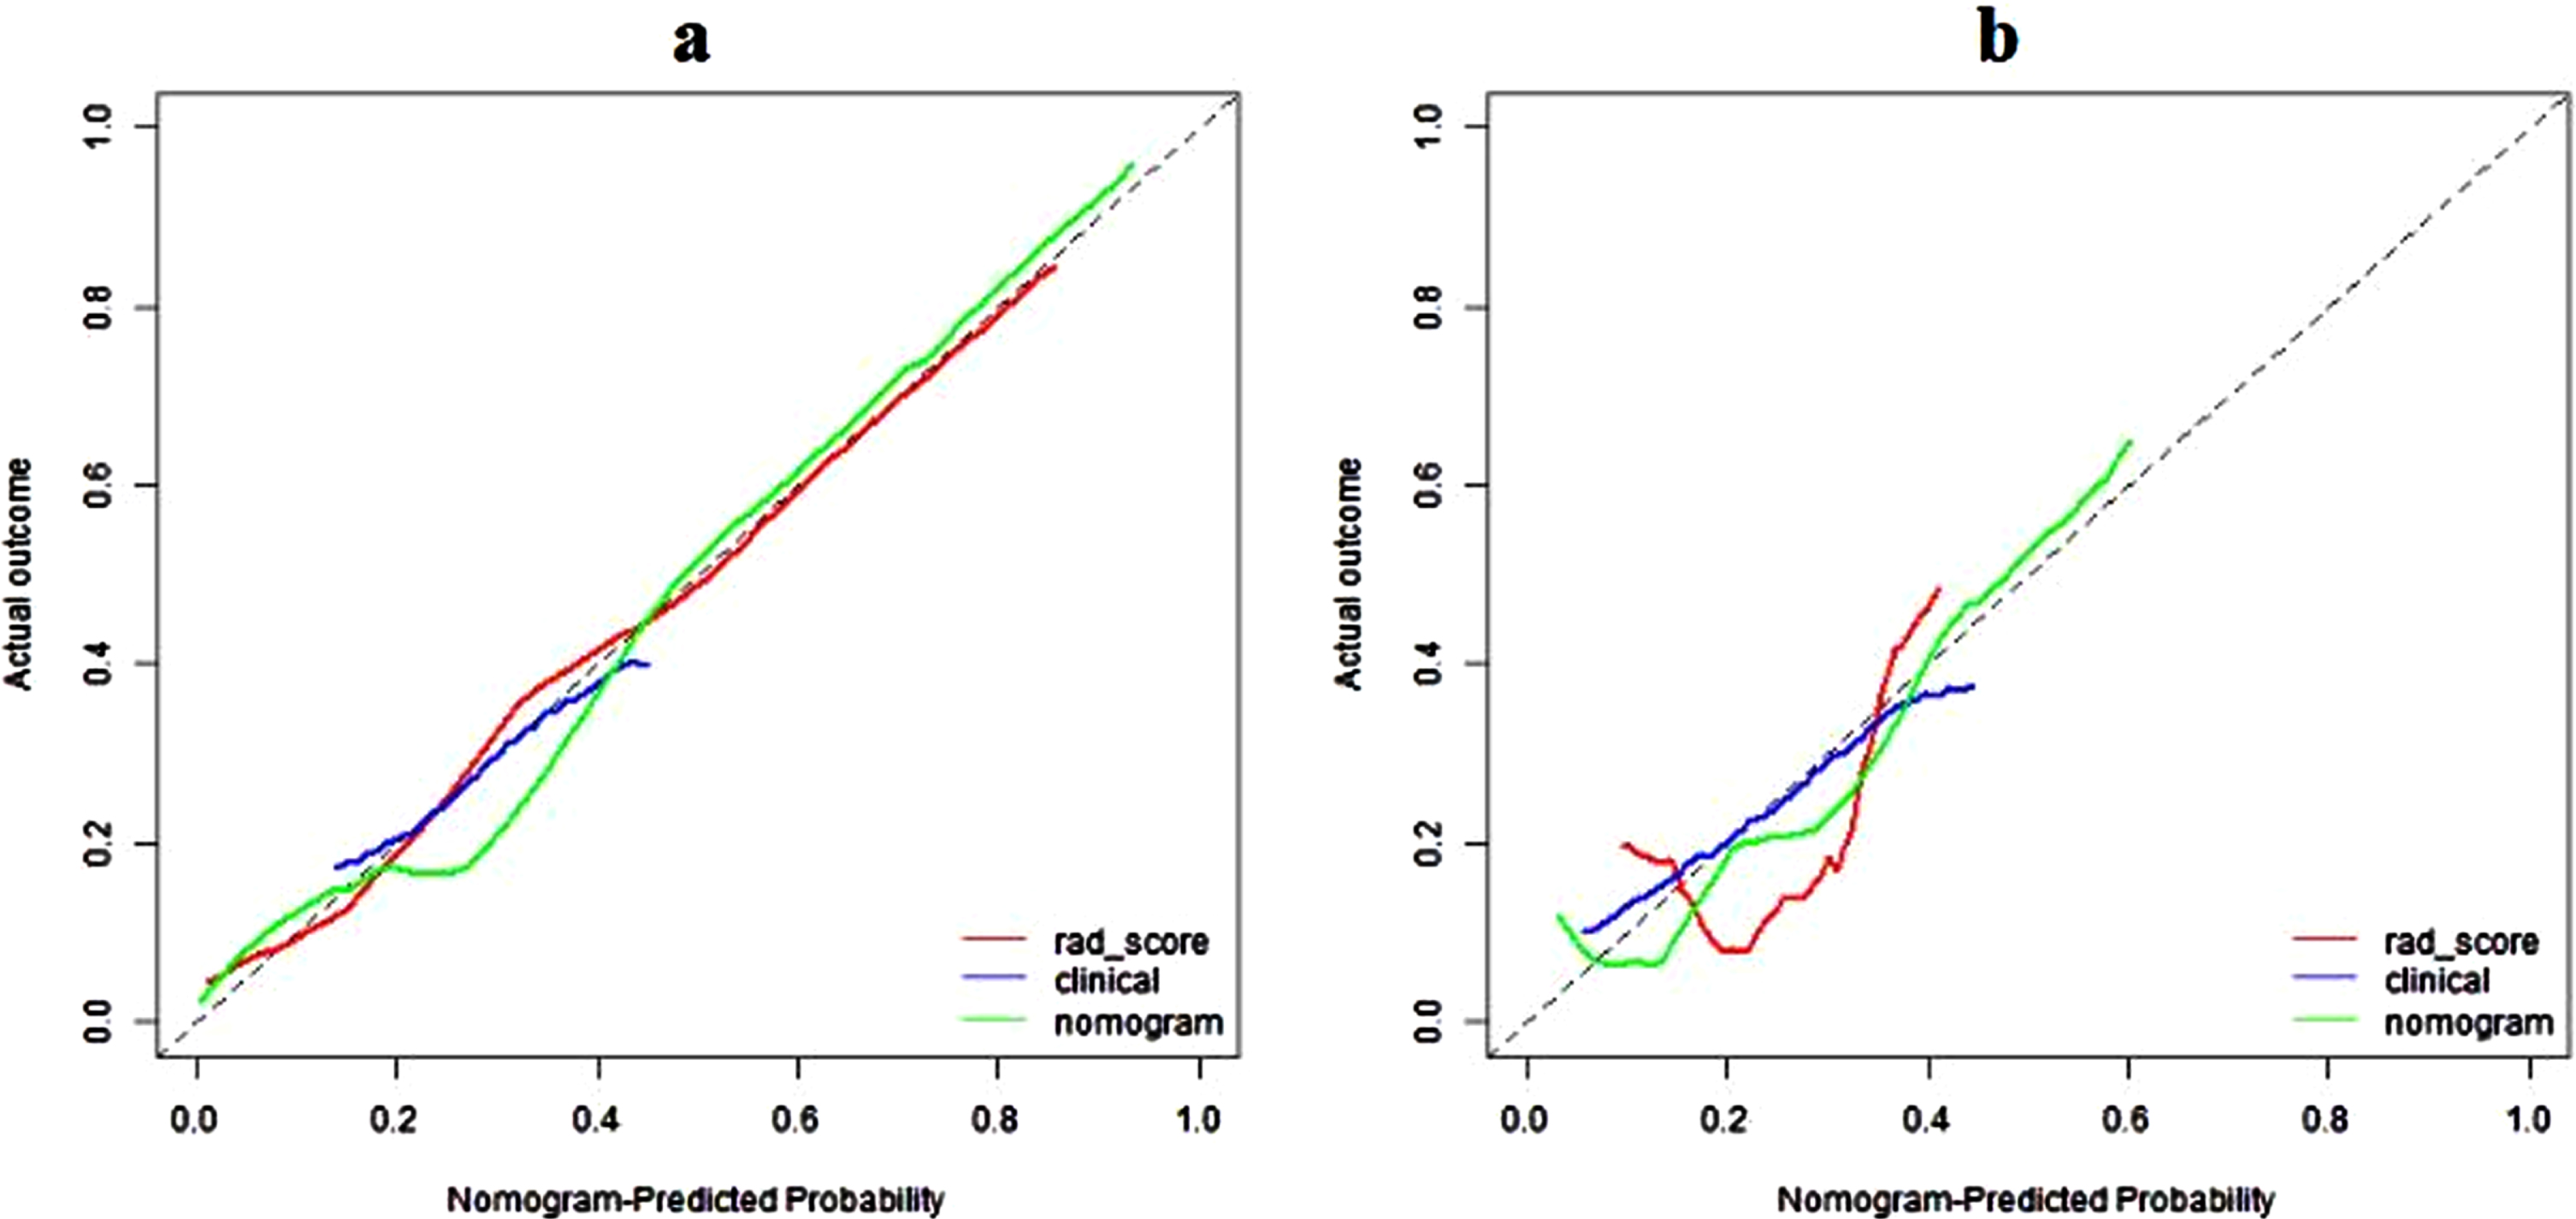
Calibration curves of radiomics nomogram in the training (a) and validation (b) sets. The diagonal line represents the perfect prediction of the radiomics nomogram. The red, blue and green lines represent the calibration curve of rad-score, clinical model, and radiomics nomogram, respectively. The calibration curves of radiomics nomogram are close to the diagonal line both in the training and validation sets, which shows that the prediction probability have good agreement with the actual probability.
A CESM-based radiomics nomogram was constructed and validated for pCR prediction in patients with locally advanced breast cancer before NAC. The result showed the nomogram’s good prediction efficiency (AUC = 0.79) in the test set. The noninvasive tool combining radiomics with PR could predict pCR in patients with breast cancer who undergo NAC. It has good clinical application prospects. As far as we know, no report has investigated the feasibility of using a CESM-based radiomics nomogram in breast cancer to predict pCR after NAC.
The radiomics nomogram can obtain features that are invisible to the naked eye from tumor images and can more accurately describe the features of breast tumors [28]. In the present study, the radiomics nomogram had better predictive performance than Rad-score and clinical prognostic factors (PR). The radiomics nomogram had higher specificity and accuracy than Rad-score and PR (92.6% vs 88.9% vs 63%; 86.1% vs 80.6% vs 69.4%). Wang et al. [19] investigated the feasibility of using a CESM-based radiomics nomogram in breast cancer to predict NAC-insensitive patients. The results showed that the radiomics nomogram combined with Rad-score and clinical prognostic factors (Ki67, Her2, and BPE) has the best predictive performance. The present study and Wang et al.’s study showed that CESM-based radiomics can provide certain value in the prediction of NAC efficacy in breast cancer. However, the purpose of our study is different. Wang et al. studied the sensitivity to NAC in breast cancer, whereas the current study investigated the pCR of patients under NAC. The effective prediction of pCR to NAC in breast cancer can assist clinicians in judging the prognosis of patients and help doctors determine whether patients with triple-negative and HER2 overexpression need intensive treatment after chemotherapy.
However, many MRI and positron emission tomography/computed tomography (PET/CT) studies have been applied in pCR prediction [29–31]. Fangberget et al. assessed the value of MRI in predicting pCR through changes in tumor size and tumor apparent diffusion coefficient (ADC) during treatment [31]. They predicted pCR with sensitivity values of 88% and 80% and specificity values of 91% and 80% using ADC and tumor volume reduction, respectively. In comparison, the present research developed and validated a CESM-based radiomics model with a larger sample size (118 vs 31) and higher specificity (92.6% vs 80%). The meta-analysis of Yuan et al. of 25 studies showed that the sensitivity and specificity of MRI in predicting pCR after NAC are 63% (range 56% –70%) and 91% (range 89% –92%), respectively [32]. In comparison, the proposed model had a sensitivity and a specificity of 66.7% and 92.6%, respectively. The results showed that the CESM-based radiomics model could predict pCR with higher specificity and sensitivity than other models. Thus, the proposed radiomics model can be used as a supplement for MRI to predict pCR after NAC in patients with breast cancer, especially those who are not able to undergo MRI, such as patients with claustrophobia. In addition, Antunovic et al. assessed the role of the radiomics parameters of PET/CT in predicting pCR after NAC in patients with locally advanced breast cancer and built four radiomics models [29]. The AUCs of the four radiomics models are in the range of 0.70–0.73. In our current research, the radiomics model’s AUC is 0.79, and more cases were included (118 vs 79). Furthermore, PET/CT is expensive, poorly accepted by patients, and cannot be popularized. Therefore, the CESM-based radiomics nomogram for breast cancer has a good prospect of clinical application.
Our study still has some limitations. One of the major drawbacks is the small sample size and its single-center retrospective design. In addition, CESM is a relatively new examination item. We also required the inclusion criteria to meet the corresponding clinical indicators, such as breast tumor examination, which made the inclusion limited. Although previous studies have shown that different molecular subtypes can obtain different rates of pCR [33, 34], the present study showed that molecular subtypes did not improve the performance of the radiomics model, which may be caused by the small sample size and sample distribution. Therefore, a larger sample size and a multimodal study are needed to improve the prediction efficiency of the model to continue our study. Second, the ROI was manually sketched, although ICCs were used to assess the reproducibility of the radiomics feature extraction and increase the confidence. In the future, deep learning will be added to improve the agreement of image segmentation. Third, the characteristics of the peritumoral region was not included. A related study [35] showed that the peritumoral region is related to pCR; therefore, it has potential research value in CESM. This factor is also one of our future research directions. Furthermore, this study is a CESM-based radiomics study. Radiomics features are manually set in advance. However, deep learning can automatically mine the deep information of the image according to different tasks. In the future study, a larger sample data will be used to explore the value of CESM-based deep learning model in predicting pCR after NAC in breast cancer.
This study is the first to develop a CESM-based radiomics nomogram for locally advanced breast cancer pCR prediction. Although CESM as a new diagnostic imaging modality has fewer studies than MRI, traditional mammography, PET/CT, and ultrasound studies, its clinical application value and prospect are undeniable. Our group has already achieved some encouraging outcomes using CESM-based radiomics methods [18, 22].
Conclusion
In conclusion, the radiomics model based on CESM images showed acceptable predictive performance in predicting pCR after NAC in breast cancer, which can potentially benefit for those patients who have not responded well to NAC. Further research on larger sample size with more centers and integration with deep learning methods is needed in the future.
Declarations
Ethics approval and consent to participate
This study was approved by the institutional review board of Yantai Yuhuangding Hospital, and the patients’ right to informed consent was waived.
Consent for publication
Consent forms were obtained.
Availability of data and material
The datasets generated and/or analysed during the current study are not publicly available due confidential information but are available from the corresponding author on reasonable request.
Competing interests
The authors declare that they have no competing interests.
Funding
This work is supported by Yantai Science and Technology Innovation Development Plan (2022YD029), the National Natural Science Foundation of China (82001775), the Natural Science Foundation of Shandong Province of China (ZR2021MH120) and the Special Fund for Breast Disease Research of Shandong Medical Association (YXH2021ZX055).
Authors’ contributions
Kun Zhang contributed to the conception of the study; Guangdong Qiao and Ning Mao contributed significantly to analysis and manuscript preparation; Kun Zhang performed the data analyses and wrote the manuscript; Jun Lin, Fan Lin, Zhongyi Wang, Haicheng Zhang and Shijie Zhang helped perform the analysis with constructive discussions.
Footnotes
Acknowledgments
Not applicable.