
Abstract
BACKGROUND:
The heuristic potential of work activity-focused territory analyses has yet to be explored in depth. Instead of viewing territories as a product of their actors, the prevailing approaches rely on statistical indicators to view them “from above”.
OBJECTIVE:
To understand how work activity acts upon a territory and transforms it, and to discuss what the main indicators used to characterize territories reveal and conceal.
METHODS:
Case studies led on two territories, each in a different industry. One on transportation in a sparsely populated “low density” area; the other in an industrial district, focusing on its “high activity rate” cork industry. In the first case, work activity analyses were led with drivers and mobility designers, including systematic observations and interviews, in the context of an endeavour to redesign a local transport network. In the second case, work activity analyses led among cork stopper choosers were followed with an integrative literature review of indicators about the cork industry and its health impacts.
RESULTS:
This territory analysis highlights: (i) traces of bus drivers’ work activity on the mitigation of inequalities in access to public transportation; (ii) “absent indicators” regarding cork choosers’ work activity and its health impacts, stressing the existence of a development agenda for this territory focused on cork processing rather than on those who perform it.
CONCLUSION:
Our analysis of territorialization processes through the lens of work activity signposts a path for research-action seeking to associate territorial development with improvements in the working conditions of citizen workers.
Relationships between work and territory
This article is part of an endeavour to understand “territorialization processes” by looking at them through the lens of work activity. Here, we assume, as Lajarge [1] argues, that a territory is not a neutral object and cannot be disconnected from the actual activities that take place in it –including work activity. It is a space that people’s work acts upon and transforms. Even so, these territorialization processes, the results of daily work activities that often consist in silent repetitions, tend to be discreet and undervalued [2].
In the scientific tradition of activity-centred ergonomics we follow [3, 4], our understanding of work activity’s intervention in territorialisation processes leads us to draw a distinction between two perspectives in territory analyses. The first of those is deductive, it approaches territory as a matter of fact [5] and defines it a priori. Territory analyses led from this perspective usually rely on statistical indicators to characterise knowledge of a territory (e.g., population density; demographic distribution; employment rate). It is a macro approach: rather than seeing the territory as the outcome of the work activity and actions undertaken by its stakeholders, it views it “from above”.
The second perspective explores the way a territory is constructed as a matter-of-concern [5], how it is produced and transformed, taking into consideration what is debated, the ways in which inequalities are aggravated or mitigated, and the ways in which on-field studies of work activities shed light on it. In this sense, we challenge the use of indicators to describe a territory based on traces of work activity.
Territorial indicators: For a panoramic view of the territory
Indicators are often considered as a first step “into” a territory, based on the assumption that they can reveal what the territory is [6].
However, as Galtung [7] points out, indicators are not mere statistical reflections of the human condition on a given territory. Rather than being “observable”, they are “observed”, built with the purpose of mediating an interpretation of reality. They show a clipping of reality, and the procedures that determine their framing should thus result from a plural analysis requiring thorough discussion.
It is interesting, as some authors have proposed, to look at the definition of “indicators” as lying at the interface between what derives from science and what derives from politics [e.g., 6–8]. Consequently, it is critical to analyze: (i) how indicators are constructed; (ii) which knowledge is derived from them; and (iii) how they serve to inform decision-making processes. Given the term’s polysemy, it is unrealistic to aspire to any broadly shared definition of it. Thus, indicators that quantify a given type of occurrence are simply termed “descriptive indicators” (such as population density, for example), and “normative indicators” are those that serve to assess and assign value or to prescribe a desired future condition (as does a territory’s employment rate, for instance), or that are used to assess whether a given desired condition has been achieved [6].
Indicators also bear ontological meaning, they project a certain vision and guide the observer’s look. Discussions about the uses that are made of indicators that account for their ability to reveal or conceal information, especially when it comes to work activity, allows to shed light on other, coexisting and alternative, facets of the territory.
Visualized in material form, these facets or attempts at territorialization may come to constitute boundary objects [9], insofar as they build bridges between discrete “worlds” and different knowhow, without any universally shared representation or uniform perspective on the territory [10]. They facilitate the interaction processes between stakeholders such as politicians, experts, designers, workers, and other citizens when making decisions about territorial change and development.
Purpose and research questions
The purpose of this paper is to explore how work activity acts upon the territory and transforms and re-values it. We will rely on Latour and Woolgar’s [11] concept of “inscription” to highlight what legacy work activity leaves a given territory. This inscription is not spontaneous, it is often negotiated, “produced by instruments such as maps, photographs, illustrations (...)” [12, p.267, free translation] –which can translate activity traces, convey the conditions under which activities are led, and describe the relationships between their actors [13].
We suggest that a heuristic approach to territory informed by work activity analyses can contribute by shifting the focus away from indicators and towards the issues that lie in their blind spots. Rather than critiquing approaches that rely on indicators to characterize and analyze the relationship between work and territory, or contrasting their outcomes with the knowledge obtained from analyses of work activity in its real context, our focus here is on exploring the ways in which the latter can bring to light other stakes and issues on a territory [14].
This article presents two case studies led within two different industries –transportation and cork processing –on different territories. Through these, it discusses the methodology adopted in each case and their respective outcomes. To describe both case studies, we will first highlighting their contrasts, as illustrated by two indicators: low population density in the first case, a feature that determines limitations in the transportation offer; and, in the second case, the cork industry’s high activity rate, with a concentration of cork companies and the presence of a significant pool of specializedworkers.
By discussing each indicator through the lens of work activity analysis, we follow in Latour’s footsteps [15] and challenge the “geographers’ tyranny” or “‘the tyranny of distance’ or proximity; elements which are close when disconnected may be infinitely remote if their connections are analyzed; conversely, elements which would appear as infinitely distant may be close when their connections are brought back into the picture” (p. 370).
In the context of this approach, two research questions structure the studies presented below: (i) which traces reveal the contributions of work activity in territorialization processes? (ii) to what extent can the material inscription of these traces in the territory enhance decisions both on territorial development and on the improvement of working conditions?
A project to redesign a transport network in a “low-density” territory
Transport Policies are considered as “implicit territorial policies”, “policies related to the industry that are capable of structuring (but not necessarily ordering) the territory. (...) Policies which, while they a designed with goals for the industry in mind, effect changes in the way the territory is inhabited and organized” [16, p. 331-332].
“Territory sensitivity” [17] in planning a public transport service –adherence to a territory’s specificities –takes on special importance in the case of road passenger transport. Bus routes can be modified following changes in the densities of the places they serve and shifts in mobility generating poles.
During endeavours to redesign the layout of mobility networks, discussions informed by the “mobile society” paradigm [18], which argues that mobility is a distinctive feature in contemporary societies, tend to leave out some territories whose features make them a difficult to fit for this hegemonic paradigm.
The following case study took place on such a territory 1 –one that is vast and sparsely populated. Our research was part of a project to redesign the bus network in a municipality located in the centre region of Portugal, a “predominantly rural” territory. The City Hall had reached out to a multidisciplinary team of mobility designers, composed of three engineers, two geographers, one mathematician, and ourselves, work psychologists.
Methodology
We led a multi-site case study [20]; rather than focusing specifically on any one place within the territory, our analysis “followed” drivers’ activity along each of the transport network’s routes. We even followed them beyond this network, when drivers took detours outside of its official layout. They would do so not only to drop off passengers that live further from bus stops, but also to go home after their workday, as they would “take the bus home” –more on this later.
Our methodology here was founded upon a qualitative approach to work activity analysis [4, 21]. This “activity approach” seeks to situate the actions of workers in relation to their context, in order to understand the determining features of their work activity, the constraints under which they operate, and the work regulation strategies at play in this context.
In total, we performed activity analyses with the six mobility designers and the six drivers working on this territory. This included in-context observations of the designers’ activity (∼30 hours) and the drivers’ activity (∼160 hours), as well as interviews with each of them (which lasted on average 50 minutes and 1 hour and 20 minutes, respectively) and two collective interviews with stakeholders in the territory (representatives of local authorities and of the bus company), which lasted an hour and a half on average. All of these were performed with the free, prior, and informed consent of all participants.
In terms of analysis, we organized our observations in “shift logs” [22] tracking time, places, tasks, interactions with passengers, and temporal and organizational constraints. The interview data was analyzed using the software Tropes [23] in order to highlight the categories that emerged from the workers’ discourse. Bus drivers focused mostly on work schedules, interactions with passengers, meaningful places, and the “signs” of their activity in the territory. Mobility designers were mostly concerned with “passengers count”, schedules, ticketing, and the financial sustainability of the network’s operations. Verbatim extracts are provided in the results section to illustrate this analysis.
We presented our final results to representatives of local authorities and of the bus company, and discussed proposals to reconfigure the network layout and service schedules with them.
Results and discussion
Population density, passenger count and mapping: Territory as a “matter-of-fact” from the mobility designers’ point of view
Transport networks designers play the lead role when it comes to defining bus lines, their perimeter and boundaries, and the locations of bus stops. Thus, a good start is to ask which conceptions of territory show in their practices.
The first stage of the project was to analyse the territory and characterize the existing transport network. The territory was classified using the NUTS nomenclature (Nomenclature of territorial units for statistics) 2 : it is located in the country’s Center Region (NUTS II), in the Coimbra sub-region (NUTS III). It stretches over 251 Km2 and is subdivided into ten freguesias (civil parishes). With only 8816 inhabitants –35,1 per Km2 –it fits squarely in the “low-density area” category [24]. However, it is not homogeneous and asymmetries in population density stand out: the most urban freguesias, closer to the municipality seat, are denser, while density is much lower in the most peripheral freguesias (see Fig. 1).
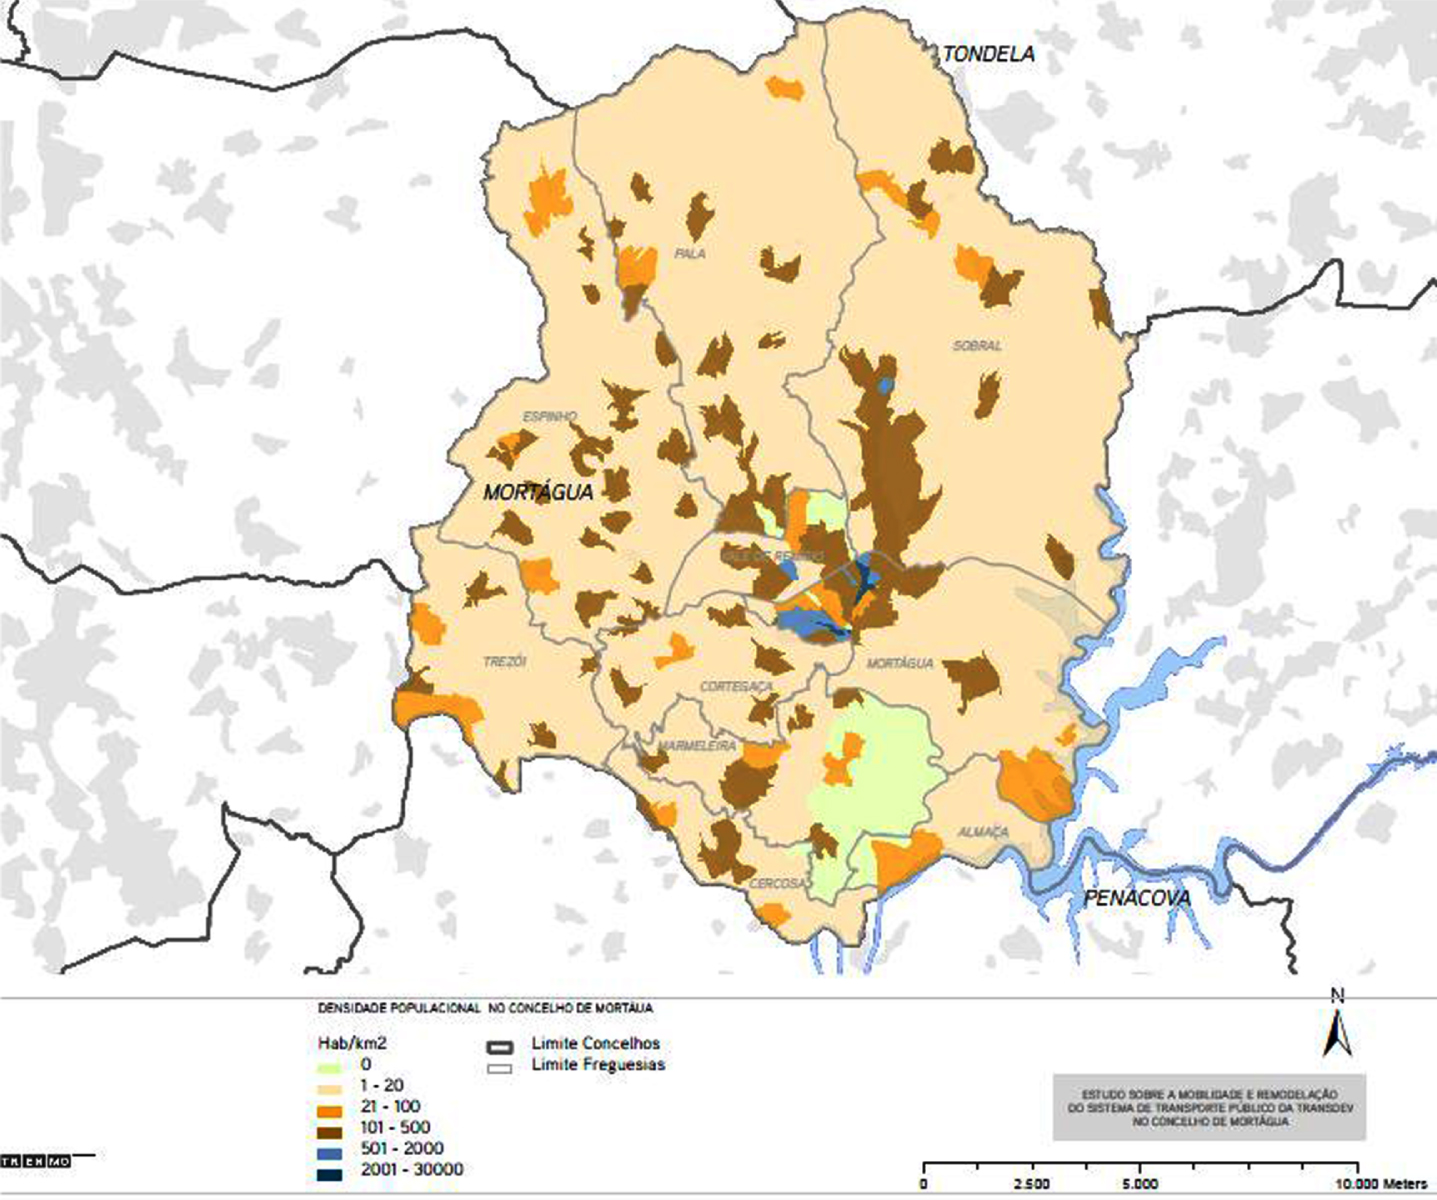
Map of the territory by population density.
We argue that the designers we observed see the territory as a matter-of-fact [5]. As we have mentioned previously, an example of this is their use of a collection of territorial indicators (such as population density or variations in population) and engineering and transport management indicators such as mobility generating poles (cf. Fig. 2) or origin-destination matrices, along with their mapping work relying on the existing cartography and Geographic Information System, which they deem to be the main tools to gain knowledge of a territory and represent it.
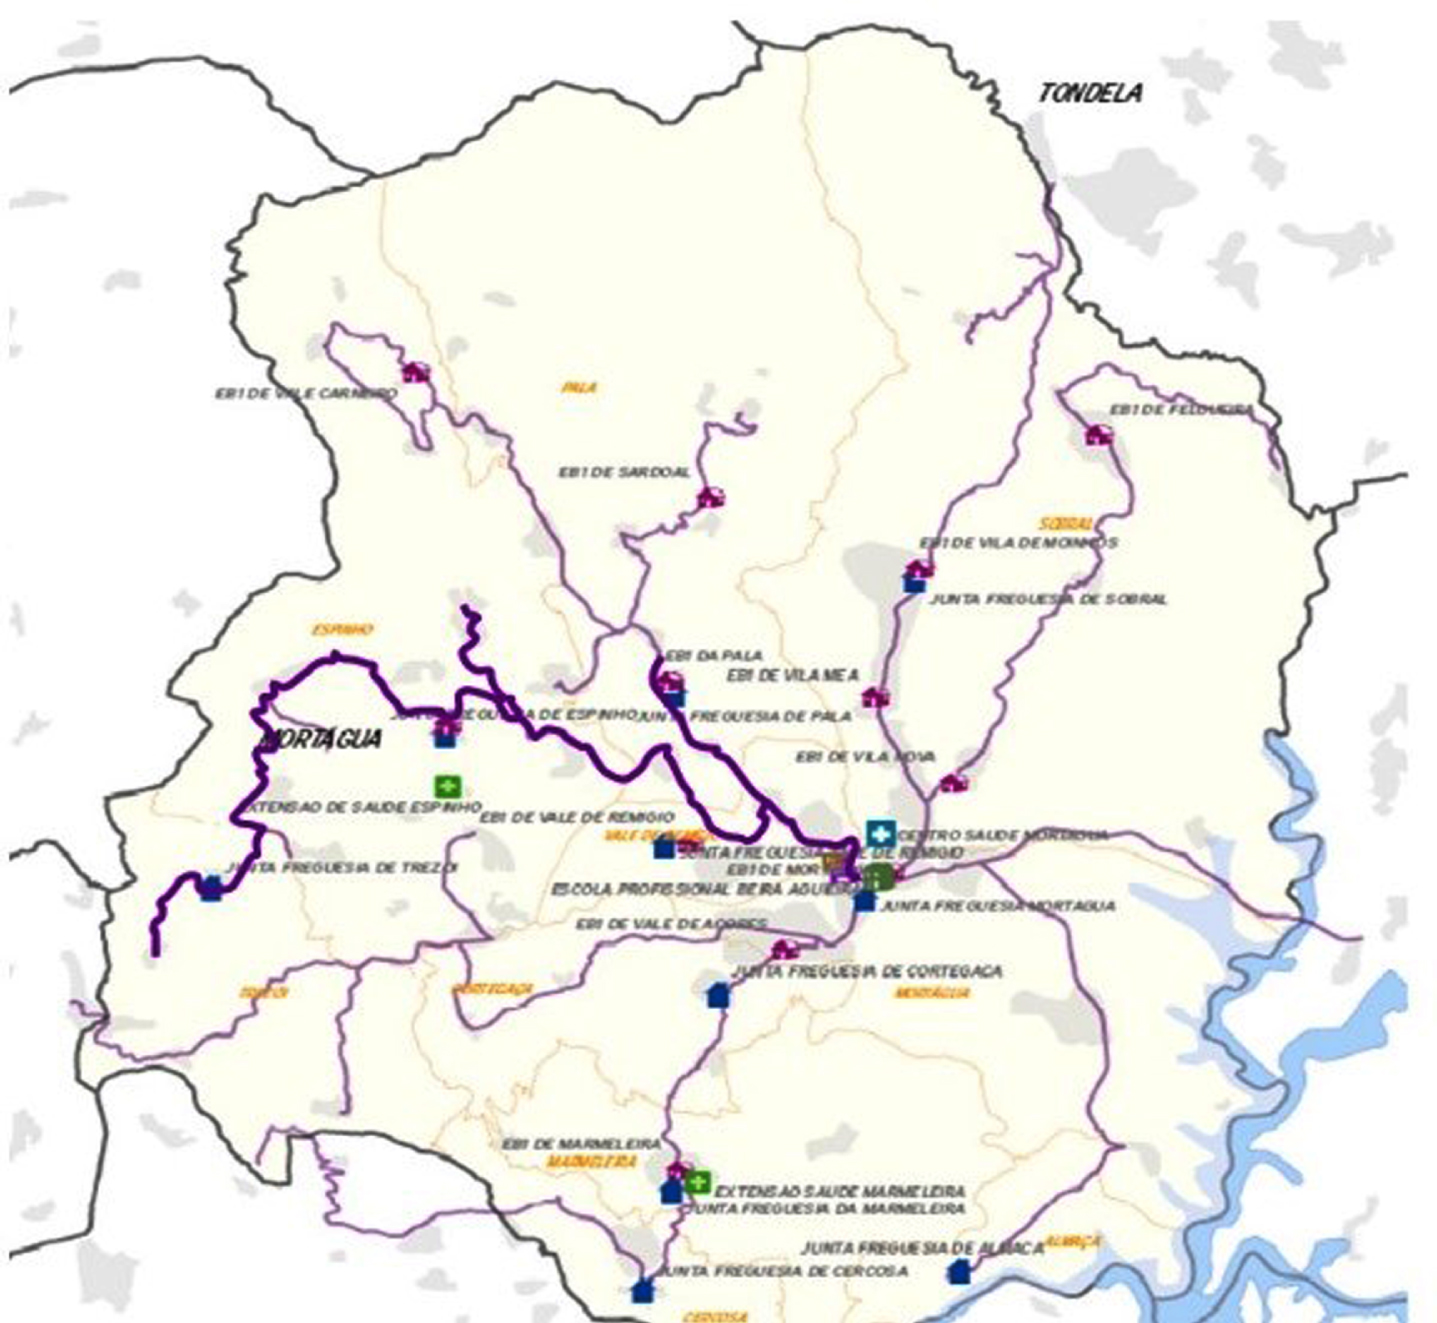
Map of the territory showing its density generator poles and thus mobility poles (e.g., schools, health care centers, public services).
The National Spatial Policy Program, which defines strategic goals and options for the organization of the Portuguese territory (Law no. 99/2019, September 5), put forth guidelines which set the improvement of public transport services in sparsely populated rural areas as a top priority to foster territorial cohesion and social equity.
To understand the conditions of mobility by public transport on this territory, the designers carried out a first diagnosis of the existing network before the intervention. It showed: (i) the offer’s scarcity, with only two return journeys per day for each bus line –one in the morning and one in the evening, roughly meeting school schedules –and no service on weekends and during school holidays; (ii) the lack of an interface between the different lines (the transport network follows a radial layout); (iii) the absence of any journey adapted to local companies’ business hours; and (iv) that the transport offer was only bolstered to serve the weekly fair.
They also relied on other indicators to analyze the use of public transport on the territory. They led surveys to count the number of passengers per bus stop and analyzed their evolution along the route to identify the places that generate the most and least demand for the transport service.
Such indicators are built “in exterritoriality” [25]; from a position of neutrality regarding the singularities of the territory under analysis. For the purposes of our study, this leads to certain limitations.
In the two main Portuguese metropolitan areas (the major cities in terms of population), transport policy decisions considerably rely on these indicators, as they generate knowledge about local people’s types of movements and their expectations. Data is collected using the “Mobility Survey”, which aims to understand the travel patterns of the area’s inhabitants. Therefore, the survey asks questions such as: “where do you come from?” and “where are you going?”. Such questions make sense in this type of territory, where transport networks are more complex and trips involve multiple complementary means of transportation.
However, territories like the one we have studied do not lend themselves well to this practice. The situations we have encountered have brought into clearer focus the need for a local debate at the technical and political level, which the use of indicators entails if it is to generate a well-structured plan to meet transport network demands [8]. During our interviews, one of the designers illustrated this when they said:
“People don’t realize we do not make decisions. We work on solutions, not decisions. The decision is in the hands of the operator [the company holding the exploitation concession] or the municipality” (Mobility designer, Civil Engineering).
At the core of the debate that arises from the designers’ analyses lies the challenge in finding a compromise between a bus line’s public service purpose and its concessionaire company’s economic sustainability. Cuts in service offers are notoriously common and their impacts on local communities’ mobility conditions and drivers’ employment are no secret:
“The first stage [diagnosis of the network in operation] is always complicated, they [the drivers] realize there will be cuts and they are afraid to lose their jobs. There is a tendency for services to be cut during the day, so they’ll say, ‘yesterday, the bus was crowded at lunchtime’. So we check and... it’s almost empty! (...) I get their side of the story, but this is the tendency” (Mobility designer, Civil Engineering).
The drivers criticize this type of indicators built “in exterritoriality” by the designers, because they see it as a production of “statistics”, with a short temporal scope. Their perspective is also supported by the fact that their strategies to provide users the transport they need are not taken into consideration when producing indicators:
“This company does not see names or people, it sees numbers. Well, it joined the era of statistics, now statistics mean everything. The engineers probably work on a goal-driven basis ... [...] Statistics explain everything these days. What statistics did they use [to set the end time for this driver’s route at 7pm] when I have never arrived before 7pm?! I never have and I never will!” (Driver, 19 years of seniority in the company).
This exterritoriality stance translates into an assessment that is deemed “non-adherent” to mobility conditions on the territory [25]. This assessment does not account for specific time demands associated with different places on the route, whether they are planned or unplanned for –it cannot make room for a long-standing commitment to act on this territory, kept alive through continuous interaction dynamics with its inhabitants and places.
Our research led from the point of view of drivers’ work activity offers a deep dive into the life and events that develop in these indicators’ interstices, in their cracks and through their discontinuities. It also sheds light on debates that are kept in the shadows, as we will discuss in the following section.
The drivers working on this network live in the municipality where they work, which makes them citizen-workers on this territory. They know their clients, their names, where they live, and how far their houses are from the nearest bus stop.
We begun with free observations of the drivers’ activity. The question of this transport network’s workers’ participation in debates about the evolution of mobility routes was then raised. Despite their daily experience of, and activity in, the network, should it be taken for granted that their knowledge of life on this territory makes them legitimate participants in the endeavour to redesign their mobility network [26]?
Our systematic observations and interviews reveal strategies they develop in their work activity to bring the transport network closer to some of its users and to expand routes. Drivers use the introduction of extra stops and of unplanned detours to transport those who are further from the route to specific points as strategies to mitigate inequalities in access to the transport system which its current configuration produces.
This is the territory’s social demand on their work activity: the creation of a “reserve of alternatives” [27] to adjust the existing network to local needs. The drivers bring their knowledge as citizen-workers from this territory to their activity to answer their community’s actual needs: is it necessary to stray off-route to “catch” someone that lives further away from it? Is it necessary to stop somewhere that is not planned on the route nor identified with a proper bus stop sign?
The mobility potential available to the service’s users is produced in part by its drivers’ activity in this context, and therefore by the alternatives their activity has been consolidating.
Here, rather than a matter-of-fact, the territory is a matter-of-concern [5], of debate, namely about the notion of public service that permeates the drivers’ activity. As our analyses of the drivers’ work activity shows, this notion emphasizes the fact that the service they provide cannot turn a blind eye to the inherent conditions of access to it.
How can mobility designers and local decision-makers take into consideration these alternatives introduced by drivers’ work activity?
We have sought to reflect this territory through a map that not only includes network designers’ indicators but also shows an overlapping layer (see Fig. 3), which accounts for bifurcations, interactions or forms of sociability that define the territorialization processes inherent to the production of the territory as it results from drivers’ work activity.
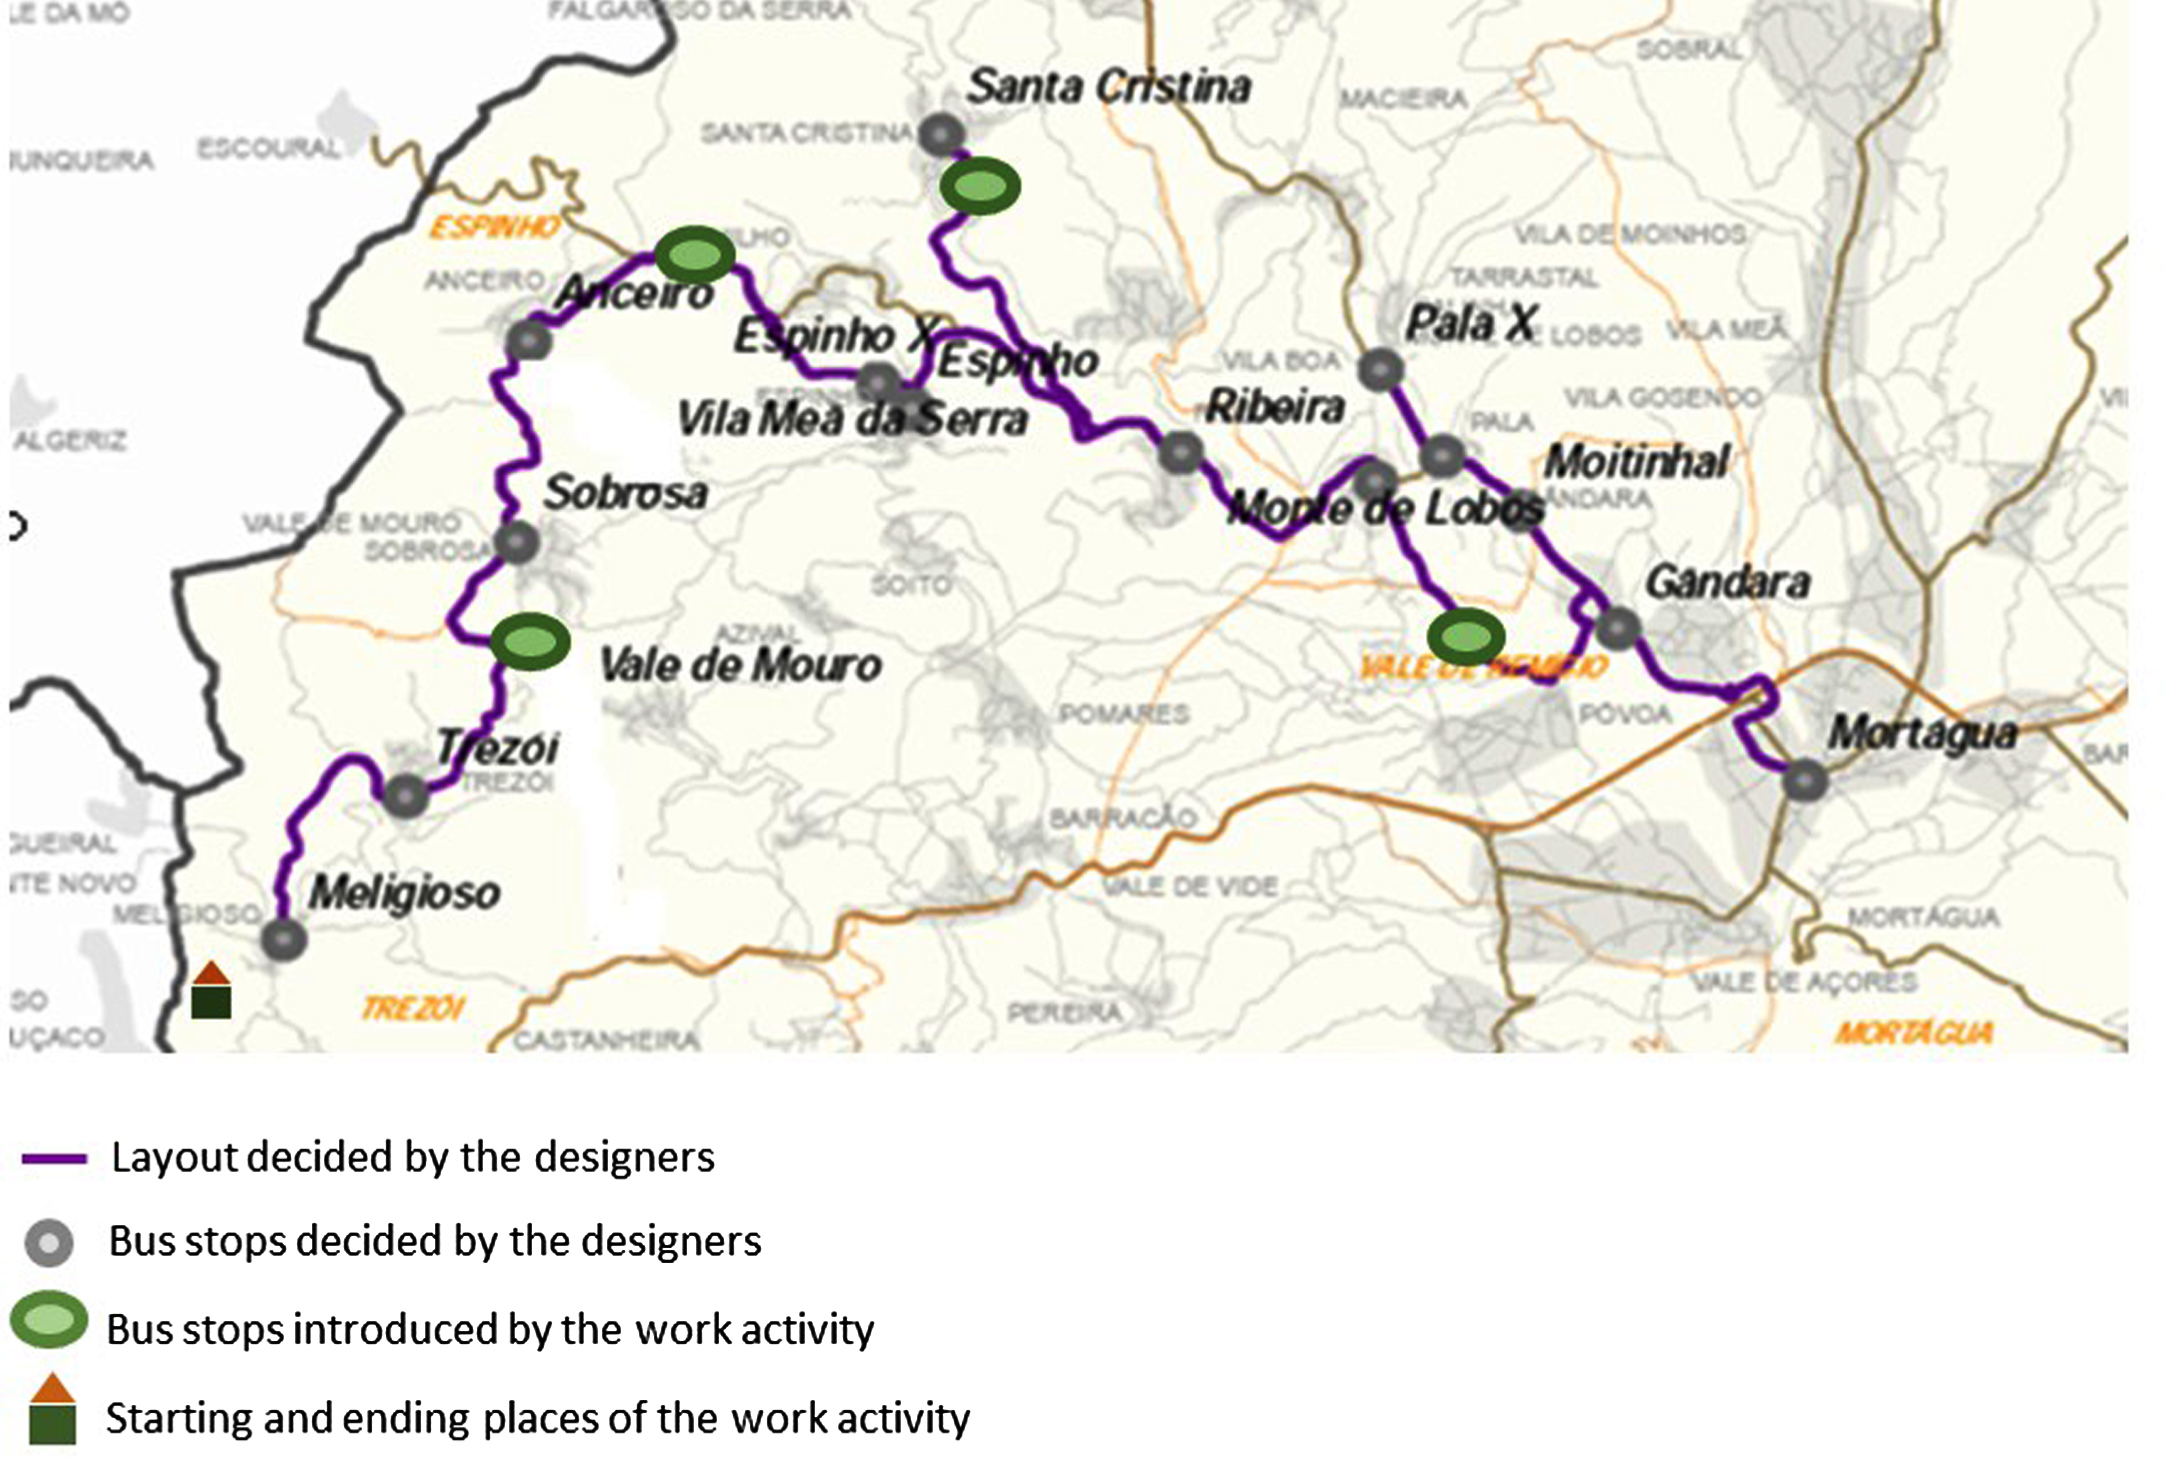
Map of one of the bus routes designed by the mobility designers (base layer) and of the traces of the deviations made along this line, and “inscribed” in the territory by and through the drivers’ activity (layer with the activity traces).
We have explored the sense of “place” the drivers mention, especially in the context of critical places that are left out of the transport network and thus require their proactive attention: (i) places along the route where drivers take detours, and (ii) alternatives they actively offer to mitigate asymmetries in the resources allocated to places (for instance, some people live more than 3 Km away from the nearest stop, or shelters may not be provided at all stops). We then identified these places as physical or symbolic “markers” of work activity on the territory, and made them visible as “inscriptions” [11] on the designers’ maps. These “inscriptions” are particularly interesting because they bring to light activity traces on the territory. We have, for instance, identified places where a stop is improvised using physical markers (see Fig. 3): a landmark, a post box on the road, or a café’s doorstep was chosen because the actual stop offers no shelter for the passengers. Other examples have to do with the place where the journey begins and ends (see Fig. 3). Here, this place is the driver’s house, as drivers on this network were assigned the route closest to their houses so that they could drive the bus home, avoiding additional costs for the company if it had to be driven empty for about 35 Km to its parking site. In turn, examples of symbolic markers are: the lack of any separation between the busses’ passenger entry and exit (there are no barriers to entry and the passengers do not show their ticket –they are daily users of the service); the existence of “regular” seats in the bus (one of the drivers, for instance, had ordered seats by age, with the front seats reserved for small children and adults asked to choose the back seats); or the fact that a place had been defined inside the bus to place schoolbags (to avoid children carrying their schoolbags while standing).
These analyses provided a strong contribution for a joint cartographic construction –that is, to integrate the point of view of work activity in the mobility network’s new design. The inscriptions of traces left by work activity on the territory, and their visibility, ended up reconfiguring the layout of the network draw by the designers and challenging its boundaries. It simultaneously brought into focus the inherent limitations to the idea of defining a network’s layout based on places’ population density and higher demand for public transport as the main criteria, by showing the mobility needs they would leave unanswered on this territory. The reason why other places had been added to their activity was precisely because the drivers knew their territory and were aware of its evolving dynamic.
While territorial indicators aimed to describe the territory, material inscriptions of the drivers’ activity traces were decisive in building bridges between distinct “worlds”, as boundary objects [9]. It cannot be ignored that designers and drivers “belong to two different worlds and their differences are mostly due to the fact that the solutions they advocate for are the results of the different places the ones and the others occupy [in this territory]” [28, p. 200]. At long last, those inscriptions facilitated a shared discussion between mobility designers, bus drivers, and municipal officials on a “representation for action” on this territory: answering citizens’ needs for public transport; redefining the transport network’s concession and expanding its territorial coverage; and discussing the drivers’ working conditions (by redefining route times to incorporate detours and additional stops, for example).
Our previous study encouraged us to move forward in our reflection on how an analysis based solely on statistical indicators results in “territory opacity” regarding the contribution of work activity.
This argument –that we should not rely solely on these indicators to express what a territory is –was also supported by a study at the cork “industrial district”, in the Northern Region of Portugal. This territory concentrates a large number of small and very small cork manufacturing companies, as well as a specialized workforce. The industry’s activity rate is high across the whole territory [29].
The study is part of a larger project called “CORK-In” [acronym name of Capitalizar, Organizar, Regenerar Know-How na Indústria da Cortiça –“Capitalising, Organising, Regenerating Know-How in the Cork Industry”]. This project set out to assess the impact of technological transformation processes (i) on the reconfiguration of the work experience; (ii) on the progress of the operating modes underlying “technical acts”, acts that improve the efficacy of a technique; and (iii) how work activity and workers’ knowledge heritage can challenge industrial automation projects in the small and very small companies that are prevalent in this industry[29, 30].
Methodology
In the previous study, we had “entered” the territory through an analysis of indicators, following the perspective of mobility designers’ activity. For this study, we followed a different methodological approach. To begin with, we performed work activity analyses with cork stopper choosers 3 . We led observations focused mainly on their body practices during 30 hours (gestures, postures, or movements the workers considered critical elements of their expertise); used video recordings and photographs to provide a more detailed description of certain activity traces (such as different uses of the body when selecting cork stoppers); led two collective interviews (lasting about 1 hour and 20 minutes each); and held one group session to return and validate our observation results (1 hour and 30 minutes).
We then took stock of these results, collected and anchored in real activity, and used them to explore existing indicators and to question the issues they reveal, as we will now explain. We reached out to institutions such as the Portuguese Cork Association, the Union of Cork Workers, the Institute of Social Security, and the local Family Health Units to explore available indicators. We combined those with an integrative literature review [31] aimed at including different sources produced at the business, union, public administration and scientific levels. We then followed through with a critical discussion of what work activity shows.
Results and discussion
Territorial indicators of the cork manufacturing process
Cork is the only industry in which Portugal is a world leader in terms of production, processing, and exports [32].
Cork production and processing both take place in well-defined territories: the raw material is produced mainly in the Southern region of the country, and 82% of it is then processed in the North. The cork industry employs 7 009 people in this region, where 96.6% of Portugal’s natural cork stoppers are produced [33]. Data from 2016 shows employment in the industry was slightly rising (+0.3%)[34].
Cork manufacturing companies are organized in a cluster, they are all linked together and located in a delimited geographical area, which makes this territory an “industrial district” [35], even though its boundaries do not match any administrative territorial division. The cork industry concentrates around 78% of all the work activity led on the territory.
This “industrial district” owes its sustainability to different factors [36]: (i) in this predominantly single-industry area, among small and very small companies (74.5% of these companies have under 9 employees), one subsector is especially prevalent –cork stopper production (356 out of 487 companies) [37]; (ii) companies form a network around one large corporation –the “anchor-company” –which determines the surrounding companies’ production capacity (and flexibility); (iii) the fast pace of technological innovation, driven by external “threats” (the increasing demand for synthetic stoppers, which are cheaper than cork stoppers), and the companies’ belief that technological investment is the key to differentiation and competitive advantage in this market segment; and (iv) its ability to thwart attempts at creating other cork transformation clusters located in Southern Portugal, closer to cork production [30].
Our analysis of available indicators and previous knowledge of work activity in relation to its context draw attention to the various degrees of recognition of labour activity in territorial development, as discussed in the following sections.
There are more indicators about cork production than about work activity
On the one hand, currently available indicators regarding cork production and processing show how territorially segregated they are and, on the other hand, they shed light on a clear territorial differentiation in know-how.
Cork is the bark of the cork oak tree, and 96% of the country’s total national area of cork oak forests –called montado in Portuguese –are concentrated in the South of the country. It is common knowledge in Portugal that cork oak is the second-most widespread tree species in the country, after eucalyptus. The area covered by latter is currently growing in faster than the former’s (+6.1% versus +0.8% from 2005 to 2010) [38].
Indicators also provide the rate at which a cork oak produces cork: it takes 25 years before the tree can be harvested for the first time, after which it can only be harvested every 9 years. Only starting from the third harvest, when the tree is 43 years old, does the cork –then known as amadia cork –reach the standard of quality required for producing cork stoppers (Decreto-Lei no. 169/2001, May 25). Harvests take place on a seasonal basis between May and August. Cork is extracted “by highly experienced professionals to avoid damaging the trunk” (representative of the Portuguese Cork Association –APCOR). After the harvest, cork boards rest for 6 months. Only then can they be processed.
In addition to these domestic indicators regarding the cork industry, indicators on exports are regularly released. 62.1% of the world’s total cork exports are from Portugal, placing the country ahead of any other in this industry [33].
As we have mentioned before, the territories where cork is produced and where it is processed are clearly separated 4 . None of the indicators we found reflected the coordination between these two territories and their production rhythms. The only exceptions to this territorial segmentation are recent projects led by the cork industry to reduce the harvest interval 5 , in an attempt to challenge the course of nature and its age-old production cycle.
When addressing development and sustainability issues, the industry treats its dependence on a single raw material, its vulnerability to potential plagues and competition from metal or plastic components as “threats” [38].
Even though work activity is crucial to the survival of the “cork industrial district” embedded in the territory, existing indicators fail to mention its contributions, its heritage knowhow that treasures the territory, a legacy of experience going down generations of workers [39].
In summary, while indicators exist that allow to analyze transformations in cork-producing territories (such as a map that identifies places with the best characteristics to grow cork oaks, for instance [40]), the lack of any indicators based on work activity persists. This impedes on any attempt at mapping the work experience, work-related risks and health impacts on this territory.
The prevalence of indicators on diseases in cork oaks over indicators on occupational diseases in the cork industry
To look at the territory as matter-of-concern [5] means to question it, to explore causes for debate on it, to find what it is missing. As we have mentioned above, the main preoccupation in discussions about the cork territories is the evolution of the montado, while any point of view informed by work activity is generally overlooked. This is particularly concerning at a time when automation projects for cork processing are moving frontstage, leading to upheavals in work activity and therefore to impacts on health and new risks. In fact, most companies in the industry do not even collect this type of data in any form.
Thus, we have led an integrative literature review on sustainability challenges for the montado as compared to the sustainability challenges for work activity and workers in cork processing, and noted how scarce the knowledge produced on the latter is.
A search for papers about cork oak diseases and about occupational diseases in the cork industry mostly yields references on the first topic. We also found a larger number of organizations studying cork oak illnesses and most projects involving both the scientific community and local communities address the topic of cork oak diseases. A search for papers indexed in the Scopus and Web of Science bibliographic databases also evidences this disparity. Using keywords and hand searching on the references (citation tracking), Scopus returned 120 entries for quercus suber diseases and 29 for cork worker’s diseases; Web of Science yielded 78 and 13,respectively.
As for risks in terms of the sustainability of employment in cork processing, although there is little scientific interest in the topic, we should mention some attention given to suberosis, known as “corkhandler’s disease” [41] or, in Portugal, as the “most Portuguese occupational disease” [42], given the importance of the cork sector in the country. Yet there is a lack of data concerning the number of workers diagnosed with suberosis or the disease’s prevalence per activity or length of exposure. The papers that address the disease do not mention work [e.g., 43], nor does the diagnosis incorporate references to concrete working conditions.
One specific paper about suberosis [44] mentioned that, although scientific knowledge of the biological effects of inhaling cork dust was not complete, the immunologic and inflammatory response of the lung to it was established. Recently, a paper published by Portuguese researchers [45] described findings concerning a type of cancer –sinonasal cancer –in former cork workers, who were exposed to cork dust along their professional trajectory. The sample consisted of patients from a prominent cancer hospital, whose area of intervention includes workers from the South of the country. The study evaluated 379 patients with sinonasal cancer (SNC), 39 (10.3%) of whom had intestinal-type sinonasal adenocarcinoma (ITAC), a rare epithelium tumor of the nasal cavities and paranasal sinuses.
In 2021, another paper published by a team of researchers from Italy [46], where the cork industry is also important, cited Alpuim Costa et al. [45], and provided corroborating evidence for their finding: “Suberosis is a recognized form of pneumoconiosis that affects cork workers, while only recently, SNC cases were observed (prevalently intestinal-type adenocarcinomas) among subjects occupationally exposed to cork dust” (p. 8).
Data indicate the disease could be more prevalent in the North of the country, where most cork manufacturing companies are located. However, data collected so far does not provide enough evidence to establish causality between work in the cork industry and this rare type of cancer.
Consequently, the absence of indicators to observe the evolution of such impacts on health compromises possibilities to act on the risks which most workers on this territory are or have been exposed to. Here, this type of indicators’ greater or lesser visibility is not an intrinsic characteristic of the object of analysis; the expression “absent indicators” refers to an absence of the conditions to render them visible [47].
The results of this study show we know more about the production, lifespan and harvesting rhythms of a cork oak than we do about the accumulated exposure to risk factors in work activity and their likeliness to lead to the development of occupational diseases.
Indicators remain absent, precluding any monitoring of this hazard or informed decision-making regarding it, and improvements in working conditions and workers’ health are deferred.
Traces of body uses in work activity
Following cork stoppers along their selection process, we would first see them being selected by automatic choosing machines, which categorize them according to the look of their surface and the visible defects they can identify. These machines are supervised by choosers, as they cannot detect all the types of defects found on cork stoppers. Then, they are manually selected along conveyor belts. Choosers pick stoppers according to quality ranges and the presence of defects (such as cracks, little holes caused by insects, or excess moist in the cork). These women do so at a pace they can control, to be sure of their choices, while always bearing in mind production demands.
Our observations and the interviews brought to light different ways to look at defective cork stoppers and to “pick” them, each with its own impacts on health: “The more I pick [cork stoppers out of the conveyor belt with different types of defects], the more I feel pain in the neck and shoulders”; “I’ll also grab [a handful of cork stoppers, instead of picking one at a time from the conveyor belt] if I‘m taking a lot of them [to avoid pain]”; “Sometimes, it seems like I am juggling when I choose cork stoppers... other times I throw them behind my back –but that’s only when there’s few of them!”
Choosers engage their entire body to perform their job. To begin with, they use their hands to grab and touch, to feel the texture, to distinguish ranges and defects in the cork stoppers (cf. Fig. 4).
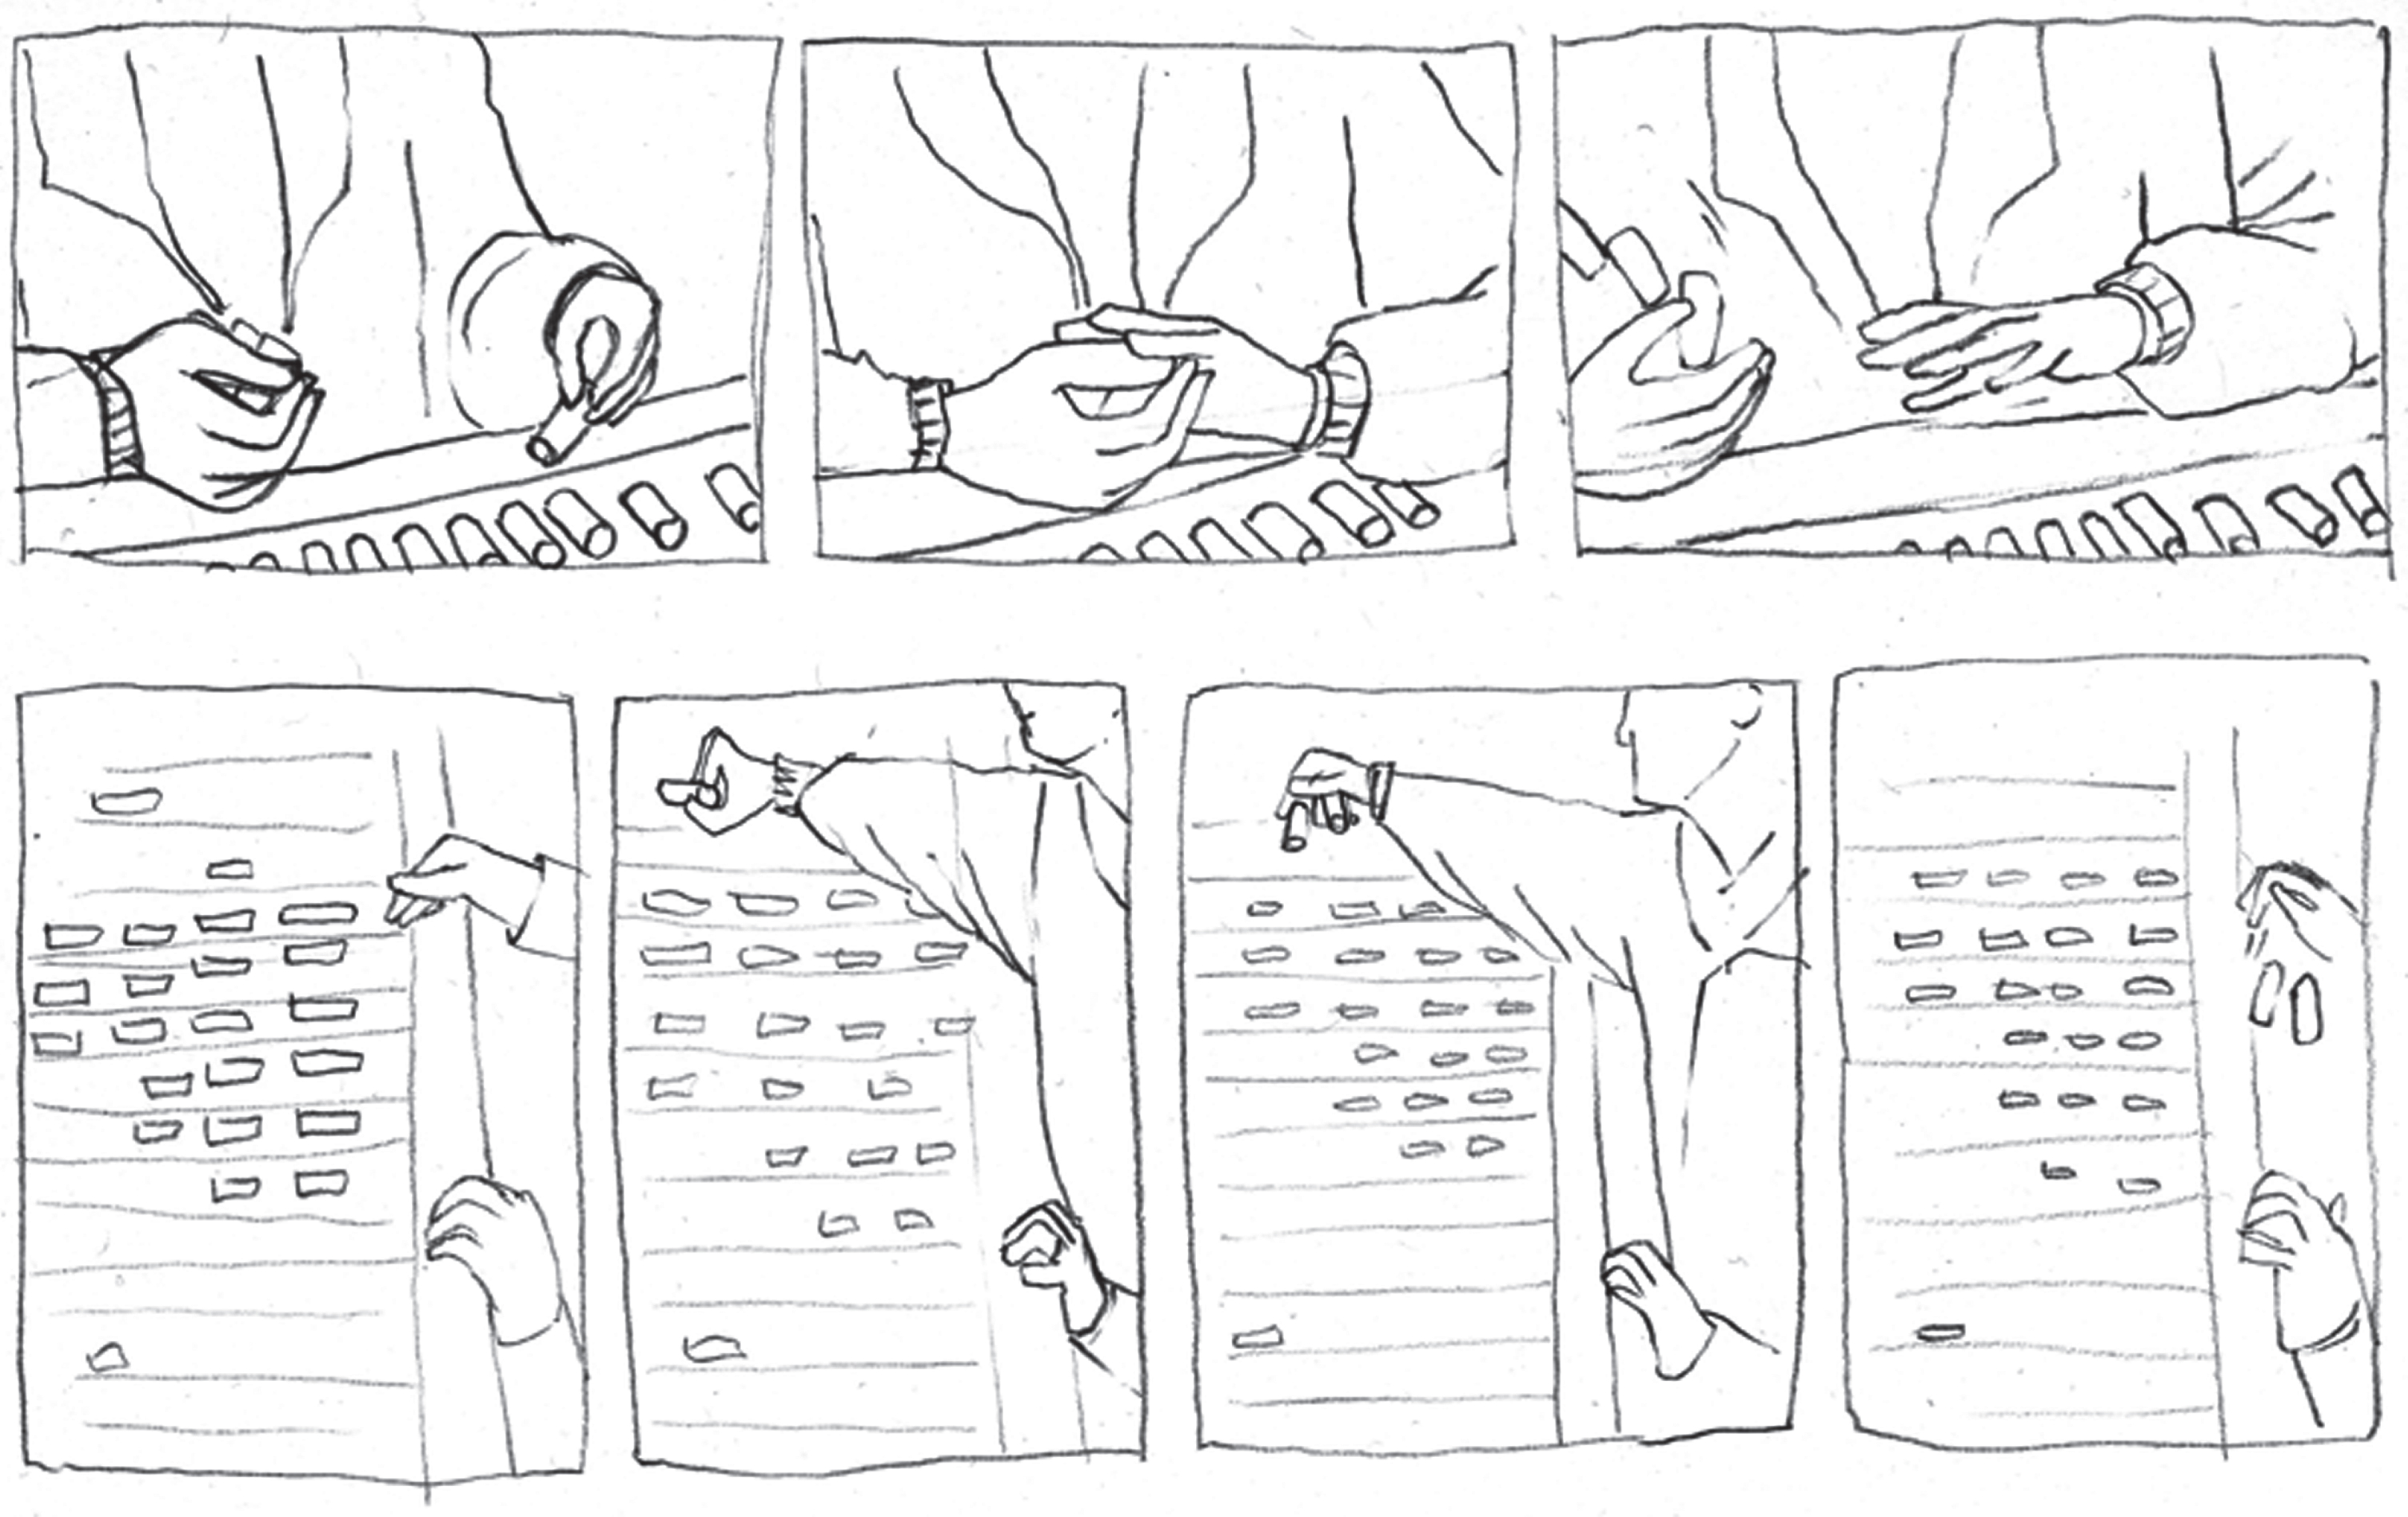
Operating modes associated with “technical acts” in cork stopper selection, based on reference situations defined by the choosers.
The operating modes associated with these “technical acts” were traced based on reference situations defined by the choosers themselves: touching the cork stoppers, whether lightly or firmly, watching them up close; pinching them between their thumb and forefinger, when they are sure a specific cork stopper “cannot go through”; and keeping one hand free or deliberately using it to grab a bunch of cork stoppers “to spare one’s body”.
Moreover, they also make use of other senses in their choosing work. The most recent technological change with an impact on work took place in 2020, with the introduction of so-called “sniffing machines”. These machines were introduced with an aim to ensure the quality of cork stoppers against the risk of contamination by Trichloroanisole (TCA), a microbiological defect that can cause wine to “taste corked”, which is a major concern in the cork industry. While TCA can be entirely removed from “technical stoppers” (lower grade cork stoppers, produced from granulated cork), it cannot yet be fully eliminated from “natural cork” stoppers, the high quality corks used for the best wines.
Thus, in addition to the visual selection, choosers carry out a “sniffing” selection, which consists in smelling the cork stoppers after they have been heated by the “sniffing machine” and checking for the “mouldy” and “musty” smell of TCA.
The struggle against TCA is overwhelming and overshadows the consequences for the health of the workers who select by smell. Work is organized so that choosers do not stay longer than an hour on end in the “sniffing” position. After an hour, they revert to manual cork stoppers selection, to preserve their ability to perform a sensory discrimination [29].
Despite this rotation, workers describe different effects of “sniffing”: a dry nose, nosebleeds, difficult breathing. And yet, these health issues remain underreported. Three factors may explain this: (i) the workers themselves consider many of these symptoms as trivial because they disappear once they wash their nose with physiological saline; (ii) the exposure is not long enough to raise awareness concerning the relationship between their working conditions and health issues; (iii) most companies are small and very small companies, who are not required to have an occupational doctor; and (iv) any light shone on occupational risks and health impacts in the cork industry is perceived as a threat to the sustainability of this “industrial district”.
Thus, it is reasonable to state that all the senses are involved in the choosing process: sight, touch, hearing (when workers listen to the automatic selection machine while manually selecting stoppers on the conveyor belt and intervene when it jams, for instance), smell, and even taste (especially when workers choose food they can eat or manipulate that will not interfere in sniffingselection).
By bringing into focus “absent indicators”, work activity analyses finally bring forth a debate between prosperity (with, for example, TCA and cork oak diseases threatening the forests’ sustainability, with all the economic impact this could have) and health at work.
The challenge lies ahead of us: to create conditions for the inscription of the traces of these workers’ experiences (such as types of defects that cannot be detected by automatic selection machines), and their health costs (such as occupational diseases) as territorial indicators. Using material forms of mediation to translate the inscription of this work activity in the territory (like tracing the operating modes associated with “technical acts”) is the first step towards recognizing how the workers’ activity contributes to the valorization and sustainability of this “industrial district”, at the cost of their ownhealth.
The reflection we are engaged in has a part to play in the debate around the political dimension of ergonomics and its potential for transformation reaching beyond company scale [48]. Two broad and intermeshed points emerge from the case studies presented here. On the one hand, there is the heuristic potential of territorial analysis, as became clear in the first study, insofar as it was our focus on territory that allowed us to understand local actor’s commitment to act through their work activity to better the local community’s living conditions. In the second study, this point of view reveals how fear that occupational health hazards in the cork industry might jeopardize employment on the territory leads to an omerta surrounding these issues. On the other hand, there are the contributions of territorial analysis to the field of ergonomics, as its subject matter, work activity, can be looked at in relation with territorial development projects.
The place from where we analyze the territory changes our perspective on it. To paraphrase Latour [49], we may say that viewing the territory from above (upside/down, “à l’envers”), from the point of view of statistical indicators, gives one the illusion of having a wider and more immediate perspective on it. Shifting our perspective down to earth (“à l’endroit”), down to work activity at the local level, we lose the implicit notion that the entire territory is covered –what matters is no longer geographic span, but rather a commitment to action with those who live and work on thatterritory.
However, this commitment to act is not self-evident, and it shouldn’t necessarily be assumed to exist. Projects to develop the territory are not one-way paths. Many tensions can emerge and raise questions about the possibility of a consensual approach to the Common Good. In the first case study, the City Hall agreed to reconfigure the transport network so as to cover the territory more broadly, based on the inscription of traces of the drivers’ activity in the network layout. In the second study, it was controversial to discuss the health impacts of cork sniffing at a time when it was so prevalent on the territory and such a crucial part of ensuring the quality of its cork stopper production. The commitment we were able to make was to return the results of this study to the Regional Health Delegate, as most of the companies concerned were small or very small and therefore did not have an occupational healthservice.
This means that, while work activity participates in producing the territory, territorial development can also be conceived of as stemming from the improvement of working conditions. The construction of a common understanding of the territory is crucial to gain control over what determines working and living situations within it [50], over the conditions under which work activity is performed and the risks workers are exposed to. What is at play in this situation is not so much “occupational hazards” but rather risks that emerge from the use of oneself, one’s experience and knowhow [51], in an effort to preserve the territory.
Thus, the challenges that arises from these studies’ contributions are to find a way to ensure that these territorialisation processes are recorded and that occupational health conditions are recognized as territorial indicators, and to create the conditions for this information to be shared and used at territorylevel.
Conflict of interest
The authors report no potential conflict of interest.
Ethical approval
Not applicable.
Informed consent
All participants provided informed consent for contributing to the research presented in this article.
Funding
This work was supported by national funding from the Portuguese Foundation for Science and Technology (UIDB/00050/2020) and the FCG – Calouste Gulbenkian Foundation within the framework of the ‘CORK-In’ project.
Footnotes
This nomenclature was devised by Eurostat to harmonize statistics across diverse regions. Its classifications describe territories with the different geographical scales (NUTS I, II and III) functioning as a hierarchical system. Even so, there can be considerable heterogeneity between territories that belong to a same scale of analysis.
This activity is performed exclusively by women. The “choosers” select the cork stoppers (which are manufactured by the punching operators), based on their visual appearance (their level of porosity, for instance), and defects (such as cracks or little holes caused by insects), as well as according to each client’s quality criteria [cf. 29, for a detailed analysis].
While cork production and processing belong to two different economic sectors –forestry and manufacturing –the segmentation described in this paper is not due this division. We have actually come across more references to the “cork production chain”, than to cork production or processing in isolation. Our focus here is mostly on territorial segmentation.
One of these projects is led by the only large corporation in the cork sector. Its goal is to reduce the number of years before a cork-oak tree can be harvested for the first time through the development and implementation of an optimized irrigation system.