
Abstract
The expansion of social media, technology, and online shopping will eventually speed up massive development of retail industry. Retailing organizations are trying to figure out how the usage of big data analysis may enable them to make the correct decisions as we see Big Data as one of the buzzwords sweeping the IT world by force. Therefore, the current study’s objective is to investigate and assess the function of big data and its consequences on the retail business with the support of employees and managers from the Indian retail sector. The main factors covered in the study include big data technologies like data sources, data analysis, data storage, data security and privacy, real-time processing, and messaging system. This study employs a quantitative technique and performs Partial Least Square Structural Equation Modeling (PLS-SEM) to analyze the effects of big data in the retail sector. The study findings revealed that data analysis, real-time processing, and messaging system significantly impact the performance of the retail industry whereas, data source, data storage, and data security and privacy do not significantly impact the performance of the retail industry. Various aspects discussed in the study revolving around big data technology are important factor and demands the maximum attention of the organization such as inventory utilization, customer involvement, and current value in the retail sector. The study recommends that in order to succeed, businesses of all sizes must make sure they are competitive. As internet businesses engage with their customers in real time, the rivalry heats up. Big Data analysis may benefit merchants in the following ways.
Keywords
Nomenclature
Analysis of Variance Average Variance Explained Big Data Analytics Customer Relationship Management Fornell-Larcker Criterion Hetero-trait Mono-trait Structural Equation Modeling Small And Medium Enterprises
Introduction
The world has an incredible amount of data, and that amount is only increasing. Computer systems store a significant amount of data. Organizations in the marketing industry are gathering an enormous amount of data, and the technologies, networking sites, and internet shopping may ultimately accelerate rapid development [14]. It might be difficult for many firms to maintain massive data quantities and the associated unusual data architectures. The development of data is considered feasible by the growth of increased online access and the accessibility of new data formats for data processing. Access to different data types has become accessible due to the invention of mobile, tablets, and other electronic devices [3]. The information is gathered because retail businesses, especially those involved in some forms of e-commerce [28], see it as a source of potentially valuable data that, as a strategic asset, might provide them an advantage over rivals.
One of the world’s most significant industries is retail [27]. This sector of the economy is predicted to expand as middle-class populations and purchasing power both grow significantly. Retail purchases made through m-commerce and e-commerce are increasing quickly as a result of the development of quick internet connections, advancements in mobile applications and network technology, growth of e-commerce businesses’ product offerings, a variety of shipping options, and continued improved payment information [15]. Retailing is the process that businesses use to sell goods and services to customers through a variety of distribution channels, including wholesalers, retailers, agents, and jobbers, to increase profit margins. To make sound business decisions, the retailing process entails a variety of steps, including information gathering, data analysis, and solution provision [6,16]. Improving the retailing industry involves intensifying a massive number of data utilizing cutting-edge technology like big data and business analytics [42].
Big data enables digital data surfing, social platform analysis, information acquisition, and evaluation of mobile-specific information [37]. It supports the retailer in efficiently determining the needs of the client and delivering improved services [8,41]. It aids the business in analyzing consumer preferences and identifying market trends. Big data is also used by retailers like Amazon to collect, curate, and evaluate data to make important business choices. Big data also offers data privacy, records customer experience, projects sales, and offers recommendations for typical decisions [34].
The implementation of big data can be coordinated with the business intelligence technologies necessary to offer sensible support for organizational processes [29]. To become heterogeneous, the enormous number of data required must be collected, filtered, stored, and examined. Business intelligence techniques and tools are required since filtering and interpreting data is a fairly difficult process [1]. Big data management is specifically described as a set of data and technology that accesses, integrates, and reports all available data by filtering, correlating, and reporting insights that are not possible with prior data technologies [13]. It is becoming a crucial component of businesses. Due to its potential to generate commercial value [33], big data is seen as the “future big thing in technology development.” Providing smart data and generating a competitive edge through the improvement of data-driven decision-making and the processes of organizing, learning, and inventing at multiple levels, big data can generate actionable ideas for delivering sustainable value [7].
Big data analytics in retail allows for the detection of consumer behavior, the identification of consumer shopping patterns and trends, the enhancement of customer service standards, and the achievement of higher levels of customer satisfaction and retention [40]. Such enormous data sets are also useful for predicting trends and formulating strategic choices based on market analysis [43]. Retailers must alter their marketing and sales strategies to reflect the fact that customers’ preferences and purchase patterns are always changing to create ground-breaking choices [23]. This information can help retailers better understand their consumers’ demands and make decisions regarding price, marketing, and purchases that will increase sales [21]. Therefore, this study demonstrates the difficulties and possibilities associated with big data and analytics for improving the retailing process. The main factors covered in the study include big data technologies like data sources, data analysis, data storage, data security and privacy, real-time processing, and messaging system.
Big data significantly altered the segmentation process in the retail sector. Retail businesses can more clearly describe the customer profile to meet extremely specific needs by offering additional information. The main objective of this research to be concentrated is:
To investigate the effects of big data on the retail industry.
To understand the difficulties and opportunities provided by big data for improving the retailing process.
To explore the retail industries’ big data planning and forecasting capabilities.
To emphasize the current and potential uses of big data analytics for improving the retailing process.
The research question to be clarified in this research work is do big data analytics is helpful in retail industry? and (ii) Do features of big data analytics like data source, data analysis, data storage, data security and privacy, real-time processing, and messaging system?
Work Contribution: A large variety of commodities are now available to customers through retail stores, both in the organized and unorganized sectors, and retailing has fundamentally changed business. Retailing organizations are developing marketing strategies determined by data to be highly competitive and sustain growth [18]. This has led to a paradigm change in retailing, wherein data is now considered as a resource for the company in determining consumers’ urgent requirements, forecasting their purchasing patterns, and recommending performance indicators to gauge efficacy [19]. Retailing businesses are figuring out ways to extract useful data from huge datasets that are produced by many sources and in various forms [35]. Retailing organizations are trying to figure out how the usage of big data analysis may enable them to make the correct decisions as we see Big Data as one of the buzzwords sweeping the IT world by force. By concentrating on the above-discussed area, the purpose of this study is to evaluate how big data is affecting the retail sector.
The research paper is divided into five sections to accomplish the study’s goals and objectives. The second section discusses the theoretical underpinnings of the investigation and evaluates relevant literature on the functions of big data and its impact on the retail industry. The third section establishes the framework for the proposed hypothesis. The methodology for gathering the empirical evidence is next described. The analysis, findings, and discussion are presented in the fourth section. The final portion examines the study’s conclusions, limitations, contribution, and recommendations for future investigations.
Literature review
The researcher has chosen to base this research on a thorough evaluation of the existing works of literature to offer a qualified opinion regarding the effect of big data on the retail business. The majority of the literature genres will be textbooks, journals, and prior studies. This study will be based on both quantity and research to provide the individual with thorough information on the subject role of big data in the business organization. The researcher strives to make this study understandable and clear so that the reader can absorb the information fast. Research on these publications or books was done to provide more details about the big data technologies involved in the retail industry.
Related works
In 2022 Abdalwali Lutf et al., [20] investigated the causes and effects of BDA (big data analytics) adoption in the Jordanian retail sector. To acquire the required information, they performed a survey via the internet and 132 responses from the Jordanian retail industry were used to confirm the research design. They carried out partial least squares structural equation modeling using the data they had gathered. Their results confirmed that BDA adoption had a significant impact on SMEs retailer performance. They also found that BDA adoption and company performance have a strong correlation, which focuses on how companies may implement big data more widely for performance improvement.
In 2020 Song Ying et al., [44] examined the usage of big data analytics and its impact on customer relationships and organizational performance. For data collection, they structured a questionnaire and distributed it to the 500 Singaporeans working in the retail sector. They performed descriptive statistics with the collected data. The outcomes revealed that social media analytics has been heavily used among the various big data analytics inside Singapore’s retail sector, which impacts customer satisfaction and organizations performance.
In 2021 Hemlata Gangwar et al., [11] identified the potential drivers of big data analytics (BDA) practices in the supply chain and develop a sustainability evaluation model to evaluate drivers of big data for sustainability development. They conducted the survey and collected information. With the gathered information they performed partial least squares structural equation modeling analysis. Their results support the application of BDA in supply chains for enhancing their social, economic, and environmental sustainability and further support managers in making ongoing trade-offs between the demands for ethical, ecological, and market performance.
In 2022 Sheshadri Chatterjee et al., [5] examined the potential impacts of big data and customer relationship management capabilities on an organization’s strategic sales performance. They also investigated how the relationships between managing the customer relationship competence and better retention abilities were mitigated by strong leadership. They gathered data from the 312 respondents with the structured questionnaire and performed structural equation modeling. The results demonstrated that improving customer relationship management capacity can increase an organization’s strategic sales performance and also suggested that businesses must maintain profitable relationships with their current and potential customers.
In 2021 Abeeku Sam Edu [10] demonstrated how big data analytics (BDA) capabilities can be used to significantly increase the flexibility of the financial services industry. The researcher gathered data based on the viewpoints of 485 banking professionals who participated in a survey about BDA utilization, IT competence development, and financial service agility. Through the collected data he conducted PLS-SEM. The researcher’s outcomes revealed that the innovative Big data application based on the concept of IT competence that financial advisory agility may be increased given that organizations obtain technical skills together with other important resources.
In 2021 Parisa Maroufkhani et al., [24] explored how technological, organizational, and environmental elements may affect the adoption of Big Data Analytics (BDA) among Small and Medium Enterprises (SMEs). They also evaluated the moderated effect of ecological factors in the relationship between organizational readiness, relative advantage, compatibility, and competitiveness. The data were collected from 171 small and medium enterprises manufacturing firms and with the collected data they performed PLS-SEM analysis. The result contributed that the support from top management acted as a mediating factor between the deployment of big data analytics is influenced by adaptability, profitability, and organizational readiness.
In 2021 Ahmad Ibrahim Aljumah et al., [2] analyzed the effect of big data analytics capabilities on the operation of the organization. Also, they evaluated the relationship between organizational performance and big data analytics capabilities, additionally, the mediating function of dynamic capabilities and the moderating role of the business value of big data analytics. For data collection, they prepared 650 questionnaires and distributed them among the manufacturing firms. They performed partial least squares structural equation modeling. The results demonstrated that to attain high performance for the company, managers must take into account the dynamics of business value and quality.
In 2019 Eunil Park [30] investigated the potential drivers of frequent consumer behavior about particular services. They also analyzed the impact of user experience using the big data method. The researcher collected data from more than 100,000 user comments in internet reviews. With the collected data he conducted structural equation modeling. The researcher’s outcomes demonstrated how hedonic values and user burdens, two aspects of user experience, have a significant impact on customer satisfaction and subsequent visits. Table 1 shows that the review analysis of conventional methods.
Review analysis
Review analysis
According to the available research, [20] provides information about how BDA adoption contributes to performance improvement. [44] it found that the viability of big data management was directly correlated with a lack of competent workers, which was a critical aspect. [11] it will enable managers in making ongoing trade-offs between the demands of social, environmental, and economic performance. [5] big data and CRM-related capabilities must be supported by organizational leadership. [10] the efficiency of financial services may be increased if businesses built technological resources with other useful resources. Additionally, [24] focused on the effects of organizational preparation and compatibility on top management support moderated by environmental factors. Moreover [2], helps to understand how big data analytics may improve organizational performance. According to [30], empirical facts reveals that online services should focus more on encouraging users to express themselves emotionally. All existing studies focused on The use of big data analytics, big data management, and customer relationship management competencies are examined. Therefore, this study intends to investigate the function of big data and how it affects the retail sector.
Research hypothesis and framework
Over the past several years, there has been a significant change in how people purchase at stores. Due to the increase in brick-and-mortar stores and online retailers, competition is fiercer than ever. Instead of losing consumers to the flexibility of online shopping, today’s businesses are learning how to embrace the changes driven on by technology [26]. Predicting the behavior as well as preferences of both new and current customers poses the largest difficulty for merchants when it comes to marketing. Highly effective real time analytics enter a completely new era with the introduction of Big Data. This in turn offers far more precise indications of consumer buying behavior and the capacity to anticipate consumers’ interest in any given good or service at the time when they are thinking about making a purchase [45]. Big Data analytics can unquestionably provide marketers with the resources they need to improve performance. By using consumer analytics to find, understand, and take action on important data insights, big data analytics has the potential to help businesses remain on top of the latest buying trends. Retailers, both offline and online, are implementing the data-driven decision-making technique to comprehend their customers’ purchasing patterns, match them to items, and design marketing campaigns to sell their goods and generate higher profits. Right present, big data analytics is being used to anticipate which items will be popular as well as to identify the clients who are most likely to be passionate about them and what to offer them next [4].
Since both organized as well as unorganized retail firms, as well as government agencies, are collaborating to improve the retail marketplace while maintaining the welfare of the consumers in mind, the long-term prospects of the retail industry in India appears to be bright [31,36]. The Indian retail business is one of the fastest-growing in the world and is anticipated to increase from US dollars 672 billion (2017) to US dollars 1,100 trillion (2020) [38]. The organized retail industry in India, estimated at $60 billion, accounts for just 9% of the whole retail market; the other 90% is made up of the unorganized retail market.
The scope of the research work is to determine or explore the big data techniques impacting the retail industry. At end of the study, the result shows that a lot of respondents agree with the way that the majority of companies use big data nowadays. The outcomes revealed further the various big data analytics used in the retail industry. Therefore, the study highlights the difficulties and possibilities associated with big data and analytics for enhancing the retailing process [22]. The retailing process includes many steps like information collecting, data analysis, and solution provision to ensure that crucial business choices are made correctly. It involves intensifying a massive number of data using cutting-edge technology like big data and business analytics to improve the retailing industry. Big data is the expression used to designate data sets that are too big or complicated to be handled by conventional data-processing application software. The statistical power of data with more fields is stronger, but the low error rate may be higher in data with more complexity. Therefore, in this study, we will learn to know the effects and impacts of big data, the various causes, and how to handle them.
Turning to the key aspects of Big Data analysis in the retail context identified in the literature six factors were retrieved and hypothesis is proposed as follows:
Data source creates a significant impact on the retail industry.
A data source is how far the data was collected. It may be a real-time data stream or a specific database on a file. The program’s host computer may contain the data, or it may be on a different machine connected to a network. The measure to which a source’s data are subject to integrity and schema constraints that set the acceptable range of data values heavily influences the quality of the data it produces[17]. Large amounts of big data are utilized as the starting point for searches and grouping the data as per specified criteria that may be relevant for future targeted marketing. Therefore, this study analyzes the impacts of data sources on the retail industry.
Data analysis creates a significant impact on improving the performance of the retail industry.
Organizations use a qualitative approach to data analysis that incorporates statistical techniques. Real-time data collection and analysis are part of an ongoing, iterative process that makes up the analysis [9]. Big databases are explored for buried or previously unknown information using a variety of criteria, and data analysis techniques are then utilized to extract this data, allowing for the identification of patterns and relations. Therefore, this study analyzes the data analysis tools’ effects on the retail sector.
Data storage creates a significant impact on enhancing the retailing process.
Data storage is the process of storing data on the recording medium for later retrieval by computers or other devices. File storage, block storage, and object storage are the three most used types of data storage; each is best for a particular use [39]. Data storage is the act of preserving information in a digital format so that it can be recovered at a later date. Therefore, this study analyzes the impacts of data storage on the retail industry.
Data security and privacy create a significant impact on the retail industry.
The company’s most important biggest asset of the business is the information that the companies gather about its clients. From both the companies and the customers’ perspectives, the security and privacy of sensitive data are major issues. Data privacy and security are also crucial elements of electronic commerce [12]. It is the activity of preventing unwanted access, corruption, or theft of digital data across all stages of its life. Therefore, this study analyzes the impacts of data security and privacy on the retail industry.
Real-time processing positively and significantly impact the retail industry.
Real-time data processing is the execution of data in a brief amount of time to produce an almost instantaneous result [25]. A continuous stream of input data is required to produce a continuous output since processing occurs as the data is entered. Data processing occurs almost instantly using this technique. Due to this, it completes processing quickly. Therefore, this study analyzes the impacts of real-time data processing in the retail industry.
Messaging system creates a positive impact on the retailing process.
A messaging system’s primary responsibility is to safely transfer messages from the sender’s machine to the receiver’s machine [32]. Data is transferred between apps through a messaging system, freeing the programmer to concentrate on the data themselves without being distracted by the exchange and transmission of data. Reliable message queuing serves as the foundation for distributed messaging. Therefore, this study analyzes the impacts of messaging systems in the retail business.
Figure 1 states the variables affecting big data in the retail industry. This research study demonstrated the big data technologies influencing the retail industry as a) data source, b) data analysis, c) data storage, d) data security and privacy, e) real-time processing, and f) messaging system.
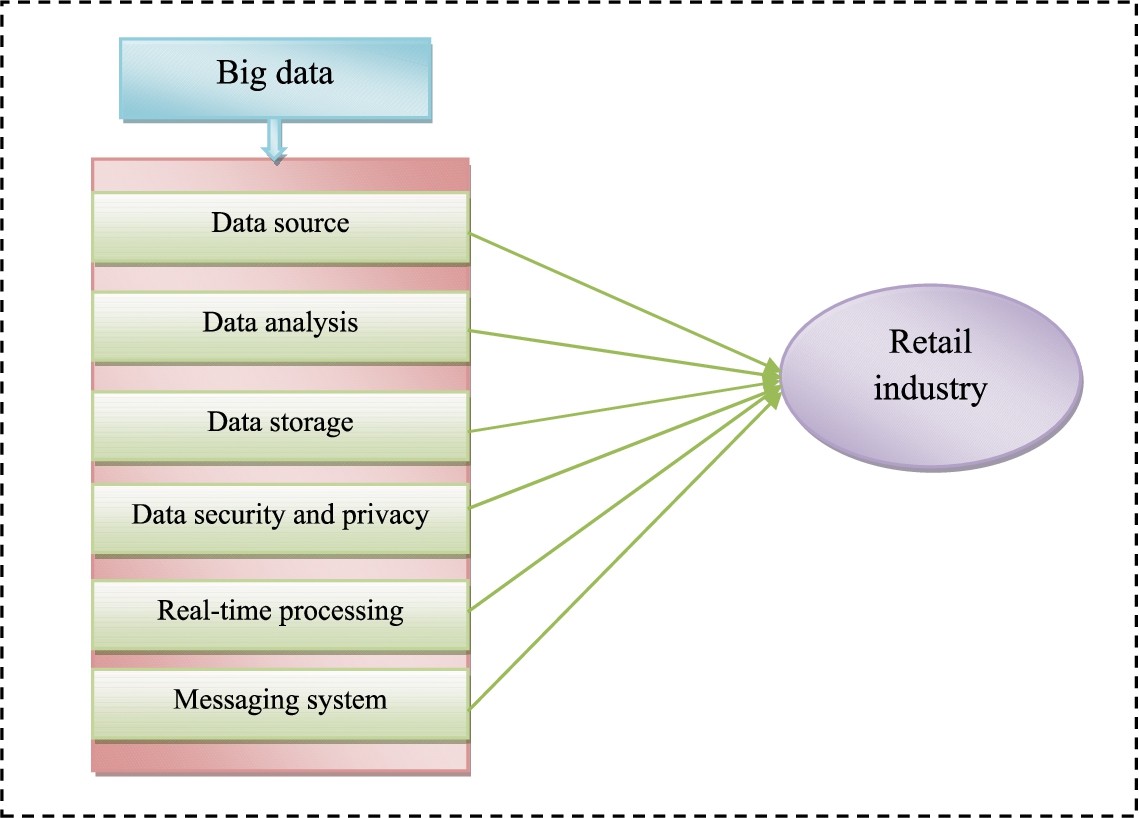
Research hypothesis framework.
The research methodology was developed after the conclusion of the literature review survey largely from listed journals. The variables found that recurred during the literature review are the focus of the research technique. A study model was developed to comprehend their dominance after a relevant direct and indirect relationships between the independent and dependent variables were identified.
Variables
Independent variables: Big data technologies like data source, data analysis, data storage, data security and privacy, real-time processing, and messaging system were considered as the independent variable.
Dependent variables: This is something that depends on certain factors. In our research work, the retail industry is considered the dependent variable.
Data collection
Data collection focuses on primary and secondary data. For the purpose of gathering primary data from the employees and managers working for retail businesses, a survey questionnaire was created to ask about the influence of big data analysis in the retail sector. The questionnaire was divided into several sections, each of which had inquiries to gather data relevant to the factors mentioned. The corporations’ acceptance and application of analysis in decision-making were captured by five questions for each variable, each with a five-point Likert scale. A large number of participants were then contacted through email utilizing personal contacts to distribute the final online survey. People who work in the retail sector, particularly in supermarkets, department stores, and internet shopping, made up the respondents’ profiles.
Design of questionnaire
Through the survey data, the proposed hypothesis was tested. The data for the survey is in the form of a questionnaire. The questionnaire was developed using a Likert scale ranging from “highly satisfied” (1) and “highly dissatisfied” (5). The scale allowed for the employment of a special grading system that made it possible to ask respondents how much they agreed with various statements made about a particular issue. This survey was conducted to investigate the relationships between several independent and dependent variables in relation to the effects of big data on the retail industry.
Sampling technique and sample size
The demographic must be described in a way that makes it apparent who is to include it and who is to be excluded. Convenience sampling, like unrestricted strata sampling, enables a researcher to select subgroups in accordance with their preferences for filling units within a given stratum. The necessary data from employees and managers respondents of selected retail industry were chosen for the study. 400 questionnaires were given out by the researcher to the respondents. In that 311 were completely filled and remaining were unfilled. All statements were addressed to the 311 respondents that made up the final sample.
In this research work, the required information was collected from both male and female respondents. From the analysis, we have found that 59.5% of respondents were male and the remaining 40.5% of respondents were female. Also, nearly 17.7% of respondents answered were aged between 25–30 yr, 17.4% of respondents aged between 31–35 yrs, 30.9% of respondents were aged 36–40 yrs, 11.9% of respondents have aged 40–45 yrs, and 22.2% of respondents were of the aged 45 yrs and more. By analyzing the level of study of the candidates we found that 20.3% of respondents were qualified with a diploma, 29.3% of the respondents were qualified with a bachelor’s degree, 35.7% of respondents were qualified with a master’s degree, and 14.8% of respondents were qualified with others. From analyzing the job experience of candidates, we found that 25.4% of respondents were less than 2 yrs, 17.7% of respondents were 3 to 6 yrs, 30.7% of respondents were 6 to 10 yrs, and 19.9% of respondents were more than 10 yrs. The analysis of the demographic profile of respondents is mentioned in Table 2.
Analysis of demographic profile
Analysis of demographic profile
This study used a survey research approach and was quantitative in design. A quantitative approach was used since it allows for both objective analysis and prediction of the relationship between variables. A survey also makes it possible to collect a significant amount of data from a sizable population in a very effective way. This study will be based on the research questions and hypothesis to examine the impacts of digitalization on auditing.
Tools for data analysis
The main analytical technique in this study is partial least square structural equation modeling (PLS-SEM), which is particularly helpful when the dependent variables in a subsequent dependent relationship become independent. PLS-SEM analysis consists of two model. One is measurement and other is structural model. In measurement model, reliability, validity, and factor analysis were performed and in structural model path analysis, regression, correlation, and F-test (ANOVA) analysis were performed.
Results and discussions
The provided information was looked at through with a series of procedures. Firstly, the accuracy of the survey was examined using the Cronbach alpha criterion. Secondly, exploratory factor evaluation was conducted utilizing SPSS to verify the predicted five dimensions and to verify the convergent validity and discriminant validity. Thirdly, exploratory factor analysis was done with AMOS to confirm the measurement instrument by computing composite reliability, standardized loadings, average variance extraction, and goodness-of-fit indices. Finally, the hypothesized associations between factors were verified by studying the model of structural equations. In particular, the F-value, which is equivalent to the proportion of the correlation and path estimation to its error range, was used to assess the relevance of each unique path.
SEM-analysis
Structural equation modeling (SEM) is frequently used to evaluate the degree to which the data support the researcher’s model. SEM should have as its foundation the research’s validating hypothesis. However, some adjustments might be possible based on actual events. The opinions gathered from managers and employees in the retail industry were analyzed using structural equation modeling.
Measurement model
The measurement model explains how to measure latent variables with actual data. The properties of observed variables are crucial because measurement variables generate fictitious hypothetical concepts. Also reflected are the inherent measurement inaccuracies that in reality fact occur during the calibration process. In measurement model reliability, validity, and factor analysis were performed.
Accuracy and reliability are evaluated using Cronbach’s alpha. It offers a simple method for determining if a value is trustworthy or not. The range of Cronbach’s alpha is 0 to 1. When it is larger than 0.7, Cronbach’s alpha is typically considered acceptable. When the alpha level is high, the test items are significantly related. The reliability value of the all the constructs in this study is greater than 0.7. Hence, it is concluded that all the constructs are reliable, provided are reliable and accurate. Table 3 displays Cronbach’s alpha for the collected samples.
Reliability analysis
Reliability analysis
An object’s strong correlation with other measures assessing significant factors is evidence of an instrument’s convergent validity. Convergent validity describes how closely a measurement resembles other measures that it might theoretically be expected to be connected to. The average variance extracted (AVE) is widely used to assess convergent validity. “The average difference between a building and its measures” is how Average Variance Extracted (AVE) is defined. Table 4 shows the AVE values that were achieved. The AVE threshold value is fixed at 0.5. However, this work’s AVE values were found to be lower.
Analysis of average variance extracted
Discriminant validity analyzes the lack of connection or relationship between a construct’s underlying initiative’s construction as well as other measurements whose underpinning construction is thematically unconnected to it. For this purpose, the HTMT and Fornell-Larcker Criterion (FLC) tests were conducted on the data.
HTMT: The criterion used to determine a construct’s reliability is the heterotrait-monotrait ratio of correlation (HTMT). The HTMT must be less than one for discriminant validity to be considered established. The average HTMT analysis correlations are presented in Table 5.
HTMT analysis
Fornell-Larcker Criteria: The Fornell-Larcker criterion has demonstrated the discriminant validity of ideas. Since each measure’s AVE has a larger square root than its correlation with another measure, each of these measures depends a minimum of possible on those to which it is related. The squared coefficient must be bigger than the AVE for discriminant validity to be satisfied. The criteria and satisfactory notions are shown in Table 6.
FLC analysis
EFA is performed to find the validity of data and constructs. This investigation uses exploratory factor analysis to evaluate the data collection used to find complex connections between elements and groupings that comprise integrated ideas. Due to factor analysis’s exploratory nature, it differentiates neither dependent and independent variables. Similar variables are grouped in factors used to determine underlying variables; thus it only utilizes the matrix of data analysis.
a) Communalities Table 7 displays the relationship between the variable and all other variables indicated by these communalities (i.e., the squared multiple correlations between the factors and all other factors). The commonalities value, which must be more than 0.5 to be taken into consideration for further analysis, indicates the similarities that account for how much of the variance. If not, these variables must be excluded from further factor analysis processes. The extracted factors have adequately accounted for the variables.
Communalities
Extraction Method: Principal Component Analysis.
b) Total variance explained The total variance explained and eigen values are shown in Table 8. Principal component analysis was employed as the factor extraction technique in this study. Seven linear components in the data set are found before extraction. The data set for the eigenvalue greater than 1 has two separate linear components after extraction and rotation. The two components are extracted, and they together account for 55.04% of the variance. It is proposed that at least 50% of the overall variation should be explained by the retained components. The findings indicate that two factors can explain the 55.04% common variance that eight variables shared.
Total variance explained
Extraction Method: Principal Component Analysis.
Then descriptive statistics is performed. The surveys mean, standard deviation, and total number of respondents are listed in Table 9. The mean value indicates the properties of the most common result within the provided dataset. As indicated in Table 4 we found that the maximum value for the retail industry performance is 3.80 and the mean value is 2.4000. Also, the standard deviation value is 0. 56454. The overall mean indicates the effect of big data in retail sectors and also it gives ideas for future marketing plans for retail industry performance.
Analysis of descriptive statistics
In structural model, initially the fitness of the model is performed, then the relationship between dependent and independent factors were found by performing correlation and path analysis. Also, the impact between two factors were found by performing regression analysis and F-test analysis.
Standardized Root Mean Square Residual (SRMR): The difference between actual correlations and the usual indirect correlation matrix is how the SRMR is typically defined. The actual size of the gap between actual and expected correlations is a good measure of the (model) compliance requirement. Even though SRMR is a measure of the overall the level of fit, a score of zero implies a perfect match. There was no SRMR influence because of the model’s complexity. If the result is less than 0.08, the variables are deemed to be well-fit. Standardized Root Mean Square Residual (SRMR) has the beneficial property of being “an accurate fit measure and is determined as an invariable adjustment between experiential correlations and predictable correlations.” Furthermore, 0.08 is the value specified for the SRMR threshold. This study’s baseline model’s SRMR is 0.1077, which is a little bit higher than the minimum threshold. Both the composite and factor models’ SRMR values, which are 0.1035 and 0.0993, are slightly above the cutoff point. The factor model generated a good average fit based on the three models. Therefore, the model is used to determine that it has the perfect fit. The SRMR findings are presented in Table 10.
SRMR analysis
SRMR analysis
The path graph in Table 11 demonstrates how each node (variable) is connected to the others. A component of big data technologies impacts the retail industry. This represented path graph analysis demonstrates the relationships between the variables as indicated.
A path analysis
Table 17 displays the path design matrix of the impact of corporate social responsibility on customer loyalty. According to Table 12, each variable’s value is close to 1. As a result, there are correlations between the variables.
Path design matrix
In path analysis and structural equation modeling, the partial correlation coefficient between the dependent and independent variables, which has been modified for more independent variables, is recognized as a path coefficient. A path coefficient illustrates how one variable, which is supposed to be the cause, directly affects another variable, which is considered to be the result. The insignificant effect of one variable, which is assumed to be a source, on another, which is assumed to be a consequence, is expressed by a path coefficient. Similarly, Table 13 highlights the effect of big data technologies in the retail industry.
Analysis of path coefficients
Table 14 depicts the inter-constructive correlations between big data and retail industry performance. The Inter construct correlation matrix can be used to determine that the bolded values along the diagonal line indicate the overall degree of connection between the variables that were detected.
Inter-construct coefficient
Table 15 indicates the regression model’s coefficient of determination (
Analysis of model summary
Predictors: (Constant), message system, data analysis, data storage, data source, real-time processing, data security.
From Table 16, the ANOVA reveals whether a statistically significant percentage of the variance is explained by the regression model. It particularly utilizes a ratio to evaluate how accurately the outcome is predicted by the linear regression model to how well it is predicted by only taking the mean of the outcome data as an estimate. Therefore, the model is more reliable in predicting the outcome. The result of the model is statistically significant.
Analysis of ANOVA
Dependent Variable: retail performance
Predictors: (Constant), message system, data analysis, data storage, data source, real-time processing, data security
The values for the regression line are provided in the Coefficients table. The column labeled B in the (Constant) row gives us the intercept; this is where
Analysis of coefficients
Dependent Variable: retail performance
The Pearson correlation evaluates how strongly two variables are correlated linearly. The correlation coefficient has a possible range of values between −1 and 1, where 0 indicates a no correlation, 1 indicates a total positive correlation, and −1 indicates a total negative correlation. A correlation value of 1 indicates that a variable is always associated with itself. Table 18 displays correlation analysis with collected samples.
Analysis of correlation
Analysis of variance (ANOVA) uses F-tests, which is a statistical method used for comparing the mean values of two or more distinct groups and highlighting their significant differences. By comparing the averages from various samples, an F-test analyses the type of effects that exist when two or more factors are included. Thus, the fundamental goal of an F-test is to systematically look for differences both inside and between the compared groups. When comparing the means of independent variables, an F-test is also used to determine whether the groups differ significantly from one another. The aim of an F-test consequently is to assess whether the group means are equal.
Table 19 indicates the outcome of the F-test analysis, the total of square between the variables data source in the retail industry is 14.005, and the calculated residual error (Error) is 94.261. The F ratio and degree of freedom (df) are taken into account by the f-test as
The total of squares between the variables data analysis tool in the retail industry is 10.941, and the calculated residual error (Error) is 63.149. The F ratio and degree of freedom (df) are taken into account by the f-test as
The total of squares between the variables data security and privacy in the retail industry is 19.098, and the calculated residual error (Error) is 114.098. The F ratio and degree of freedom (df) are taken into account by the f-test as
The total of squares between the variables data storage in the retail industry is 19.098 and the calculated residual error (Error) is 114.098. The F ratio and degree of freedom (df) are taken into account by the f-test as
Analysis of the F-test
The total of squares between the variables of real-time processing in the retail industry is 19.881, and the calculated residual error (Error) is 67.098. The F ratio and degree of freedom (df) are taken into account by the f-test as
The total of square between the variables of the message system in the retail industry is 7.300, and the calculated residual error (Error) is 84.466. The F ratio and degree of freedom (df) are taken into account by the f-test as
Big Data analysis has received praise as a technology that has the potential to change the retail sector [7]. Data analysis technology has a lot of benefits, and an increasing number of businesses are using Big Data to adopt data analysis in order to get insights into and boost their income [40]. Numerous enterprises and the operational difficulties they encounter while adopting and using data analysis in the retail sector have been studied. Despite these difficulties, data analysis has emerged as a key tactic for businesses to obtain a competitive edge and speed up growth [23]. According to Lutfi et al., [18], data analysis is a crucial component of business, showing the consumer information that has to be analyzed and the advantages that retail firms may reap. This study focuses on the factors like data source, data analysis, data storage, data security and privacy, real-time processing, and messaging system in the retail industry, which was the main subject of this study. This composition is divided into two parts. In the first step, the process of acquiring data gets started. The main way of data collection in this work is by distribution of the questionnaire to the managers and employees of the retail industry in India and getting their opinion. The design of the questionnaire takes the proposed hypothesis into account. The gathered data were subjected to PLS-SEM approach. The data analysis, real-time processing,and messaging system tools still have a beneficial influence on data analysis in the retail sector, even if they are not the main factors driving organizations to use data analysis. The findings of the study reveal that data analysis (
In contrast, future research can be conducted to estimate and test additional variables that were not included in the variables analyzed to explore the effects of big data in the retail industry. Since not all estimated variables were statistically significant. Therefore, big data analysis has earned recognition as a tool that has the potential to change the retail sector. Data analysis technology has a lot of benefits, and an increasing number of businesses are using Big Data to adopt data analysis to gain insights into and boost their income. Numerous enterprises and the operational difficulties they encounter when adopting and using data analysis in the retail sector have been studied. Despite these difficulties, data analysis has emerged as a key strategy for businesses to obtain a competitive edge and speed up growth. Based on this investigation, there has been a notable shift in the variables that have been associated with big data analysis in the retail sector.
Managerial implications
This survey demonstrates the crucial functions of big data in the retail industry. Big data are cutting-edge technology that assists in demand forecasting, performance and pricing forecasting, and optimization. This tool also aids in trend forecasting and client segmentation. As a result, businesses in the retail industry can give reasonable discounts, set fair prices, and lower the turnover rate. Additionally, it helps in boosting sales of products, improve marketing, optimize customer experiences, and forecast client traffic. As a result, the study found that big data are very helpful for organizations because they lower costs and boost sales. It was also revealed that the use of big data does not ensure the company would make a lot of money. It’s because the company can run into problems with financial limitations, technology compliance, and employee capacity to offer clients enhanced services. The study looks at how big data and business analytics may be used to improve customer engagement and interactions with retailers. It helps in bridging the divide and developing a strong relationship with clients. It offers a deeper knowledge of information transformation, raising the value of goods, and improving client services. In order to succeed, businesses of all sizes must make sure they are competitive. As internet businesses engage with their customers in real time, the rivalry heats up. Big Data analysis may benefit merchants in the following ways.
Data analysis may assist a business in enhancing customer service to draw in new clients and keep hold of existing ones. Data analysis, for instance, might give context to a customer complaint made online or through social media, enabling customer care to address it and offer a better service. This will lead to good customer service, quicker issue resolution, and a feeling of importance and privilege for the consumer. The same merchant is used by customers to make purchases in a variety of methods, such as online, through mobile applications, etc. Companies may provide clients a customized experience when data are gathered in real time for analysis from various sources. For instance, data analysis aids in consumer segmentation, identifying both new and loyal clients. This enables businesses to reward devoted clients while simultaneously appealing to and luring in new ones.
Limitations and future recommendations
This analysis has a limitation in that there is not enough information to establish how big data analysis improves the performance of the retail industry. The research was conducted with very small sample size and for a relatively short period. This research includes a few limitations, just like all other research. Considering the quality of data analysis presently used in the retail sector, the variables are taken into consideration in this study. Other crucial factors, such as geographic location and socioeconomic data, could be included in future studies to investigate social repercussions. As a result, data analysis in the retail sector will be seen from a more social and global viewpoint. Comparing the effects of big data analysis on the retail industry globally and in retail organizations of all sizes will be made easier with the addition of businesses and respondents from other geographies and small-medium sized enterprises. Unfortunately, we were unable to identify enough research on this topic.
Another suggestion would be to carry out further study on the variables that affect the retail industry’s decision regarding data analysis technologies (such as revenue, both micro and macro variables impacting the effectiveness of the analysis of data, etc.) in light of the rising use of Big Data. The company’s performance should be investigated and analyzed with regard to of the operational and financial advantages that can be realized through data analysis.