
Abstract
BACKGROUND:
Coronary artery disease (CAD) manifests with a blockage the coronary arteries, usually due to plaque buildup, and has a serious impact on the human life. Atherosclerotic plaques, including fibrous plaques, lipid plaques, and calcified plaques can lead to occurrence of CAD. Optical coherence tomography (OCT) is employed in the clinical practice as it clearly provides a detailed display of the lesion plaques, thereby assessing the patient’s condition. Analyzing the OCT images manually is a very tedious and time-consuming task for the clinicians. Therefore, automatic segmentation of the coronary OCT images is necessary.
OBJECTIVE:
In view of the good utility of Unet network in the segmentation of medical images, the present study proposed the development of a Unet network based on Sk-Conv and spatial pyramid pooling modules to segment the coronary OCT images.
METHODS:
In order to extract multi-scale features, these two modules were added at the bottom of UNet. Meanwhile, ablation experiments are designed to verify each module is effective.
RESULTS:
After testing, our model achieves 0.8935 on f1 score and 0.7497 on mIOU. Compared to the current advanced models, our model performs better.
CONCLUSION:
Our model achieves good results on OCT sequences.
Keywords
Introduction
The use of optical coherence tomography (OCT) in coronary atherosclerosis can clearly show the site and level of the lesion to the clinicians. It takes a long time for professional doctors to analyze OCT images manually. Therefore, the automatic segmentation of coronary OCT images is necessary.
In fact, many patch segmentation methods have been proposed. Based on the Haralick texture signature and K-means clustering, Prakash [1] introduced a new patch segmentation method. In the study by Celi et al. [2], a novel method was employed that introduced the best global threshold of OSTU and morphological processing. Xu [3] proposed an OCT image system that adopted the support vector machine (SVM) for automatic detection of atherosclerotic diseases. For achieving semi-automatic segmentation on OCT images, Huang et al. [4] adopted a method on the basis of image feature extraction and SVM. This method achieved a precision of 89% in the detection of fibrous plaques, 79.3% for calcified plaques, and 86.5% for lipid plaques. Ughi [5] and Athanasiou applied the machine learning in the form of random forest and K-means clustering model to detect the calcified plaques on coronary OCT. In an approach employing deep learning, Gessert [7] developed a method with deep learning models to discover and classify the calcifications and plaques between fibers/lipids. Li employed a fully automatic method on the basis of convolutional neural network for segmentation of calcified plaques [8], and the F1 score for pixel-level calcification classification reached 0.883
Due to the good segmentation performance of UNet [9] on medical images, many related models have been proposed. The Att-UNet model [10] proposed a medical attention gate model that paid attention to the important local features from encoders. UNet
Inspired by the attention mechanism and the work of Cao at al., our study proposed two improved methods based on UNet. First, a four-branch Sk-Conv module [15] was added to the last layer of the encoder to synthesize messages from multiple convolution kernels. In addition, we introduced a spatial pyramid pooling (spp) module [16] to the original UNet network to get multi-scale features.
Dataset and methodology
Dataset and preprocessing
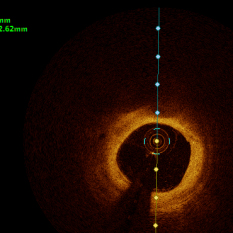
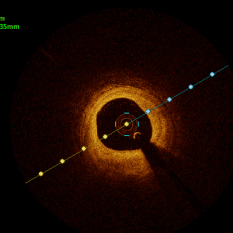
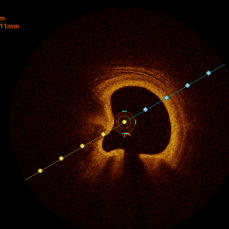
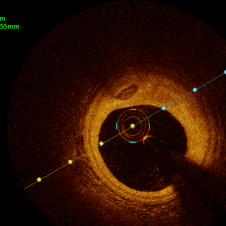
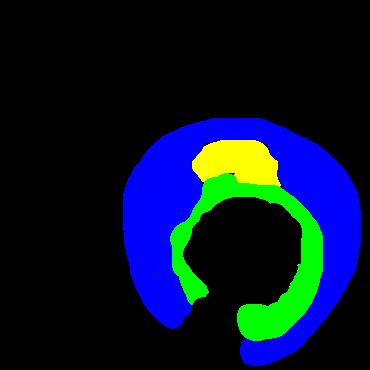
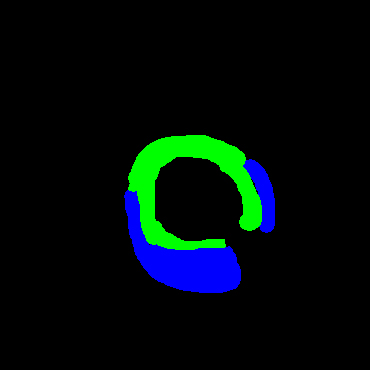
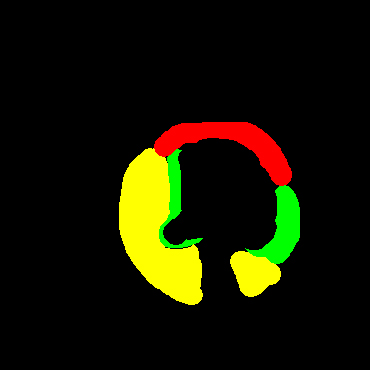
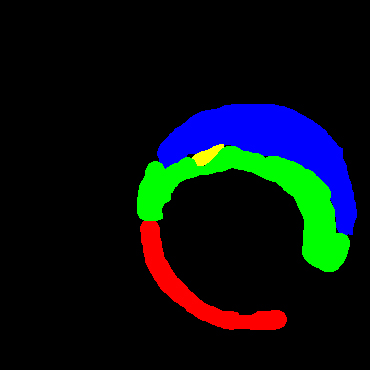
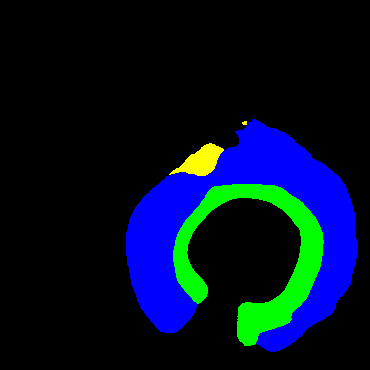
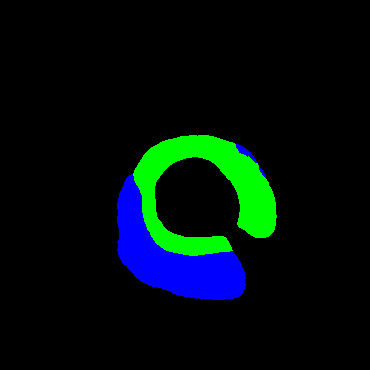
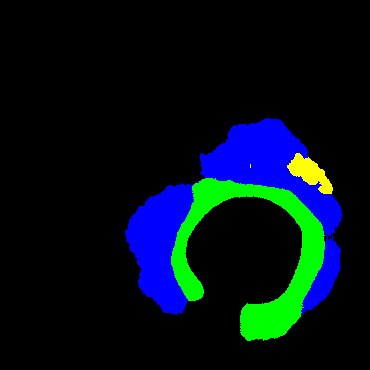
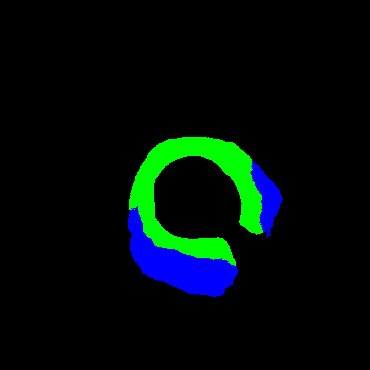
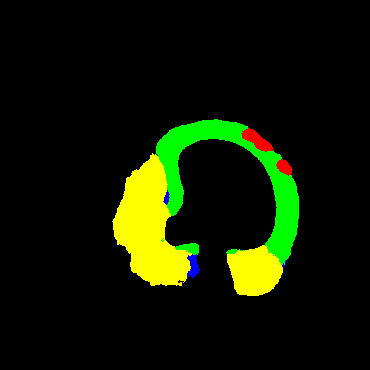
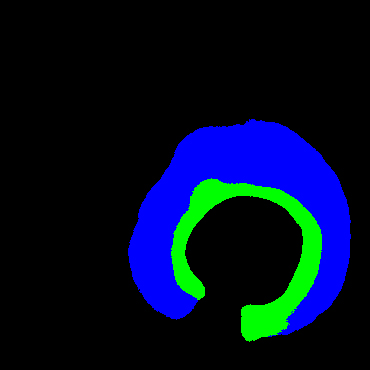
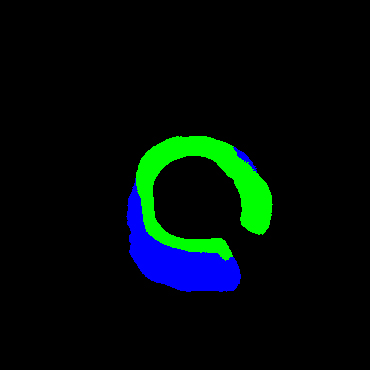
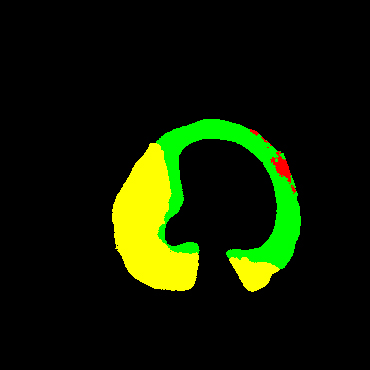
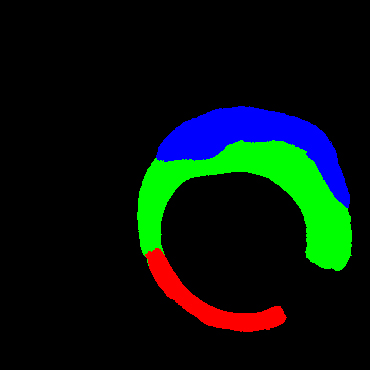
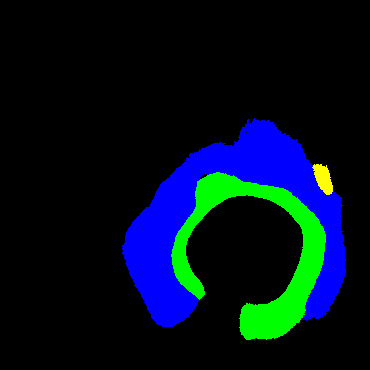
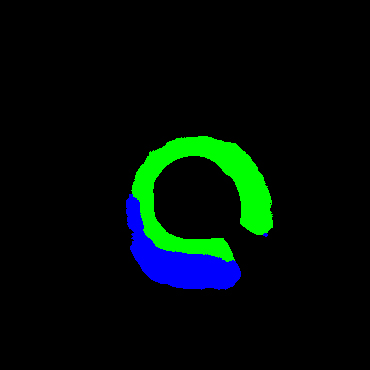
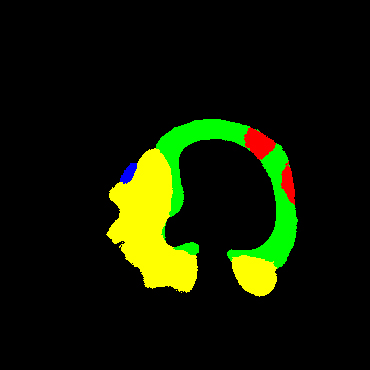
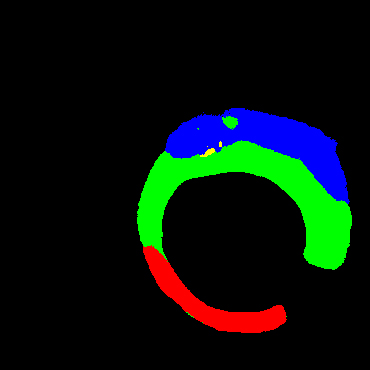
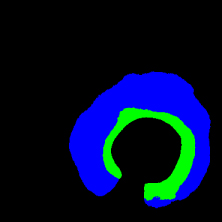
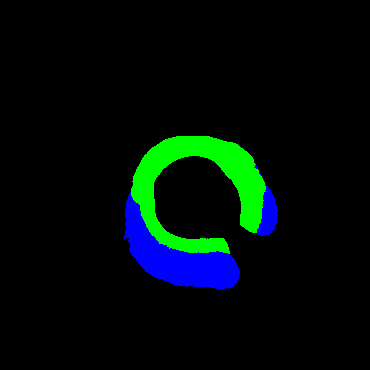
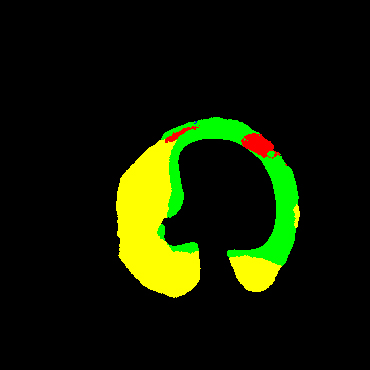
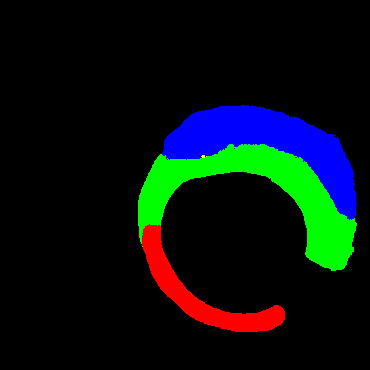
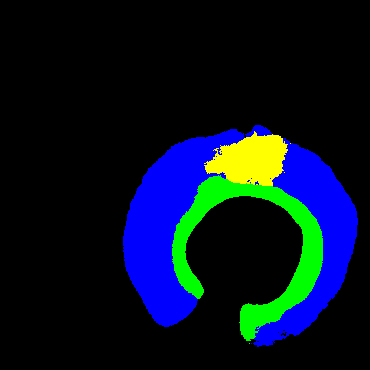
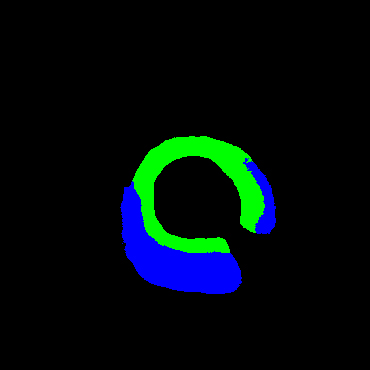
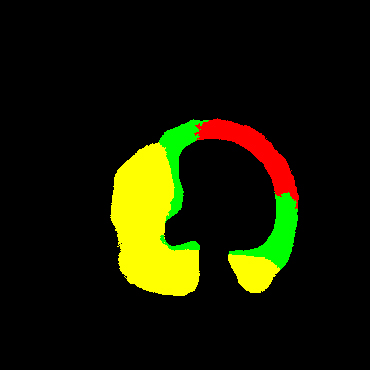
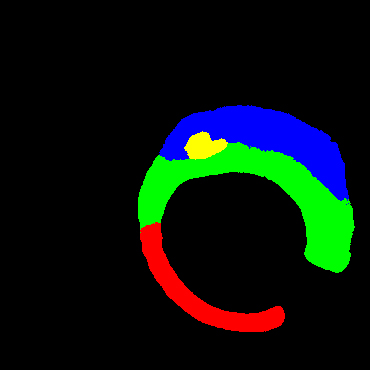
In the present study, raw OCT images of the culprit vessels of each patient were acquired through the ILUMIEN OPTIS system built into the OCT Mobile Dragonfly. A total of 5624 frames of OCT original images of the culprit blood vessels of 15 patients were simultaneously annotated by 2 observers through ITK-Snap software, and the normal tissues and fibers in each frame of OCT original images of the culprit vessels of the patients were marked with four different colors. Plaques, lipid plaques, and calcified plaques (Fig. 1), and were reviewed by a clinical expert for training and testing of deep learning models.
a) Four cropped OCT images with the size of 370 * 370; b) Corresponding ground truth labels: red – normal, green – fibrosis, blue – lipid, yellow – calcification and black – background (bg).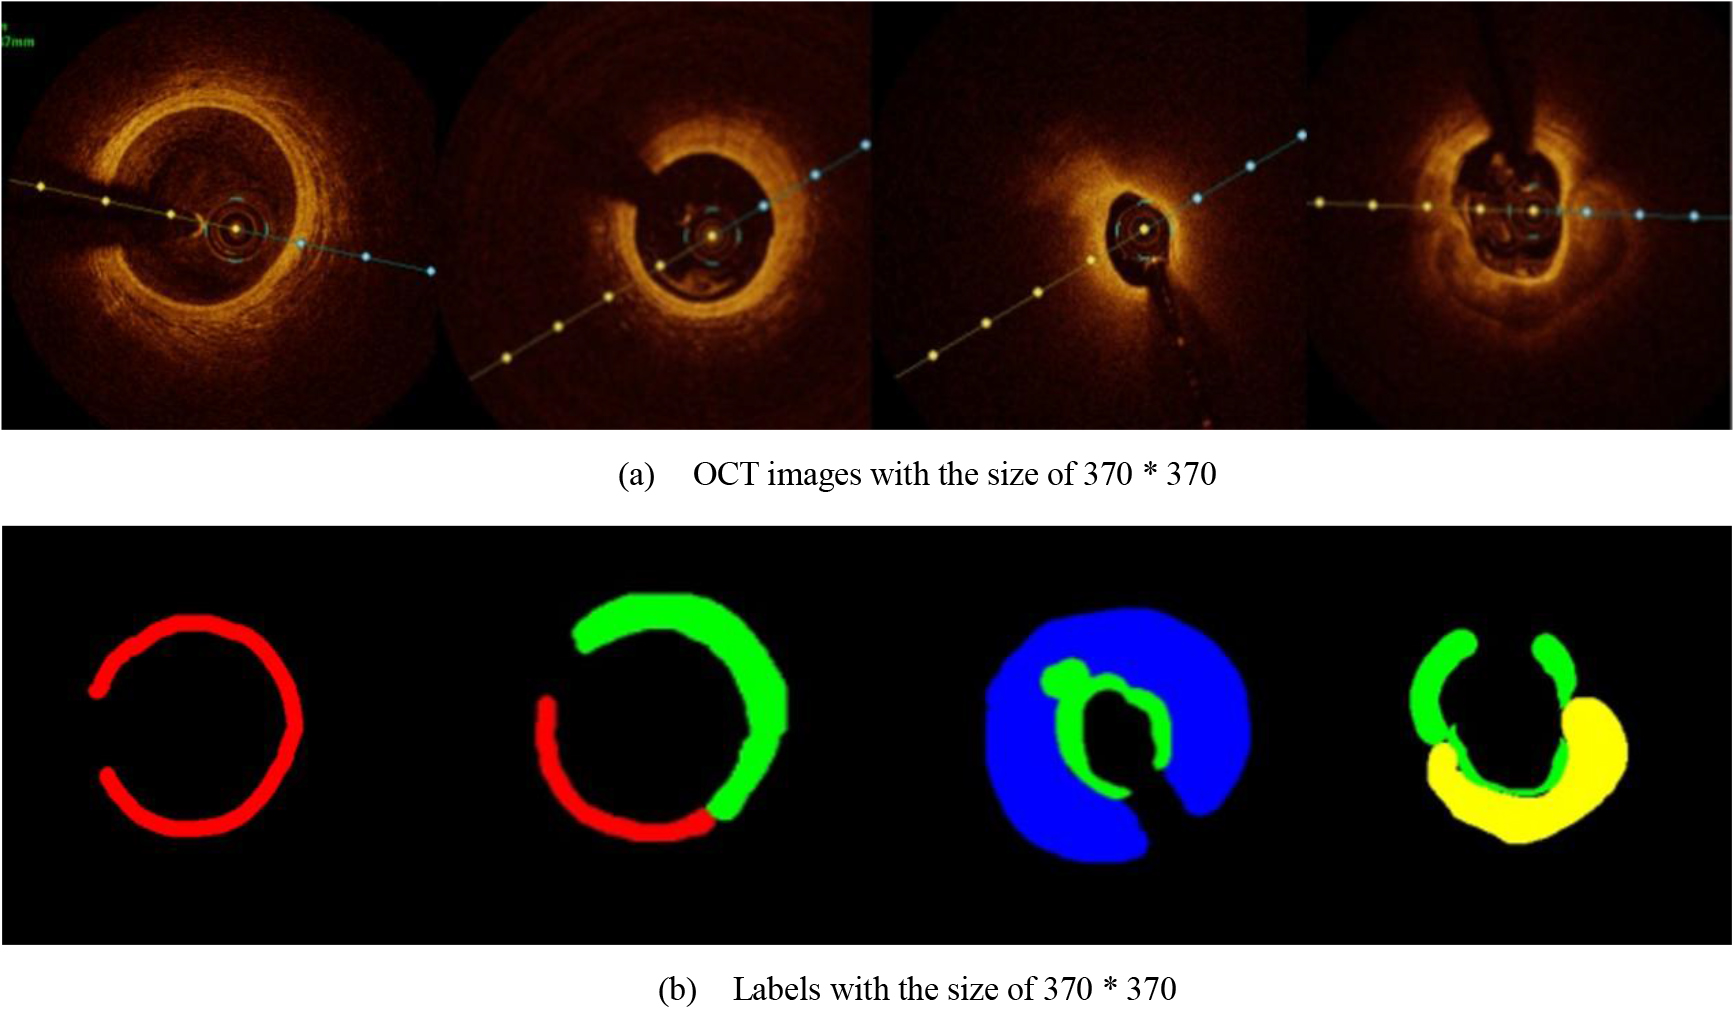
Since the original image or label with the size of 736 * 736 was too large and consisted too much information, which was unnecessary for segmentation, the adjustment of the image size was necessary. After many prior experiments, the original image was resized to 370 * 370 size for more accurate prediction. Among the 5624 images provided, we selected 1500 images to test and the others were augmented to train 49488 images. Enhancements include 90
We employed the Sk-Conv module to obtain more information of the different receptive fields on the basis of UNet by dynamically selecting the size of convolution kernels. Meanwhile, we introduced the SPP module to obtain multi-scale feature information of the images. The architecture of the method adopted in the study is shown in Fig. 2.
Network architecture of the present study; green arrow indicates the spp module and purple arrow shows the Sk-Conv module.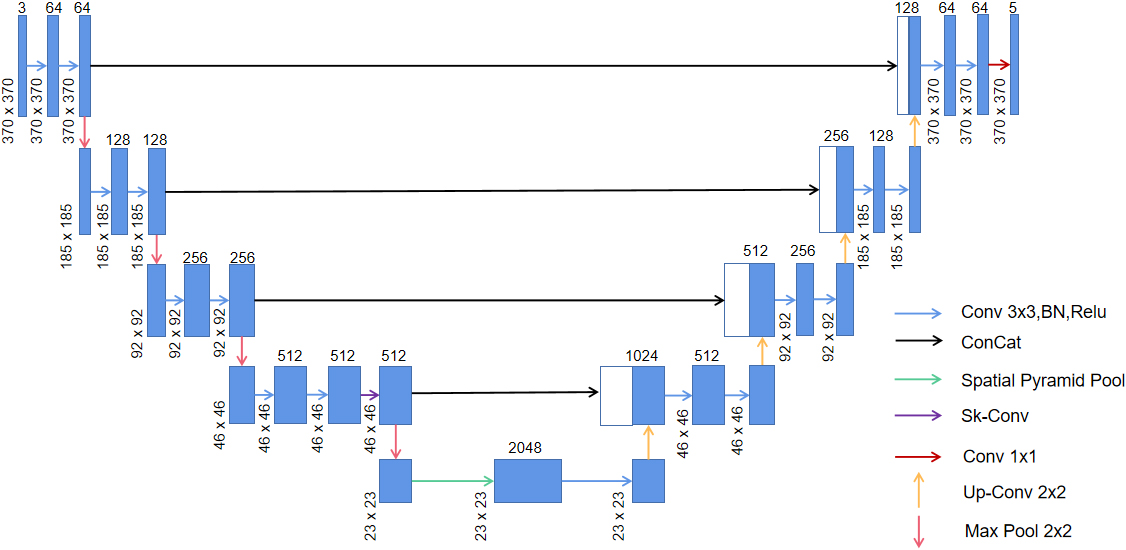
Proposed SPP model: The max-pooling of three scales, convolution with the size of 3 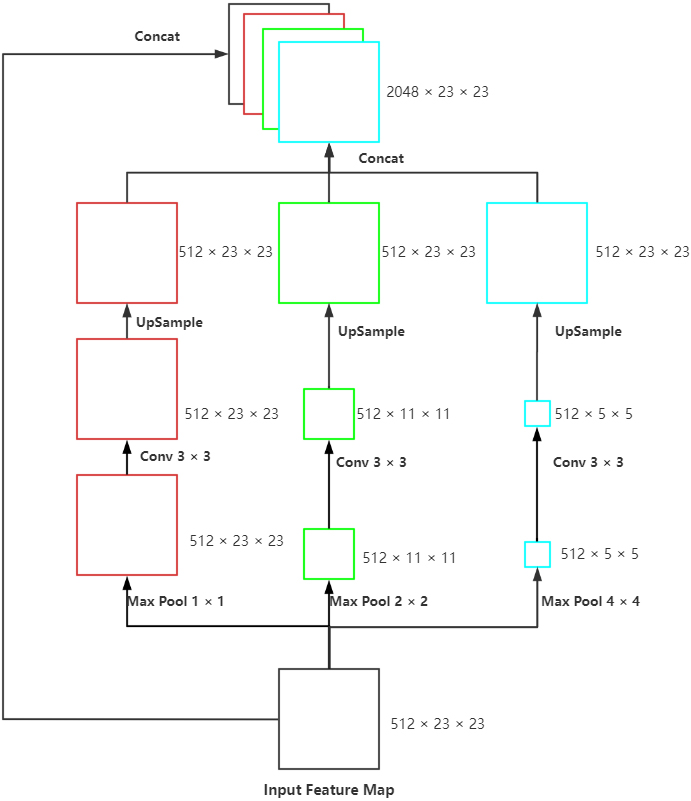
For achieving the multi-scale extraction of advanced features of the encoder, the module called SPP (Fig. 3) was applied at the last layer of UNet to perform pooling of three scales on the input feature map. Subsequently, we performed convolution to extract the features with different scales, upsample to the size of the input and concatenated with the original feature map. This module enhanced the robustness of this network to differentiate the spatial layout and resolution.
Since the receptive field of a fixed-size convolution kernel is fixed, we introduced the Sk-Conv (Fig. 4) to generate the information of convolution kernels with different sizes. As a result, the method could resize the receptive field adaptively, presented the importance of different convolution kernels, and raised the generalization ability of the net.
SK-Conv module employed in our model.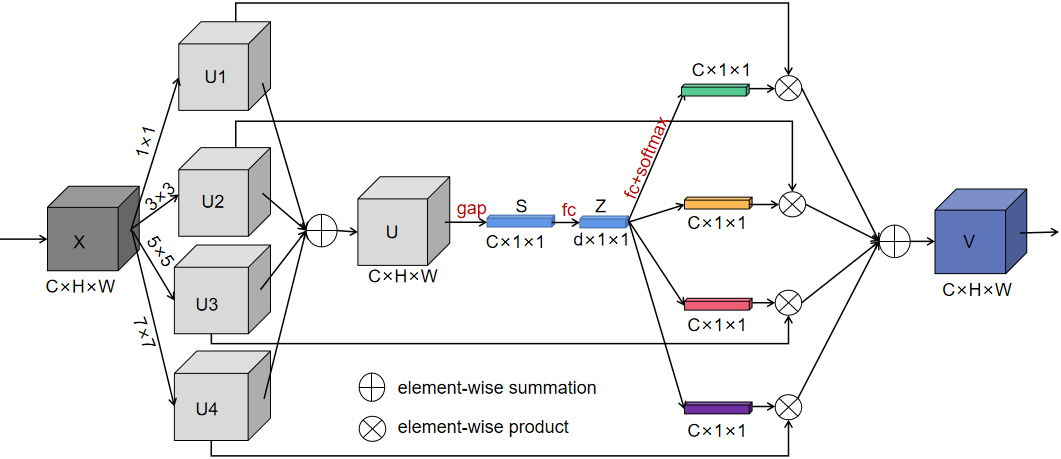
In Fig. 4, SK-Net introduced a branch attention mechanism while paying attention to the channel attention, which could resize the receptive field adaptively and exhibited a better performance. The core in Sk-Net is the SK-Conv module, which contained three parts. In the first stage of the SK-Conv module which was called split in our network, convolution kernels with sizes of 1, 3, 5, and 7 were set up to perform convolution on the feature map X to obtain U1, U2, U3, and U4. In the second stage named fuse, the four outputs were added element-wise to generate U; subsequently the global information S was obtained through global average pooling (GAP), and then the full connect layer (FC) was performed on S to find each channel. Then Z was restored to the size of S through a full connect layer again. In the last stage called select, softmax was used to obtain the weight matrices of kernels of different sizes and weighted operations with U1, U2, U3, and U4 respectively, and finally the feature map V containing the attention of 4 branches was obtained.
We used the stochastic gradient descend with a momentum of 0.9 during the model training. In the Sk-Conv module, there are three important hyper-parameters: M determines the number of kernels to be chosen, the group number G that shows the cardinality of each branch, and r indicates the number of output channels of the first fully connected layer in the fuse stage. We set G
Inspired by Cao’s study [14], category imbalance is very common for medical image segmentation, so we needed to specifically calculate the number of pixels of each target. Based on our statistics, the number of pixels of these five types of targets was 6244003560 (background), 36524472 (normal tissue), 222035352 (fibrous plaque), 158842704 (lipid plaque) and 113501112 (calcified plaque). Obviously, there was a big difference in the number of background pixels and other pixels. Therefore, we chose the Focal Loss as the focal loss and set
In addition, all the programs were implemented by Pytorch 1.10.1 toolkit and run on Red Hat 4.8.5 system with three NVIDIA Tesla P100 GPUs and an Inter(R) Xeon(R) Gold 5118 CPU @ 2.30GHz.
Ablation study
Ablation study
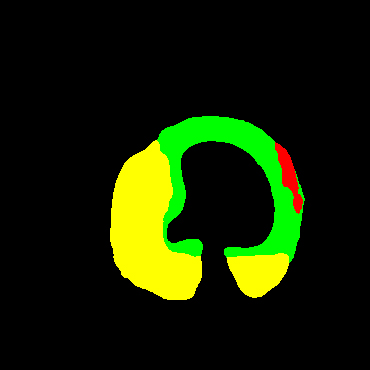
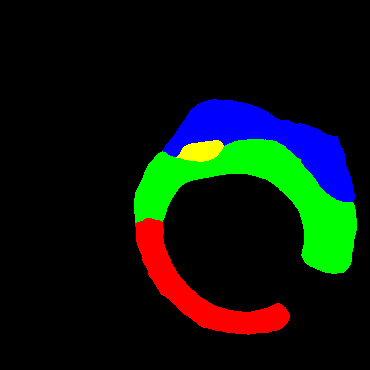
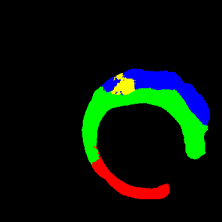
Comparison among different models on four cases
Footnotes
Acknowledgments
None to report.
Conflict of interest
None to report.