At present, robust quality criteria and methods for the assessment of Peak inspiratory flow meter performance are lacking.
OBJECTIVE:
A standard flow-volume simulator for quality control analyses of an inhalation assessment device was utilized with different simulated resistance levels in order to propose a quality testing method and associated standard for this device type.
METHODS:
A standard flow-volume simulator was utilized to assess the performance of an In-Check DIAL (Device I) and an intelligent inhalation assessment device (Device P) at a fixed volume and flow rate. Indices used to evaluate these two instruments included repeatability, accuracy, linearity, and impedance.
RESULTS:
Both devices exhibited good repeatability ( 3 L/min). The difference between test results and standard simulator values for Device P was less than 5 L/min at resistance level R1 but higher than 5 L/min at resistance levels R2–5, while Device I were greater than 5 L/min at all resistance levels. The relative error for Device P was 10% at resistance levels R1, R2, and R4, but 10% at resistance levels R3 and R5. The relative error values for Device I at all five resistance levels were 10%. Device P passed the linearity test at the R2 resistance level, while Device I partially passed the linearity test at all five resistance levels.
CONCLUSION:
Standard monitoring methods and standards provide a valuable approach to the more reliable clinical assessment and application of these instruments.
Chronic airway diseases affect a large segment of the population and can impose a heavy burden of disease, thus posing a major threat to global public health [1, 2]. The treatment of these diseases centers around inhalation therapy approaches in which specific medicines are delivered to the lungs through inhaler devices, including pressurized metered dose inhalers (pMDIs), soft mist inhalers (SMIs), and dry powder inhalation devices (DPIs).
DPI resistance can be separated into five levels (R1–R5, from low to high) based on the amount of inhalation flow necessary to produce a pressure drop of 4 kPa [3, 4, 5, 6]. This value was selected for use when conducting the in vitro characterization of a drug dose delivered by a DPI. When using a DPI, patients must inhale forcefully to facilitate optimal inspiratory flow and drug release [7]. If this flow rate is too low or too high, however, it will result in suboptimal pulmonary drug deposition [8, 9, 10]. Owing to airflow limitations or impaired respiratory muscle strength, individuals suffering from chronic airway diseases often face difficulties reaching this minimum flow rate [11, 12, 13]. As such, peak inspiratory flow (PIF) is an important metric that can influence the therapeutic effects of inspiration in patients undergoing inhalation therapy [14, 15].
Measuring PIF under additional resistance can provide insight into the ability of patients to use DPIs [16], while also guiding inhalation device selection and inhaler technique training [17, 18]. The number of instruments capable of measuring PIF under different levels of resistance is gradually rising. The In-Check DIAL is a mechanical PIF meter with additional resistance. Resistance levels are divided into the R1–R5 resistance gears, which can be switched with a resistance turntable [5]. This device has been used in several studies to measure PIF values in patients, recording either the average or the highest value from three tests [19, 20, 21]. The accuracy of this instrument has not been heavily scrutinized, and Barnes et al. [22] first proposed repeatability standards for In-Check DIAL measurement results to ensure instrument stability. Owing to growing clinical need, intelligent inhalation assessment devices continue to be developed, highlighting a need to define approaches to evaluating the performance of these instruments.
Standard flow-volume simulations or similar standardized instruments need to be used to test the performance of spirometers and other devices that measure flow rates in clinical practice to ensure that only devices meeting defined technical and quality standards are used by patients. These devices must also undergo regular testing to ensure stability and accuracy [23]. Based on the current quality testing scheme without an inhalation assessment device, the present study was conducted using a standard flow-volume simulator for quality control analyses of an inhalation assessment device with different simulated resistance levels in order to propose a quality testing method and associated standard for this device type.
Materials and methods
Materials
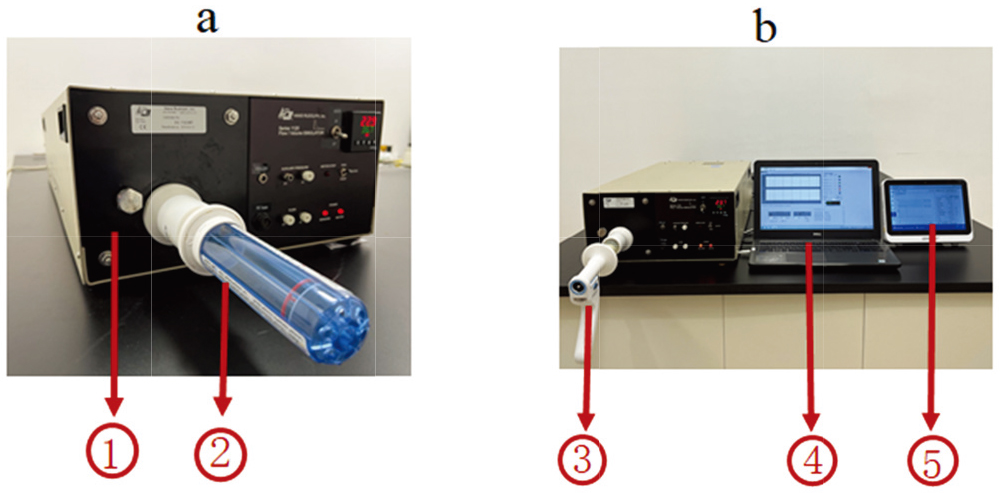
A standard flow-volume simulator (Model 1120, Hans Rudolph, USA) and a computer terminal were used for measurement. Devices that underwent measurement included an inhaler training device (G16, In-Check DIAL Clement Clarke, Essex, UK) (Device I) and an intelligent inhalation assessment device (PF810, UBREATH, e-LinkCare, Zhejiang China) (Device P).
Methods
Prior to testing, the devices should be kept at room temperature of 1525C normal pressure and relative humidity the simulator and devices undergoing measurement were started and allowed to preheat for 15 min (starting the devices to achieve stable performance) after which all equipment was placed in the above environment for at least 30 min. The measurement device was then connected to the interface of the standard flow-volume simulator, with the connection being air-tight (Fig. 1). The inhalation volume was set to 3.0 L using the computer, and the inhalation flow rate was set from 0–120 L/min at 15 L/min intervals (15, 30, 45, 60, 75, 90, 105, 120 L/min). After the parameters had been set, the inhalation flow rate was tested 5 times under identical conditions and the average value was recorded. The air source value generated by the simulator was used as the standard value.
Test equipment operational diagram. Note: ⟀ Standard flow-volume simulator, ⟁ In-Check DIAL (Device I), ⟂ intelligent inhalation assessment device (Device P), ⟃ computer, and ⟄ computer control terminal for Device P.
Evaluation parameters
The absolute error was measured with the following formula: , where is the value of average measurement of PIF, is the baseline traffic of . Relative error was measured with the following formula: . Absolute and relative errors can be used to evaluate the accuracy of instrumental measurements. Repeatability was defined as the difference between the maximum and minimum values across five measurements, which was the stability reflection of instrument measurement results: . Impedance was measured with the following formula: , where is the peak pressure for reference flow , is the baseline traffic of . Linearity was measured with the formula , where is the PIF error for peak flow ; denotes that the peak flow is the error of the PIF of the above increment; and denotes the baseline flow , which is the average PIF value from five measurements for the baseline of one or more increments.
Target criteria for result interpretation included repeatability 3 L/min (0.05 L/s), accuracy: absolute error 5 L/min (0.0833 L/s) or relative error 10%, and linearity 5% [24].
Data analysis
Microsoft Excel 2016, Prism 9.0 (GraphPad Software) and SPSS statistical software package version 25.0 (SPSS Inc., USA) were used to analyze data. Bland-Altman analyses were used to assess consistency between results for the measured devices and standard simulator values under the same instrument settings. Paired -tests were used to compare impedance values for the two measured devices. 0.05 was the threshold of significance.
Results
When assessing repeatability, both Device I and Device P yielded test results that were below 3 L/min, consistent with the criterion for good repeatability.
The difference between test results and standard simulator values for Device P was 5 L/min at resistance level R1 but 5 L/min at resistance levels R2-5, whereas differences between test results and standard simulator values for Device I were greater than 5 L/min at all resistance levels. The relative error for Device P was 10% at resistance levels R1, R2, and R4, but 10% at resistance levels R3 and R5. The relative error values of Device P for velocity measurements below 1.25 L/s were all 10%. The relative error values for Device I at all five resistance levels were 10%.
Device P passed the linearity test at the R2 resistance level and partially passed the test at the R1 and R3–R5 resistance levels, while Device I partially passed the linearity test at all five resistance levels. Repeatability, absolute error, relative error, and linearity results are summarized in Tables 1 and 2.
Measurement results for Device P under different testing parameters
Parameters
F0.250
F0.500
F0.750
F1.00
F1.250
F1.500
F1.750
F2.000
Through (Y/N)
Resistance I
Mean of simulator’s PIF (L/s)
0.250
0.500
0.750
1.000
1.250
1.500
1.750
1.999
Mean of Device P’s PIF (L/s)
0.267
0.485
0.719
0.970
1.220
1.396
1.662
1.892
Repeatability of Device P (L/s)
0.000
0.000
0.000
0.000
0.000
0.000
0.017
0.017
Y
Absolute error of Device P (L/s)
0.017
0.015
0.031
0.030
0.030
0.104
0.089
0.107
Y
Relative error of Device P (%)
6.988
3.042
4.157
3.042
2.374
6.946
5.070
5.354
Y
Linearity of Device P (%)
0.466
2.221
0.078
0.062
5.338
0.929
0.967
/
N
Resistance II
Mean of simulator’s PIF (L/s)
0.250
0.500
0.750
1.000
1.250
1.500
1.746
1.954
Mean of Device P’s PIF (L/s)
0.249
0.482
0.715
0.954
1.196
1.394
1.612
1.828
Repeatability of Device P (L/s)
0.000
0.000
0.000
0.017
0.000
0.017
0.000
0.000
Y
Absolute error of Device P (L/s)
0.001
0.018
0.035
0.046
0.054
0.106
0.134
0.126
N
Relative error of Device P (%)
0.300
3.623
4.731
4.620
4.288
7.068
7.685
6.447
Y
Linearity of Device P (%)
3.604
2.431
1.124
0.618
3.761
1.747
0.450
/
Y
Resistance III
Mean of simulator’s PIF (L/s)
0.250
0.500
0.750
1.000
1.250
1.497
1.744
1.947
Mean of Device P’s PIF (L/s)
0.267
0.485
0.715
0.953
1.187
1.313
1.585
1.789
Repeatability of Device P (L/s)
0.000
0.000
0.017
0.000
0.000
0.000
0.017
0.000
Y
Absolute error of Device P (L/s)
0.017
0.015
0.035
0.047
0.063
0.184
0.159
0.158
N
Relative error of Device P (%)
6.988
3.042
4.603
4.714
5.018
12.321
9.110
8.121
N
Linearity of Device P (%)
0.466
2.699
1.325
1.311
9.276
1.617
0.042
/
N
Resistance IV
Mean of simulator’s PIF (L/s)
0.250
0.500
0.750
1.000
1.249
1.488
1.710
1.928
Mean of Device P’s PIF (L/s)
0.251
0.475
0.719
0.953
1.157
1.296
1.555
1.772
Repeatability of Device P (L/s)
0.000
0.017
0.000
0.000
0.017
0.000
0.000
0.000
Y
Absolute error of Device P (L/s)
0.001
0.025
0.031
0.047
0.093
0.191
0.155
0.156
N
Relative error of Device P (%)
0.301
5.048
4.157
4.714
7.411
12.872
9.063
8.083
Y
Linearity of Device P (%)
4.800
0.826
1.675
3.929
7.630
2.351
0.050
/
N
Resistance V
Mean of simulator’s PIF (L/s)
0.250
0.500
0.750
0.999
1.221
1.467
1.680
1.987
Mean of Device P’s PIF (L/s)
0.234
0.468
0.702
0.936
1.103
1.183
1.381
1.454
Repeatability of Device P (L/s)
0.000
0.000
0.000
0.000
0.000
0.017
0.050
0.000
Y
Absolute error of Device P (L/s)
0.016
0.032
0.048
0.063
0.118
0.284
0.299
0.533
N
Relative error of Device P (%)
6.386
6.386
6.411
6.292
9.668
19.351
17.789
26.821
N
Linearity of Device P (%)
3.411
2.302
1.577
5.006
14.013
1.080
16.106
/
N
Measurement results for Device I under different testing parameters
Parameters
F0.250
F0.500
F0.750
F1.00
F1.250
F1.500
F1.750
F2.000
Through (Y/N)
Resistance I
Mean of Device I’s PIF (L/s)
0.250
0.433
0.590
0.833
1.017
1.297
1.497
1.657
Repeatability of Device I (L/s)
0.000
0.033
0.017
0.000
0.017
0.017
0.017
0.017
Y
Absolute error of Device I (L/s)
0.000
0.067
0.160
0.167
0.233
0.203
0.254
0.343
N
Relative error of Device I (%)
0.000
13.333
21.333
16.667
18.667
13.556
14.496
17.142
N
Linearity of Device I (%)
15.385
15.819
0.800
6.557
2.314
3.367
5.372
/
N
Resistance II
Mean of Device I’s PIF (L/s)
0.233
0.413
0.573
0.803
0.990
1.180
1.383
1.550
Repeatability of Device I (L/s)
0.000
0.017
0.017
0.017
0.033
0.017
0.033
0.033
Y
Absolute error of Device I (L/s)
0.017
0.087
0.177
0.197
0.260
0.320
0.363
0.404
N
Relative error of Device I (%)
6.667
17.333
23.556
19.667
20.800
21.344
20.771
20.667
N
Linearity of Device I (%)
16.935
15.698
2.490
6.397
5.102
3.070
2.654
/
N
Resistance III
Mean of Device I’s PIF (L/s)
0.227
0.397
0.590
0.783
0.987
1.147
1.370
1.483
Repeatability of Device I (L/s)
0.017
0.000
0.033
0.033
0.033
0.017
0.017
0.033
Y
Absolute error of Device I (L/s)
0.023
0.103
0.160
0.217
0.263
0.351
0.374
0.463
N
Relative error of Device I
9.333
20.667
21.333
21.667
21.041
23.413
21.427
23.807
N
Linearity of Device I
20.168
9.605
7.234
4.689
7.640
1.684
6.058
/
N
Resistance IV
Mean of Device I’s PIF (L/s)
0.233
0.390
0.617
0.753
1.027
1.130
1.370
1.410
Repeatability of Device I (L/s)
0.000
0.017
0.000
0.033
0.017
0.033
0.017
0.017
Y
Absolute error of Device I (L/s)
0.017
0.110
0.133
0.247
0.223
0.358
0.340
0.518
N
Relative error of Device I (%)
6.667
22.000
17.778
24.667
17.827
24.039
19.864
26.860
N
Linearity of Device I (%)
23.932
3.784
15.044
2.331
11.935
1.314
12.638
/
N
Resistance V
Mean of Device I’s PIF (L/s)
0.223
0.383
0.557
0.727
0.917
1.097
1.193
1.250
Repeatability of Device I (L/s)
0.017
0.000
0.017
0.017
0.033
0.033
0.017
0.033
Y
Absolute error of Device I (L/s)
0.027
0.117
0.194
0.272
0.305
0.370
0.486
0.737
N
Relative error of Device I (%)
10.667
23.333
25.798
27.261
24.950
25.244
28.951
37.104
N
Linearity of Device I (%)
23.478
13.808
10.844
3.535
5.982
9.715
20.091
/
N
Impedance comparisons for Device I and Device P
Resistances
Device I kPa/L.min
Device P kPa/L.min
95% CI
R
0.0195 0.00012
0.0170 0.00005
(0.0023, 0.0026)
36.786
0.000
R
0.0208 0.00030
0.0214 0.00005
(0.0010, 0.0002)
4.130
0.014
R
0.0290 0.00023
0.0253 0.00017
(0.0022, 0.0034)
37.276
0.000
R
0.0317 0.00049
0.0288 0.00007
(0.0022, 0.0034)
13.100
0.000
R
0.0338 0.00354
0.0446 0.00040
(0.0154, 0.0063)
6.556
0.003
The impedance for these two devices under a fixed pressure (4 kPa) was assessed based on the flow rate at these 5 tested resistance gear levels. Device P exhibited greater impedance than Device I at the R2 and R5 resistance levels, whereas the opposite was true at the R1, R3, and R4 resistance levels (Table 3).
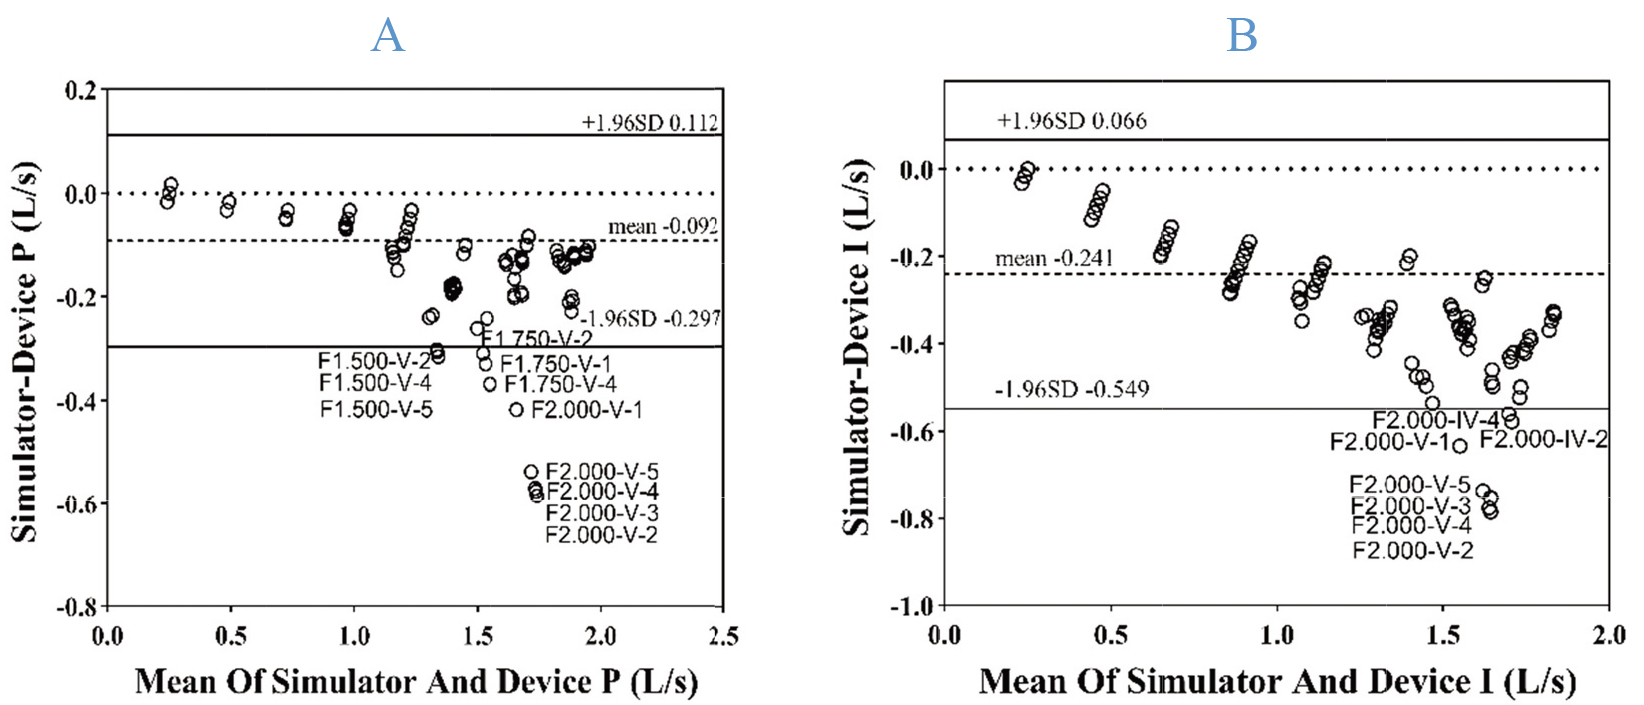
In Bland-Altman analyses, most (94.50% and 96.50%) measurement results and standard simulator values at the R1-R5 levels fell within the 95% limits of agreement (LOAs), indicating that the measurements produced by these two devices were in good agreement with the standard simulator values (Fig. 2).
Bland-Altman plots for measured values from these two devices and standard simulator values, with the limits of agreement extending from 1.96SD to 1.96SD (solid lines). Note: The meaning of the symbol of the test point in the chart is that the F represents Flow, the number after it represents the flow value set by the simulator, the IV and V represent the resistance gear, and the Arabic number after it is the number of tests. (A) Bland-Altman plots for measured values from Device P and standard simulator values. 94.50% (189/200) of data points were within the 95% limits of agreement (95% LOA). (B) Bland-Altman plots for measured values from Device I and standard simulator values. 96.50% (193/200) of data points were within the 95% LOA.
Discussion
While PIF is frequently measured with a standard spirometer, these measurements are made in the absence of any additional resistance. Some reports have demonstrated that these values are not strongly correlated with the PIF values measured with an In-Check DIAL device [25, 26], or that the two are not correlated at all [27]. As such, PIF measures from routine pulmonary function testing cannot be used to assess inspiratory ability under conditions of resistance. The ability to assess PIF in patients exhibiting additional resistance is of great clinical significance as an auxiliary means of inhaler device selection and inhalation pattern optimization [28].
It is important that appropriate quality control testing standards be established for measurement instruments to guarantee a strong scientific basis for measurement data reliability. Spirometers, which are the devices that are most frequently used to measure inhalation and exhalation, are subject to specific quality control testing methods and standards regulated by professional institutions [23]. Similarly, peak expiratory flow meters (PEFMs) are subject to a set of mature industry standards [24, 29]. However, methods and quality assessment criteria for PIF meters under additional resistance as discussed in this paper have yet to be firmly established. Barnes et al. [22] proposed that PIF repeatability should be 10 L/min when using the R2 (Diskus) resistance level during testing and 5 L/min at the R5 level (Handihaler). Their results were established in patients suffering from severe chronic obstructive pulmonary disease (COPD), and repeatability in these patients may be influenced by factors including inadequate respiratory muscle strength and airway obstruction. The In-Check DIAL has a minimum scale of 5 L/min, potentially impacting the accuracy of data analyses in the present study. The use of a standard flow-volume simulator can eliminate any variability resulting from individual patient-to-patient differences, and as such, repeatability criteria in this setting should be more strict. In the present study, both tested devices met a repeatability standard of 3 L/min. We thus posit that the repeatability of PIF measurements should be within 3 L/min under conditions of additional resistance.
Per the industry standard for PEFMs [29], the maximum allowable error for PEF measurements is within 10 L/min or 10%, owing to the large measurement values for PEF and the large degree of fluctuation in measurement error values in the absence of resistance. Under the same testing conditions in the present study, the maximum difference values measured between the standard simulator value and Device P and Device I were 0.533 L/s ( 32 L/min) and 0.737 L/s ( 44 L/min), respectively, which were measured in R5 at 2 L/s. Error increases as resistance and flow rate values increase, and as such, establishing the most appropriate error standards in a one-size-fits-all manner may not be feasible. Instead, these standards should be based upon the resistance grade. Under the same testing parameters, the maximum relative error values for Device P and Device I relative to the standard simulator value were 26.821% and 37.104%, respectively, with these values both having been recorded at resistance grade R5 at a flow rate of 2 L/s. When the flow rate was below 1.25 L/s, the relative error for Device P remained under 10%. Standard flow-volume simulators use regulated pressure to generate a specified flow rate over a range of resistance, but the target flow rate cannot be generated when the resistance level rises too high, pressure regulation fails, or other issues arise. As such, the reliability of quality control measurements made at a lower flow rate is likely to be higher. A rate of 60 L/min [30] is considered to be the node for dividing the optimal inspiratory flow rate of a DPI, and it is thus very important that measurements be reliable at flow rates proximal to 60 L/min. Here, Device P exhibited repeatability, absolute error, relative error, and linearity that met with established standard criteria at a flow rate below 60 L/min. Whether this suggests that quality testing should be conducted at moderate flow rates such as 60 L/min will require further study. In the absence of reliable quality control standards, such information will be vital to evaluate device performance in clinical practice.
Per the quality control standards for PEFMs, the linearity of a measurement instrument should be 5% [24, 29]. Using this standard level, the devices tested herein partially based the linearity test at resistance levels R1–R5 such that these devices did not exhibit linear increasing trends with increases in analytical parameters. PEFM quality testing standards are based on measurements made in the absence of any additional resistance. The applicability of this standard to PIF meters with additional resistance will thus need to be studied further. Relative to the repeatability standard proposed by Barnes et al. [22] the present study also provides potential evaluation indices including absolute error, relative error, linearity, and impedance that may be conducive to the more rigorous and objective evaluation of device performance.
The present findings support a recommendation that a standard flow-volume simulator be used to assess the quality of PIF meters under additional levels of resistance in order to guarantee appropriate measurement accuracy. When conducting such testing, all instruments should be allowed to rest in the same environment for at least 30 min before testing to ensure that any measurement errors resulting from differences in environmental conditions are minimized. All instruments were preheated for more than 15 min before the experiment, and the connections between the tested devices and the simulator were checked to ensure tightness. Under matching parameters, each device was then measured 5 times to generate one set of data. The standard of repeatability should be 3 L/min for each of these datasets, while the absolute error, relative error should be 5 L/min or 10%, and linearity should be 5%, respectively (the flow rate below 60 L/min should meet the above standards).
While the measurement results for these two tested devices did not fully meet with the quality control standard proposed herein, these results and standards nonetheless offer significance as a reference. One of the reasons why these devices fail to meet established performance requirements may be that standard flow/volume simulators also have certain errors in generating standard air flow (the error of flow 3% or 3L/min, error of repeatability 2% or 3 L/min (0.05 L/s), choosing the larger value, error of linearity 2%). To date, few reports have discussed quality control methods and standards for PIF measurements made under additional resistance, potentially owing to the type of instrument in question and the lack of any associated unified parameters. The instruments that are used for such testing are very demanding and not available to many institutions, limiting the implementation of standard quality control methodologies. Perhaps we should try more different experimental schemes to compare the evaluation effects of them, so as to explore the optimal detection methods and performance criteria. As such, additional innovative research will be vital to better clarify the optimal quality control methods and standards for these types of instruments.
Conclusion
A standard flow-volume simulator was used to test the quality of flow measurement instruments under additional resistance in an objective, scientifically rigorous manner. This approach to evaluate these instruments is highly conducive to further clinical application and to the more widespread use of these types of instruments.
Funding
The study was supported by the ZhongNanshan Medical Foundation of Guangdong Province (ZNSA-2020013); Key Technology R&D Program of Zhejiang, China (2020C03062); Science and Technology Innovation Project of Guangzhou Medical University in 2022–2023 (2021A001); National Key Technology R&D Program (Nos. 2018YFC1311901 and 2016YFC1304603) and National Science & Technology Pillar Program (No. 2015BAI12B10).
Author contributions
YP, ZW and KL wrote the manuscript; RH, JH, JL and SC collected and analyzed the data; YG and JZ corrected the manuscript. All authors reviewed and approved the final manuscript.
Ethics approval and consent to participate
Not applicable.
Availability of data and material
All data generated or analyzed during this study are included in this published article.
Competing interests
The authors have no conflicts of interest to declare that are relevant to the content of this article.
Footnotes
Acknowledgments
The authors would like to thank all reviewers who participated in the review and MJEditor (www.mjeditor.com) for its linguistic assistance during the preparation of this manuscript.
References
1.
BrusselleGGKoFW. Prevalence and burden of asthma in China: Time to act. Lancet.2019; 394(10196): 364-366. doi: 10.1016/S0140-6736(19)31349-2.
2.
Anees UrRAhmad HassaliMAMuhammadSA, et al. The economic burden of chronic obstructive pulmonary disease (COPD) in the USA, Europe, and Asia: Results from a systematic review of the literature. Expert Rev Pharmacoecon Outcomes Res.2020; 20(6): 661-672. doi: 10.1080/14737167.2020.1678385.
3.
MahlerDA. Peak inspiratory flow rate as a criterion for dry powder inhaler use in chronic obstructive pulmonary disease. Ann Am Thorac Soc.2017; 14(7): 1103-1107. doi: 10.1513/AnnalsATS.201702-156PS.
4.
ClarkARHollingworthAM. The relationship between powder inhaler resistance and peak inspiratory conditions in healthy volunteers-implications for in vitro testing. J Aerosol Med.1993; 6(2): 99-110. doi: 10.1089/jam.1993.6.99.
5.
SandersMJ. Guiding inspiratory flow: Development of the In-Check DIAL G16, a Tool for Improving Inhaler Technique. Pulm Med.2017; 2017: 1495867. doi: 10.1155/2017/1495867.
6.
LaubeBLJanssensHMde JonghFH, et al. What the pulmonary specialist should know about the new inhalation therapies. Eur Respir J.2011; 37(6): 1308-1331. doi: 10.1183/09031936.00166410.
7.
MuralidharanPHayesD Jr.MansourHM. Dry powder inhalers in COPD, lung inflammation and pulmonary infections. Expert Opin Drug Deliv.2015; 12(6): 947-962. doi: 10.1517/17425247.2015.977783.
8.
UsmaniOSBiddiscombeMFBarnesPJ. Regional lung deposition and bronchodilator response as a function of beta2-agonist particle size. Am J Respir Crit Care Med.2005; 172(12): 1497-1504. doi: 10.1164/rccm.200410-1414OC.
9.
BroedersMEMolemaJVermueNA, et al. In Check Dial: Accuracy for Diskus and Turbuhaler. Int J Pharm.2003; 252(1-2): 275-280. doi: 10.1016/s0378-5173(02)00650-6.
10.
CapstickTGCliftonIJ. Inhaler technique and training in people with chronic obstructive pulmonary disease and asthma. Expert Rev Respir Med.2012; 6(1): 91-101; quiz 102-103. doi: 10.1586/ers.11.89.
11.
SanchisJCorriganCLevyML, et al. Inhaler devices – from theory to practice. Respir Med.2013; 107(4): 495-502. doi: 10.1016/j.rmed.2012.12.007.
12.
van der PalenJ. Peak inspiratory flow through diskus and turbuhaler, measured by means of a peak inspiratory flow meter (In-Check DIAL). Respir Med.2003; 97(3): 285-289. doi: 10.1053/rmed.2003.1289.
13.
ChrystynH. Is inhalation rate important for a dry powder inhaler? Using the In-Check Dial to identify these rates. Respir Med.2003; 97(2): 181-187. doi: 10.1053/rmed.2003.1351.
14.
HaughneyJPriceDBarnesNC, et al. Choosing inhaler devices for people with asthma: Current knowledge and outstanding research needs. Respir Med.2010; 104(9): 1237-1245. doi: 10.1016/j.rmed.2010.04.012.
15.
EverardMLDevadasonSGLe SouëfPN. Flow early in the inspiratory manoeuvre affects the aerosol particle size distribution from a Turbuhaler. Respir Med.1997; 91(10): 624-628. doi: 10.1016/s0954-6111(97)90009-3.
16.
CeglaUH. Pressure and inspiratory flow characteristics of dry powder inhalers. Respir Med.2004; 98 Suppl A: S22-28. doi: 10.1016/j.rmed.2004.02.003.
17.
KondoTHibinoMTanigakiT, et al. Appropriate use of a dry powder inhaler based on inhalation flow pattern. J Pharm Health Care Sci.2017; 3: 5. doi: 10.1186/s40780-017-0076-9.
18.
KaminWEGenzTRoederS, et al. The inhalation manager: A new computer-based device to assess inhalation technique and drug delivery to the patient. J Aerosol Med.2003; 16(1): 21-29. doi: 10.1089/089426803764928329.
19.
KawamatawongTKhiawwanSPornsuriyasakP. Peak inspiratory flow rate measurement by using In-Check DIAL for the different inhaler devices in elderly with obstructive airway diseases. J Asthma Allergy.2017; 10: 17-21. doi: 10.2147/jaa.S127580.
20.
MahlerDAWatermanLAGiffordAH. Prevalence and COPD phenotype for a suboptimal peak inspiratory flow rate against the simulated resistance of the Diskusdry® powder inhaler. J Aerosol Med Pulm Drug Deliv.2013; 26(3): 174-179. doi: 10.1089/jamp.2012.0987.
21.
AltmanPWehbeLDederichsJ, et al. Comparison of peak inspiratory flow rate via the Breezhaler®, Ellipta® and HandiHaler® dry powder inhalers in patients with moderate to very severe COPD: A randomized cross-over trial. BMC Pulm Med.2018; 18(1): 100. doi: 10.1186/s12890-018-0662-0.
22.
BarnesCNMahlerDAOharJA, et al. Peak inspiratory flows: Defining repeatability limits and a predictive equation for different inhalers. Chest.2020; 158(4): 1413-1419. doi: 10.1016/j.chest.2020.03.072.
23.
GrahamBLSteenbruggenIMillerMR, et al. Standardization of spirometry 2019 update. An official american thoracic society and european respiratory society technical statement. Am J Respir Crit Care Med.2019; 200(8): e70-e88. doi: 10.1164/rccm.201908-1590ST.
24.
23747-2016 U-EI. Anaesthetic and respiratory equipment – Peak expiratory flow meters for the assessment of pulmonary function in spontaneously breathing humans (ISO 23747:2015). doi:
25.
DuarteAGTungLZhangW, et al. Spirometry measurement of peak inspiratory flow identifies suboptimal use of dry powder inhalers in ambulatory patients with COPD. Chronic Obstr Pulm Dis.2019; 6(3): 246-255. doi: 10.15326/jcopdf.6.3.2018.0163.
26.
PriceDBYangSMingSWY, et al. Physiological predictors Of peak inspiRatory flow using Observed lung function resultS (POROS): Evaluation at discharge among patients hospitalized for a COPD exacerbation. Int J Chron Obstruct Pulmon Dis.2018; 13: 3937-3946. doi: 10.2147/copd.S174371.
27.
GhoshSPleasantsRAOharJA, et al. Prevalence and factors associated with suboptimal peak inspiratory flow rates in COPD. Int J Chron Obstruct Pulmon Dis.2019; 14: 585-595. doi: 10.2147/COPD.S195438.
28.
HuaJLYeXFDuCL, et al. Optimizing inhalation therapy in the aspect of peak inhalation flow rate in patients with chronic obstructive pulmonary disease or asthma. BMC Pulm Med.2021; 21(1): 302. doi: 10.1186/s12890-021-01674-5.
29.
AdministrationCFaD. Anaesthetic and resiratory equipment – Peak expiratory flow meters for the assessment of pulmonary function in spontaneously breathing humans. 2016, YY/T 1438-2016. doi:
30.
RossDLSchultzRK. Effect of inhalation flow rate on the dosing characteristics of dry powder inhaler (DPI) and metered dose inhaler (MDI) products. J Aerosol Med.1996; 9(2): 215-226. doi: 10.1089/jam.1996.9.215.