
Abstract
BACKGROUND:
Short stems are advantageous for revision as they preserve autogenous bone. At present, the method of short-stem installation is determined based on the surgeon’s experience.
OBJECTIVE:
To provide the guideline for installing a short stem, we aimed to investigate the alignment effect on the initial fixation of the stem, stress transfer, and the risk of failure numerically.
METHODS:
Models in which the caput-collum-diaphyseal (CCD) angle and flexion angle were hypothetically changed based on the two clinical cases of hip osteoarthritis were analyzed using the non-linear finite element method.
RESULTS:
The medial settlement of the stem increased in the varus model and decreased in the valgus model. With varus alignment, the stresses acting on the femur were high in the distal to the femoral neck. In contrast, the stresses in the proximal to the femoral neck tend to be higher with valgus alignment, although the difference in the femur stress between varus and valgus alignment was slight.
CONCLUSION:
Both initial fixation and stress transmission are lower when the device was placed in the valgus model than in the actual surgical case. In order to obtain initial fixation and suppress stress shielding, it is essential to extend the contact area between the medial portion of the stem and the femur along the bone axis, and to ensure adequate contact between the lateral portion of the stem tip and the femur.
Introduction
In recent years, the number of total hip arthroplasty (THA) procedures using cementless short stems in clinical practice has increased worldwide because short stem THA preserves the autogenous bone in the distal medullary cavity of the femur and preserves the muscle tendons, allowing for a minimally invasive procedure. The short stem was developed in the 1980s, and many models have been proposed [1, 2, 3]. Many of these models had inadequate fixation in the past, but recent models have improved fixation, and good short- to mid-term clinical results have been reported [3, 4, 5, 6, 7, 8, 9]. Moreover, many studies on the mechanical effects of stem shortening on the femur using finite element analysis indicated that short stems have an advantage over conventional stems in load transfer at the proximal femur and are expected to reduce stress shielding [10, 11].
However, THA with short stems has introduced concerns about problems that rarely occur with conventional stems. Von Lewinski and Floerkemeier reported that early failures due to insufficient stem size or incorrect alignment in THA with Aesculap’s Metha short stem were more common than in THA with a conventional stem [12]. Because short stems do not reach the diaphysis, which allows for greater flexibility in alignment [13], there is a significant potential for postoperative outcomes to be affected. In addition, mechanical fixation by proper stem alignment is essential for initial fixation because cementless stems do not establish fixation by bone tissue in the short postoperative period. Therefore, it was noted that surgeons need to be especially careful if they are unfamiliar with the technical differences between the two types of the stem, which are conventional and short stems. The decision to install a short stem is based on surgeons’ experience. In other words, no precise guideline for installing optimal alignment has been created [2]. Ettinger et al. also proposed the need to study further the effect of alignment on stability for short stems [14], while many studies on the stability of short stems due to alignment have been conducted [14, 15, 16, 17]. On the other hand, there are not so many studies on the stress shielding of short stems due to alignment because of the focus on the stability of the preceding.
In the present paper, we investigated the effects of stem alignment on the initial fixation, stress transfer to the femur, and failure risk using finite element analysis (FEA), considering bone mineral density (BMD) distribution, which was introduced by Keyak [18] and indicated that it is helpful for the estimation of bone failure risk by Tawara et al. [19]. We believe that the present study will prevent bone atrophy due to stress-shielding and preserve bone, thereby reducing the risk of periprosthetic fracture, which is currently a problem in the long term, and achieving good long-term postoperative results.
Clinical information on two THA cases
Clinical information on two THA cases
Two typical THA cases due to acetabular dysplasia, shown in Table 1, were analyzed. Preoperative and postoperative CT images are shown in Fig. 1. In both cases, the THA was conducted using Lima Corporate’s MINIMA
CT images.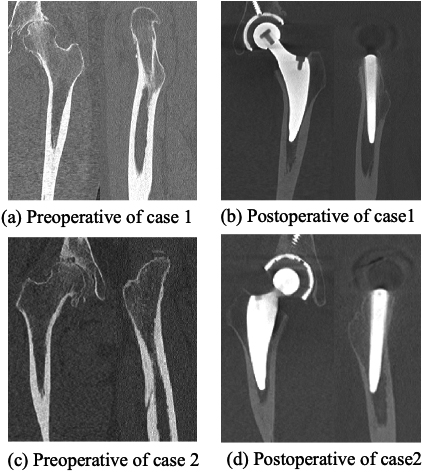
Dimensions of short stem MINIMA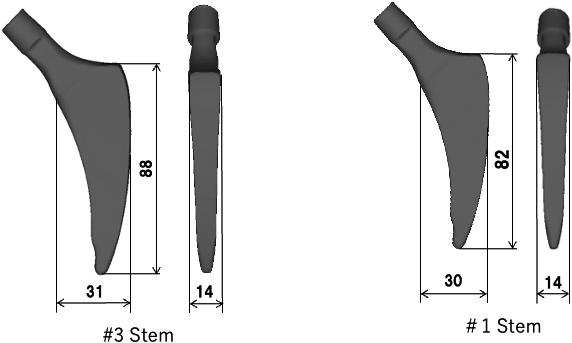
Definition of installation angles. Red lines indicate the femur shaft.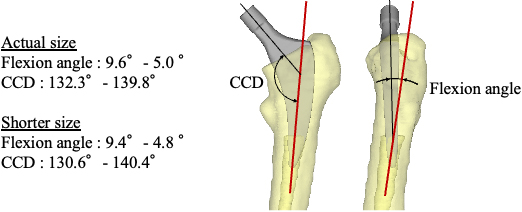
Analytical models of femurs were created based on preoperative CT images (1 mm slice thickness). The bone density of the femurs was calibrated using a bone mineral quantification phantom (B-MAS200: Fuji-Rebio, Tokyo). Stems were converted to 3D data using a 3D laser scanner (NextEngine inc., California, USA). Finally, the stem model was set into the femoral analytical model concerning the postoperative CT image. This stem alignment is referred to as “neutral” in the present paper. The models in which the CCD and flexion angles were changed compared to neutral were analyzed in case 1, as shown in Fig. 3. Similarly, varied alignments could not be analyzed in case 2 because the medullary cavity was narrow, and the smallest stem had been used in the MINIMA
Non-linear finite element analysis with non-uniform bone density was performed using MECHANICAL FINDER Ver. 10.0 (RCCM Inc., Tokyo, Japan). In this software, CT images (DICOM data) of the bone were converted to the bone density at each finite element, and it was calibrated using Phantom. The finite element model was constructed with first-order tetrahedral elements because the non-linear FEA calculation was not converged in the case of second-order elements. The mesh size of the femur was 2–4 mm based on the mesh convergence test performed using the same FEA software by Oba [21]. The mesh size of the stem was 1/10 of that of the femur (0.2–0.4 mm). In addition, the surface of the femur was provided with a shell element 0.4 mm thick to estimate fracture risk [22]. Consequently, the number of elements is about 350 000 for the femur and 210 000 for the stem. All materials were defined as linear isotropic materials. Young’s modulus was set to 110 GPa for Ti-6Al-4V. Young’s modulus for the femur was set for each element, which was calculated from bone density using the conversion formula proposed by Keyak [18]. The Poisson’s ratio of the femur was 0.3, and the stem was 0.28. A boundary between cortical bone and cancellous bone was not given in the present femur model because they could be distinct by the bone density set at each element. The coefficient of friction between the stem and femur was set at 0.3 based on the results of friction tests conducted on porous surfaces of the porcine femur (cortical bone) and the porous coated area of MINIMA [23]. As shown in Fig. 4, the distal end of the femur was fully constrained. The proximal end surface of the stem was subjected to an articulating force equivalent to 2.72-fold the body weight in a downward direction of 5
Analysis model.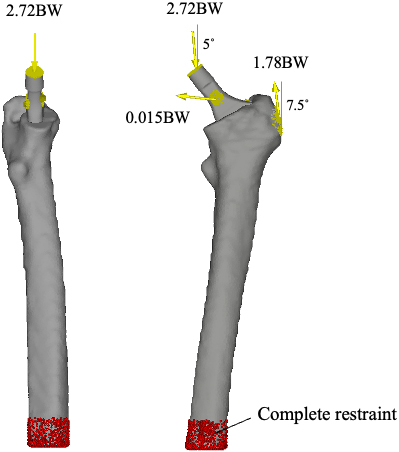
Micromotion
The stem was displaced downward by the load. The femur was also deformed, but instead of distorting vertically, it bent inward. This finding means that the femur’s medial and lateral portions moved downward and upward, respectively, while the stem moved downward. Calculating the relative displacement between the stem and femur is necessary to evaluate the micromotion of the stem. Figure 5 plots the direction components in the bone axis of the relative displacement between the node on the medullary cavity surface and the node on the stem in three-dimensional space. The pairs of nodes were used to be nearest to each in the unloaded condition. It is noted that the results include the local deformation of the stem and the femur. The local deformation of the stem is small, but the deformation of the femur is large. The blue color shows negative displacement, indicating that the stem moves downward against the femur, so-called subsidence. Red indicates that the stem was displaced relatively upward. The bending of the stem caused this. A figure deficiency shows a non-evaluating area because no femur is near the stem. In case 1, several tens of micrometers of subsidence occurred medially and at the stem tip (Fig. 5a). In case 2, there is a region where the relative displacement becomes positive at the end of the stem (Fig. 5f).
Relative displacement of the stem to the femoral in case 1 (a)–(e) and case 2 (f). CCD is 132.7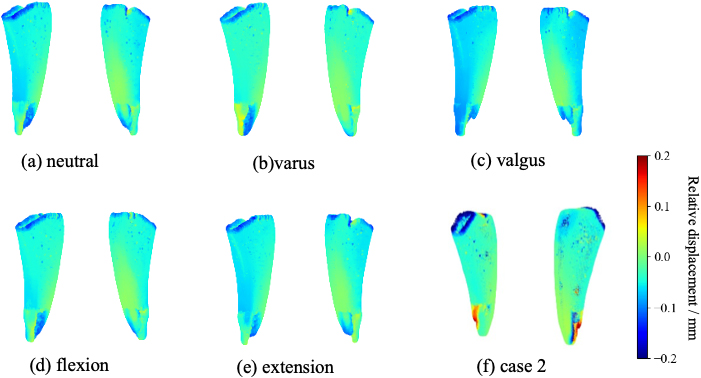
Cross-section of Von Mises stress in case 1 (a)–(c) and in case 2 (d). CCD is 132.7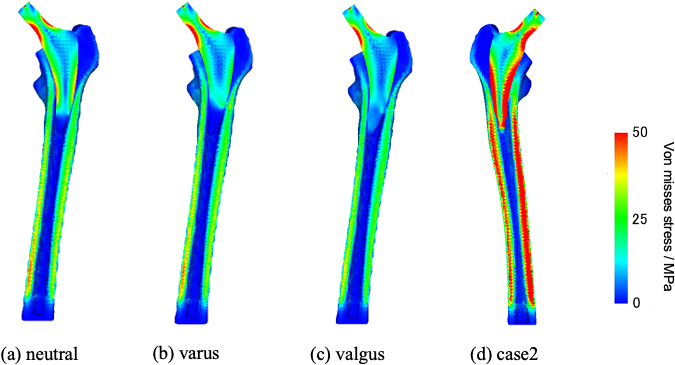
When the CCD is changed in case 1, the medial settlement increases in the varus model (Fig. 5b). At the same time, it decreased in the valgus model (Fig. 5c). There was a small area at the tip where the relative displacement became positive in the varus model. Moreover, the extensional installation increased the settlement (Fig. 5e), and the flexion installation decreased it (Fig. 5d).
Averaged Von Mises stress over each Gruen’s zone [MPa]
Averaged Von Mises stress over each Gruen’s zone [MPa]
Definition of Gruen’s zone in the present model.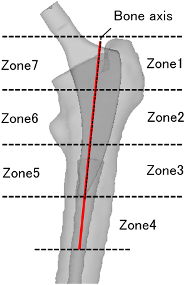
Distribution map of contact reaction force to the stem in case 1 (a)–(e) and case 2 (f). CCD is 132.7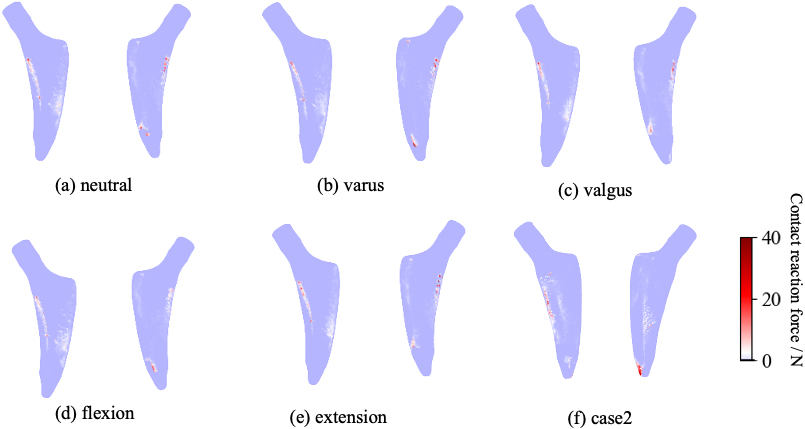
Contour map of average Von Mises stress for each zone in Case 1 when the installation angle is virtually changed.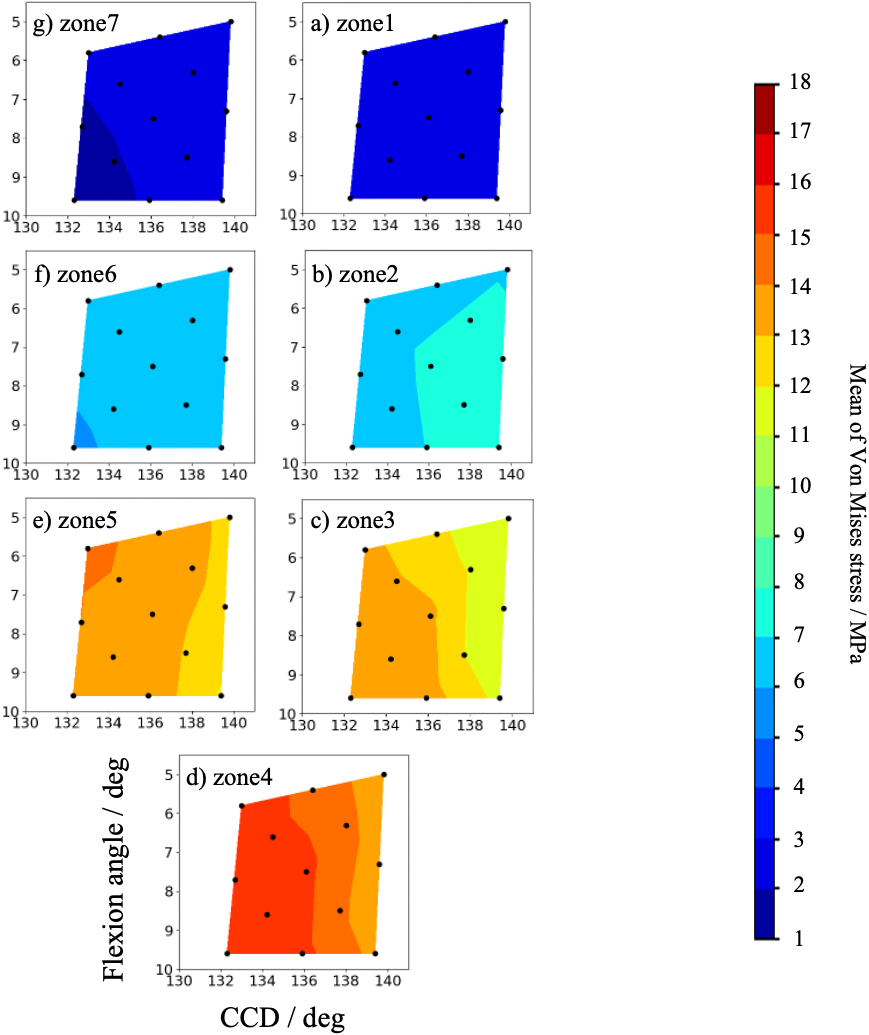
The Von Mises stress distribution diagram (cross-sectional view) is shown in Fig. 6. A femur was divided into 7 Gruen zones, as shown in Fig. 7, to evaluate the stress transferability. The extent of each of these zones was organized by pre-defined coordinates (x, y, z) for each zone, which includes the posterior and anterior regions. Then, the element stress in each zone was weighted and averaged by the volume of each element. The averaged stress over each zone is shown in Table 2. Because the patient in case 2 was heavier than in case 1, overall stress was higher in case 2 than in case 1 except in zones 6 and 7. The stress in zones 6 and 7 was lower in case 2 than in case 1, and the difference in stress between the distal and proximal portions was more extensive in case 2 than in case 1. Figure 8 shows the distribution of the contact reaction force, in which the light blue area indicates almost zero, and the darker the red intensity (on a white baseline), the more significant the force. In case 1, a slightly higher contact reaction force was observed in the proximal part, but almost no contact reaction force was present at the stem tip (Fig. 8a). In case 2, there was a high contact reaction force at the end of the stem, while the proximal portion had a low contact reaction force (Fig. 8f). Table 2 reflects this contact condition.
Figure 9 shows the average Von Mises stresses over each zone in Case 1 with a hypothetical change in the installation angle, represented by contour lines calculated by the values at the thirteen points shown in the figures. The horizontal axis is the CCD angle, and the vertical axis is the flexion angle, with valgus alignment on the left and valgus on the right, with the lower position representing flexion and the upper position representing extension. Overall, the stress transfer was small in the proximal zones similar to the results of Lerch [27], Munakata [28], and Tanii [29]. In detail, with varus alignment, the stresses were high in the distal zones, that is, 3, 4, and 5, while the stresses in the proximal zones 1, 2, 6, and 7 tend to be higher with valgus alignment, although the magnitude of the change is small. The stress was higher medially in extension, notably in zones 5, 6, and 7; in flexion, stress was higher laterally, that is, in zones 1, 2, and 3. In almost all zones in the original model, the central point was in the high-stress region.
Fracture risk was evaluated for the femoral surface shell elements using the tensile stress strength ratio defined as follows,
where
Figure 10 shows the tensile stress strength ratio of the femur model. In Case 1, the fracture did not occur at any angles when the CCD was hypothetically changed, but the fracture risk decreased with a valgus position (Fig. 10a–c). Fracture risk was comparable, and no fractures occurred in either flexion or extension alignment (Fig. 10d and e). Figure 10f shows the tensile stress strength ratio of the femur model in Case 2. Again, no fracture occurred, but the fracture risk was high compared to Case 1.
Destruction risk stem in case 1 (a)–(e) and case 2 (f). CCD is 132.7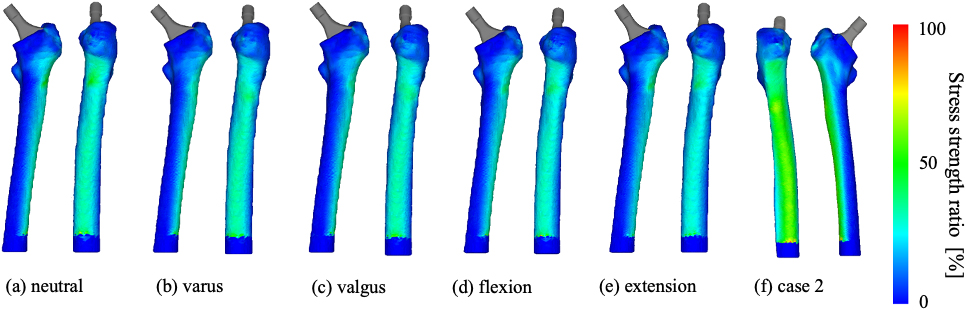
Initial potential for fixation
The relative displacement of the stem tends to increase as it changes from varus to valgus alignment, as shown in Fig. 5. Figure 8 shows the contact reaction force corresponding to Fig. 5. The medial contact region, apparent from the proximal part to the tip of the stem, is slightly smaller with valgus alignment. A small contact reaction force and small contact region imply that the stem is less likely to become fixed in the bone in that position. These are thought to be why there is an increased settlement with valgus alignment. Installation in extension increased the contact reaction force around zone 6. The extension is a factor in increasing the stress in zones 5, 6, and 7 (Fig. 9). These results indicate that it is crucial to fit the medial and lateral tips of the stem to the cortical bone to obtain initial fixation.
Clinically, Kutzner et al. performed a 2-year follow-up study on 216 patients who underwent THA with calcar-guided short stems and reported that outward-facing stems had more significant subsidence [30], consistent with the results of this study. However, they noted that a difference in the angle of the varus/valgus alignment of the stem did not affect the clinical outcome. Kwak et al. investigated the stresses on the cortical bone around the stem and micromotion between the stem and cortical bone depending on the length and position of the femoral stem using the finite element method: micromotion in the short stem showed a more significant increase in a varus than in a neutral position in walking or stair-climbing [31]. This result is different from the present study. The reason is that the bone structure was assumed to be homogeneous and isotropic in their calculation. Furthermore, they investigated the micromotion under walking or stair-climbing conditions, but the static standing position was in the present study.
Stress transferability
Figure 9 shows that varus alignment increases stress transfer compared to valgus. As shown in Fig. 8, the distal, lateral contact reaction force is more prominent in a varus alignment. It is caused by the tip of the stem impinging on the cortical bone in zone 3. Furthermore, it may be attributed to the increased stress in zones 3 and 4.
The effect of extension-flexion alignment on the stress was small compared with the effect of varus-valgus alignment. Yoshitani et al. reported no significant difference in clinical or radiographic outcomes between flexion and neutral alignment [32]. The extension position slightly increases stress transfer (Fig. 9) except in zone 3, caused by a proximal, medial contact force, especially posteriorly (Fig. 8). These findings thus indicate that varus and extension alignment confer high-stress transferability on the present short stem, MINIMA, by bringing both the tip and the proximal, posterior portion of the stem into contact with the femur. Kwak et al. noted that the mean stresses increased in a varus alignment [31], a finding consistent with the results of this study despite different stress conditions.
Interestingly, the stress in each zone indicated higher, though not maximum, at the neutral alignment shown at the center in each graph in Fig. 9. Therefore, it implies that the FEM calculation supported that the clinical alignment was suitable and/or the present calculation was correct.
Risks of failure
Figure 10 shows that no fracture occurred in either case 1 or 2 in any alignment. In detail, a slight decrease in fracture risk was confirmed in zones 3 and 4 in a valgus position, as shown in Fig. 10c. This finding can be explained by the contact reaction force diagram shown in Fig. 8 and the cross-sectional stress diagram shown in Fig. 6, where contact reaction forces and Mises stresses were lower in the distal femur of the valgus alignment than in the other alignments. Such a tendency is significant for the long-tapered stem because the momentum is more prominent in the long stem than in the short stem. So then, the varus alignment leads to a high failure risk in the long stem but does not in the short stem.
Gkagkalis and colleagues compared the clinical and radiological outcomes and perioperative complications of calcar-guided short stems between young (
Contour map of average Von Mises stress for each zone when the #3 stem is changed to a #1 stem virtually in case 1.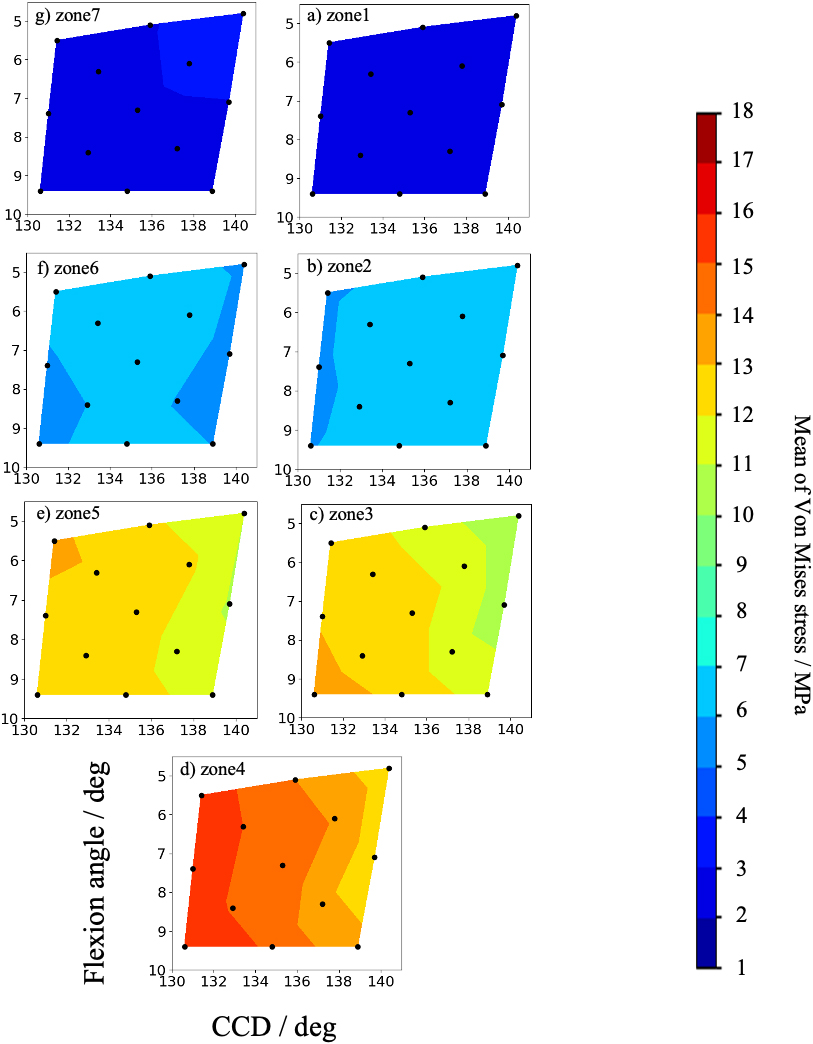
Relative displacement when the #3 stem is virtually changed to a #1 stem in case 1. CCD is 131.4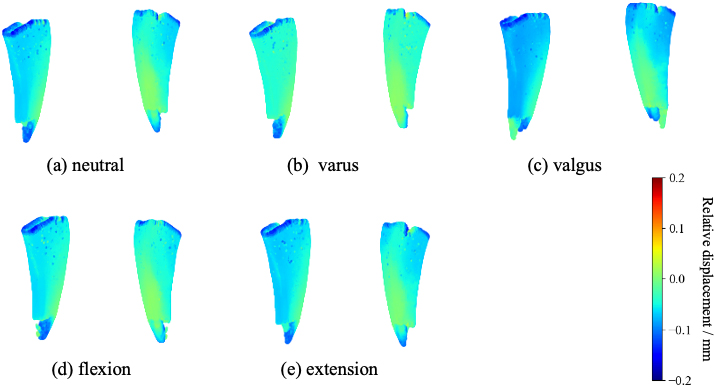
Distribution map of contact reaction force when the #3 stem is changed to a #1 stem virtually in case 1. CCD is 131.4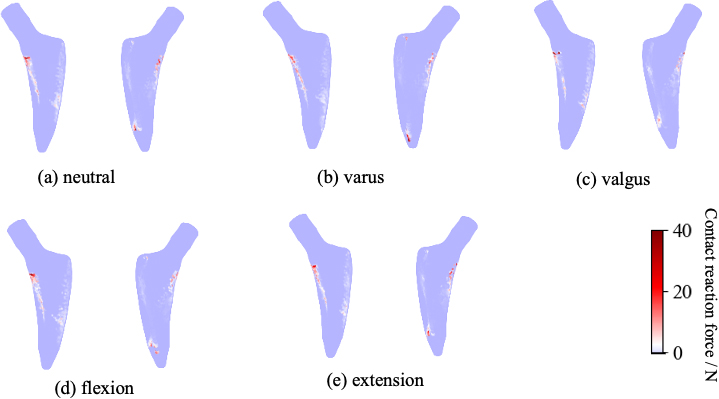
Destruction risk when the #3 stem is virtually changed to a #1 stem in case 1. CCD is 131.4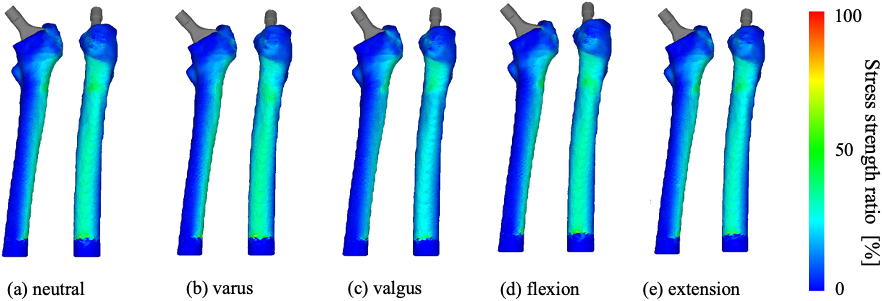
To examine the effect of stem size, we hypothetically reduced the stem size to #1 for case 1. As a result, the average von Mises stress in each zone decreased compared to the original size, with a slight decrease in both the varus and extension alignment, as shown in Fig. 11. In addition, the relative displacement of the stem increased overall alignment, as shown in Fig. 12. Furthermore, the region in sizeable relative displacement extends to the proximal part in valgus alignment, compared to the original stem size. The entire stem is displaced downward in the bone’s axial direction (Fig. 12). It is thought to be due to insufficient contact between the stem and the cortical bone caused by downsizing, resulting in axial sinking.
On the other hand, with varus alignment, the magnitude of the effect of the stem size on displacement is small. The distribution of contact reaction force with the reduced size is almost the same as the original size, while the contact position on the medial slightly moved to the tip of the stem, as shown in Fig. 13. It is due to the shortening of the stem. Figure 14 shows the tensile stress-to-strength ratio of the femur model of Case 1 when the stem size is reduced and the CCD is changed in this hypothetical scenario. A fracture did not occur at any angle, but as with the original size, fracture risk was reduced with valgus. Fracture risk was the same, and no fractures occurred in flexion-extension alignment.
Conclusion
Stress analysis for virtual alignments of the femoral stem after THA was performed in two Dorr Type B and A cases using MINIMA to investigate the initial fixation and stress transfer. The study showed a tendency for initial fixation and stress transfer to decrease when the device was placed in valgus alignment. Significantly, varus alignment in extension confers high-stress transferability. However, varus slightly enhances the risk of fracture. Therefore, varus is not recommended in patients with the thin cortical bone.
In order to obtain initial fixation, it is essential to extend the contact area between the medial portion of the stem and the femur in the direction of the bone axis and make sufficient contact between the lateral part of the stem tip and the femur. Moreover, selecting a stem size that is too small reduces the initial fixation and stress transfer.
It is noted that the present results are limited to the static position and for only two cases using the short stem MINIMA
Footnotes
Acknowledgments
The authors would like to thank Lima Corporate and the Shibuya Science Culture and Sports Foundation for grants supporting the license fee of MECHANICAL FINDER Ver. 10.0 (RCCM Inc., Tokyo, Japan). Furthermore, the authors would like to express their gratitude to Lima Corporate for supplying the stems and supporting the submission of the present paper.
Conflict of interest
One of the authors received research funding and a grant from Lima Corporate for the cost of submitting the paper for publication.
Funding
One of the authors received research funding and a grant from Lima Corporate and the Shibuya Science Culture and Sports Foundation.