
Abstract
BACKGROUND:
Monitoring physical activity with consumers wearables is one of the possibilities to control a patient’s self-care and adherence to recommendations. However, clinically approved methods, software, and data analysis technologies to collect data and make it suitable for practical use for patient care are still lacking.
OBJECTIVE:
This study aimed to analyze the potential of patient physical activity monitoring using Fitbit physical activity trackers and find solutions for possible implementation in the health care routine.
METHODS:
Thirty patients with impaired fasting glycemia were randomly selected and participated for 6 months. Physical activity variability was evaluated and parameters were calculated using data from Fitbit Inspire devices.
RESULTS:
Changes in parameters were found and correlation between clinical data (HbA1c, lipids) and physical activity variability were assessed. Better correlation with variability than with body composition changes shows the potential to include nonlinear variability parameters analysing physical activity using mobile devices. Less expressed variability shows better relationship with control of prediabetic and lipid parameters.
CONCLUSIONS:
Evaluation of physical activity variability is essential for patient health, and these methods used to calculate it is an effective way to analyze big data from wearable devices in future trials.
Introduction
Lack of physical activity and obesity belong to the biggest health problems we face. This leads to increased mortality related to cardiovascular diseases and diabetes. One of the conditions caused by lack of physical activity and malnutrition is prediabetes. Prediabetes is a transitional hyperglycaemic condition when glucose levels are elevated but not high enough to meet the diagnostic criteria for diabetes [1, 2].
However, it is a reversible condition, and prompt diagnosis and preventive action can stop or delay development or progression of its complications [3]. One of the actions to prevent these chronic diseases is increasing and promoting of physical activity.
The World Health Organization (WHO) 2010 guidelines state that an adult without significant mobility impairments should assign at least 150 minutes per week to moderate-intensity aerobic exercise or at least 75 minutes to high-intensity physical exercise or an equivalent combination of physical activity. To improve health and prevent chronic diseases, it is recommended at least to double time indicated in the basic guidelines for physical activity [4, 5, 6].
Healthy lifestyle professionals and disease prevention program developers are actively looking for ways to adapt and introduce more active lifestyle habits to the general public. Walking is considered a form of moderate physical activity and is a great way to maintain the required amount of physical activity [7, 8, 9, 10]. It not only facilitates easy access from point A to point B but also contributes to better health. The American College of Sports Medicine has systematized WHO recommendations and compared the usual recommended physical activity with 7,000–9,000 steps per day [11, 12, 13]. Recent years went through enormous mobile devices breakthroughs, and now we can count our steps using smartphones, smartwatches, and activity trackers [14] Smart bracelets measure the daily number of steps with sufficient accuracy and are suitable for long-term physical activity assessment [15]. Analysis of the data collected by these smart devices has shown that, on average, people walk 4,000 to 6,000 steps per day, which is only two-thirds of the recommended physical activity [16].
Now we have a simple way to test the physical activity change in free-living conditions using consumer wearables, such as smartwatches and physical activity trackers. Patients have the opportunity to perform self-monitoring of their physical activity. Some studies show us how much time people spend sedentary or physically active. Studies also show that physical activity during the week varies and can differ significantly [17, 18, 19, 20].
The aim of this study was to evaluate how physical activity variability, in the long run, impacts people’s health in free-living conditions and to analyse what impact physical activity variability in 6 months has on their glycated hemoglobin, cholesterol, and body composition. Our study included people with prediabetes who have a higher risk of developing diabetes.
During the literature review, we haven’t found the same or similar research looking for physical activity variability impact to people’s health in free-living conditions, so we have got some intriguing results for future research.
The aims of this study are: 1) to analyze the potential of patient physical activity monitoring using Fitbit devices; 2) to find variables associated with lipid profile and HbA1c changes in 6 months; and 3) to find solutions for possible implementation in the health care routine and health information system.
Methods
Subjects
Vilnius University Hospital Santaros Klinikos (VUHSK) Family Medicine Centre patients visiting their family doctor were included in our study. The selected study population had increased fasting glucose levels (5.6 to 6.9 mmol/l), did not have skeletal or muscular diseases, and conditions that compromise patients’ ability to move. The participants had to have a smartphone with the latest operating system, such as Apple iOS 13 or later and Android OS 8.0 or later, an email address and be able to use it.
30 subjects were selected. Subjects were informed about the study, its possibilities and benefits for their health. Informed consent form has been signed.
Blood tests were performed during the first consultation: total cholesterol, triglycerides, low-density lipoproteins, high-density lipoproteins, glycated hemoglobin. We also performed body mass composition analysis with the medical bioimpedance device X-Contact 356. Also, we provided physical activity recommendations and consulted on a healthy diet.
Subjects were given Fitbit Inspire physical activity trackers (PAT) and they were asked to connect the bracelet to their smartphones through the Fitbit application. If the patient failed to perform these actions, the PAT was connected by a family doctor.
After 6 months, during a consultation at the family medicine center, the subject was asked to transfer data from his online Fitbit account about his physical activity during the study period to the principal researcher’s main computer.
During this visit, we repeated blood tests: total cholesterol, triglycerides, low-density lipoproteins, high-density lipoproteins, glycated hemoglobin, and bodyweight analysis. The collected information was analysed and discussed with patients in order to suggest lifestyle changes.
The study was approved by the Vilnius Regional Biomedical Research Ethics Committee (approval no. 2019/6-1143-634).
Physical activity monitoring using Fitbit
Participants received Fitbit Inspire PAT (free of charge) during the consultation with the family doctor and agreed to allow researchers to collect data from their accounts. Subjects installed the Fitbit app on their smartphones and created their own user accounts with a personal email address. Then using a “Bluetooth” connection on the smartphones they connected their smart bracelets and synchronized with their personal Fitbit account. If the participant had difficulty with creating a personal account or connecting a bracelet, we helped him to do this and we taught him how to use the device [21]. Subjects had to periodically synchronise data with their phone throughout the study period by activating the Fitbit application on their smartphone and regularly charge their bracelet every 6–7 days.
After 6 months, during the routine visit at the family doctor’s office, we asked patients to log in to their accounts at
Fitbit data extraction process.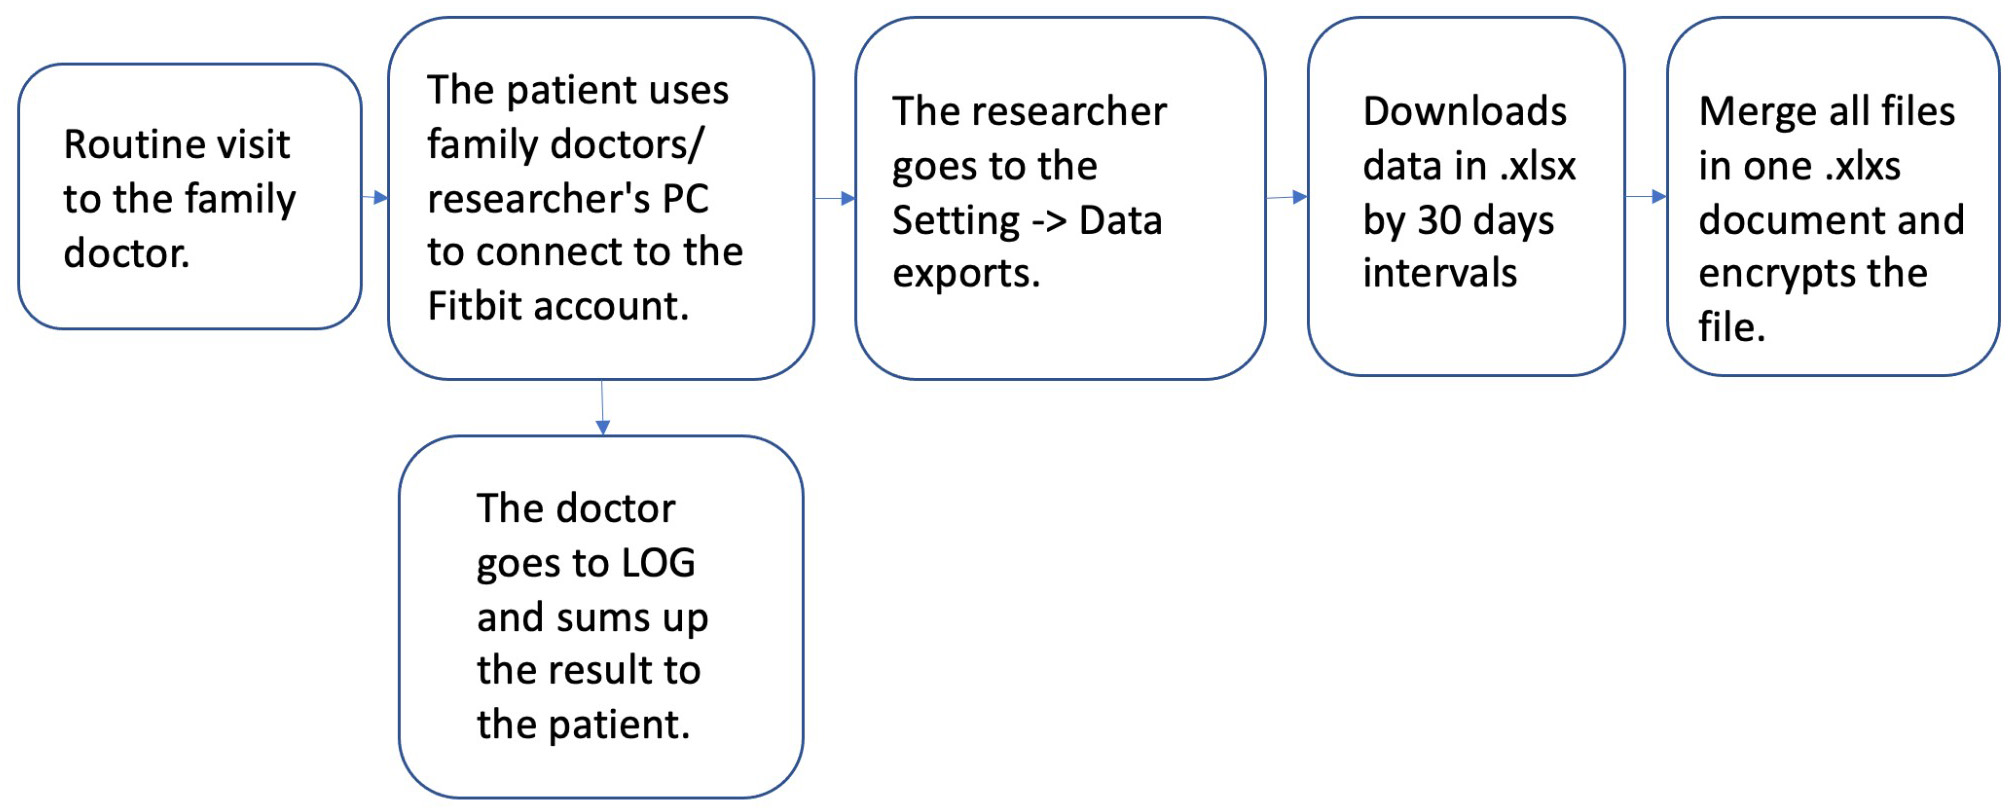
Fitbit data export platform.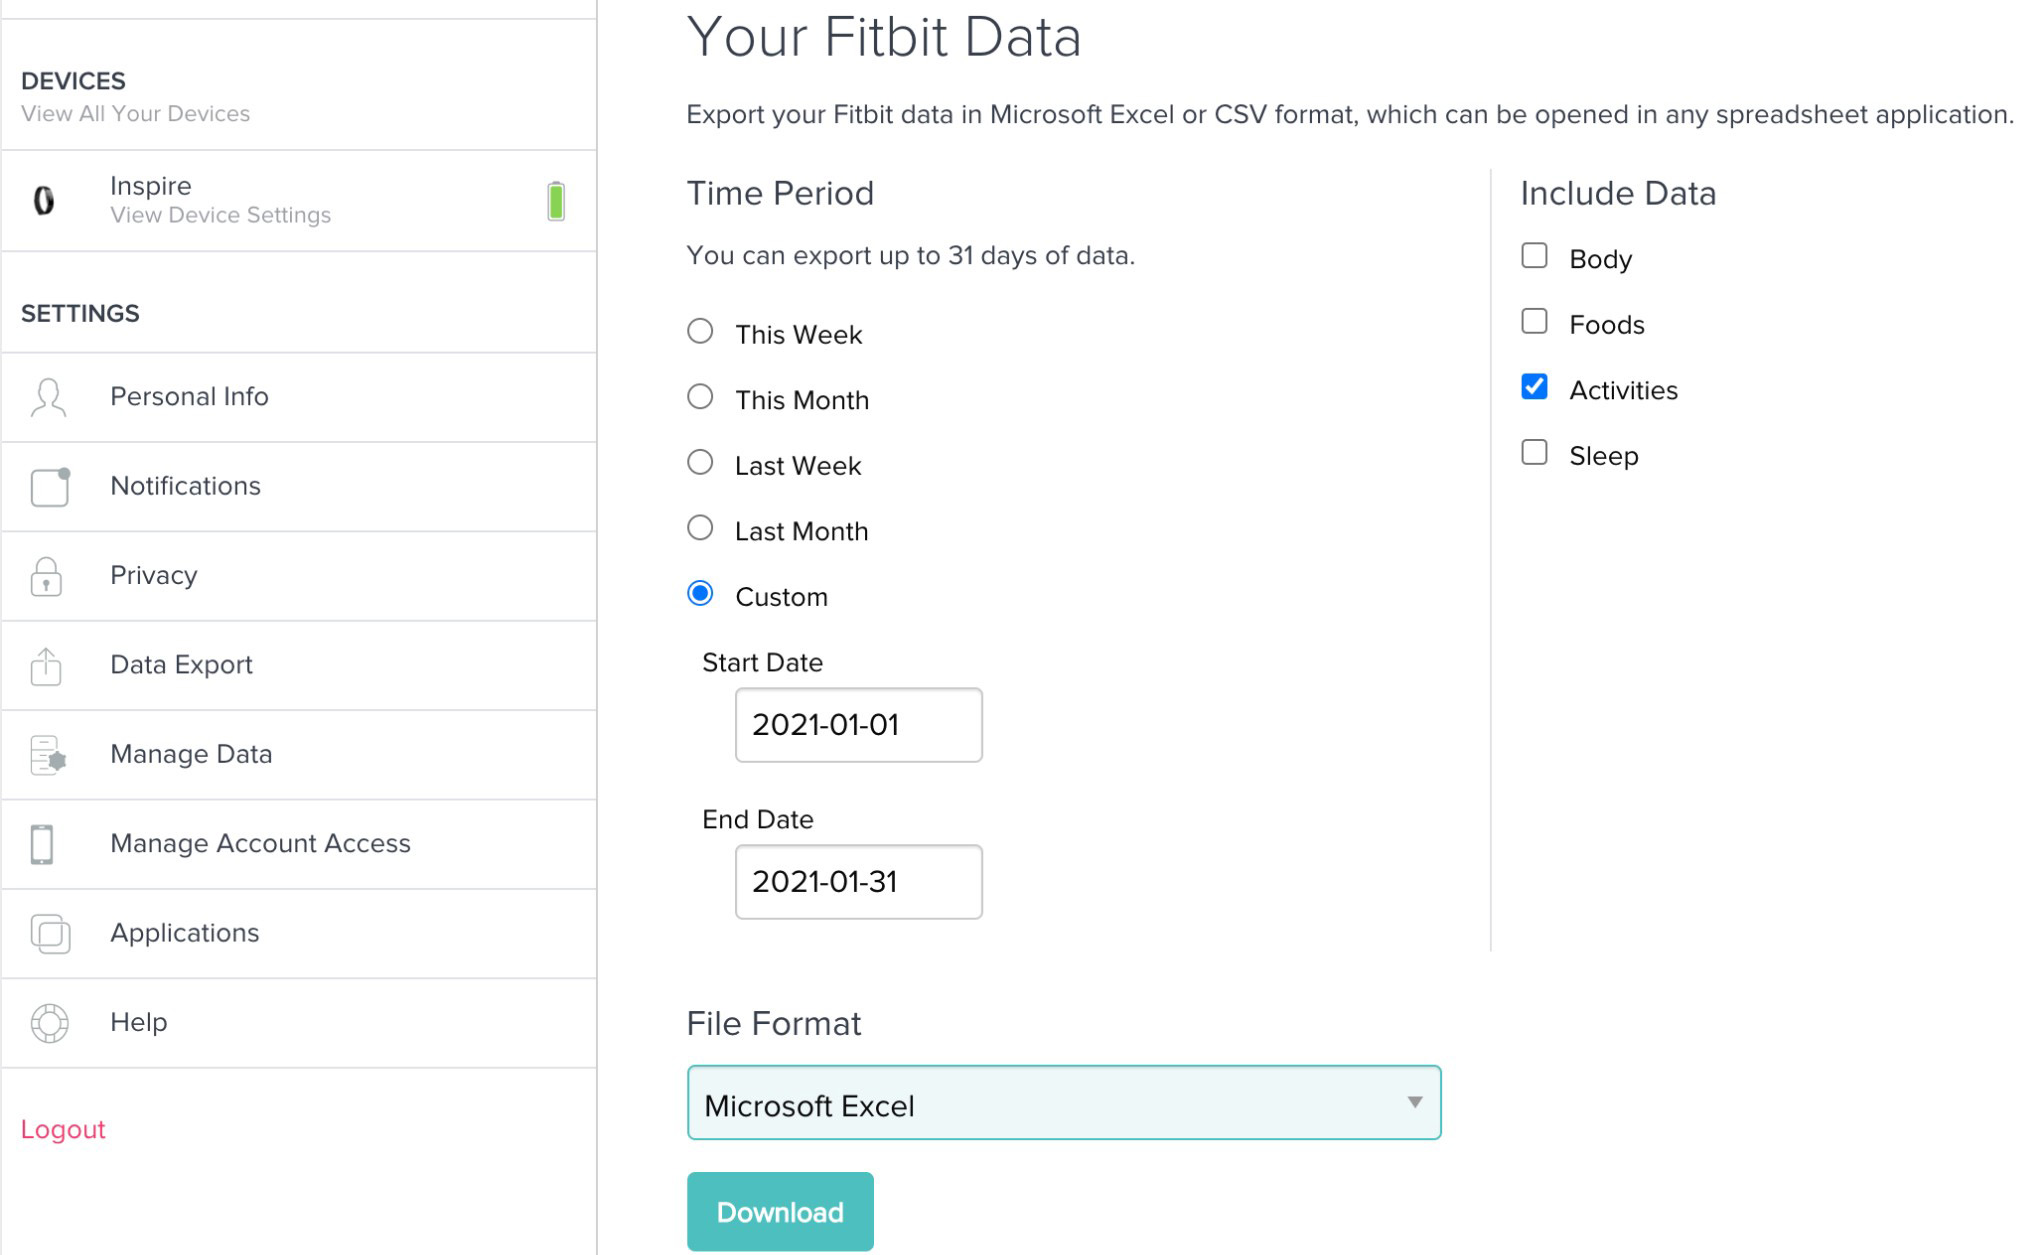
Data obtained from the smart bracelets were: physical activity recording data, steps per day, distance, minutes sedentary, minutes weakly active, active, minutes fairly active, minutes very active.
In this study, the Poincaré plot was used to analyze physical activity variability. The Poincaré plot is a two-dimensional scatterplot of paired values of time series data points, where the x-axis represents the current value at data point
Example of Poincaré plot for Step counts per day.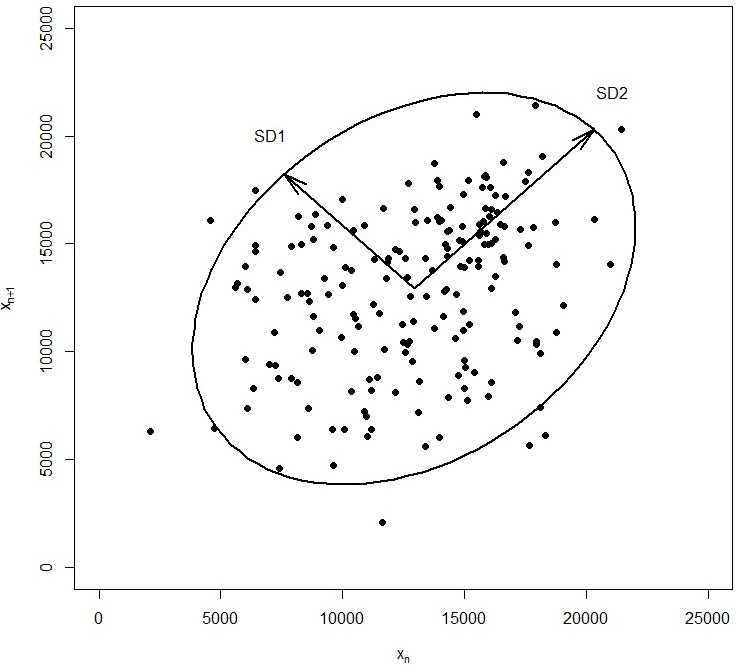
This method is widely used to study physiological signals [22], especially in the analysis of heart rate variability [23, 24, 25]. but there are also promising applications in other areas such as measuring hand grip strength [26], assessing blood pressure variability [27], monitoring temporal blood glucose fluctuations [28, 29, 30], studying reaction time during repeated testing [31], etc.
To analyze physical activity variability, the Poincaré plot method with a time delay of one day (
The Shapiro-Wilk test was used for normality testing. Data was presented as mean and standard deviation (mean
The list of abbreviations
The list of abbreviations
Subjects
Mean age of study subjects was 53.8
Paired samples tests
Paired samples tests
Values are presented as mean
In order to analyze physical activity variability, the Poincaré plots (Fig. 4) were represented and corresponding parameters were calculated for the exported Fitbit data (Table 3). Different patterns of physical activity variability were observed in different patients and different Fitbit data variables. SD1/SD2 ratio varied between 0.697 and 0.870 indicating higher long-term than short-term variability.
Fitbit parameters and calculated corresponding physical activity variability parameters
Fitbit parameters and calculated corresponding physical activity variability parameters
Examples of the Poincaré plot for Fitbit parameters. Patient A – male, age 42 years and patient B – female, age 65 years.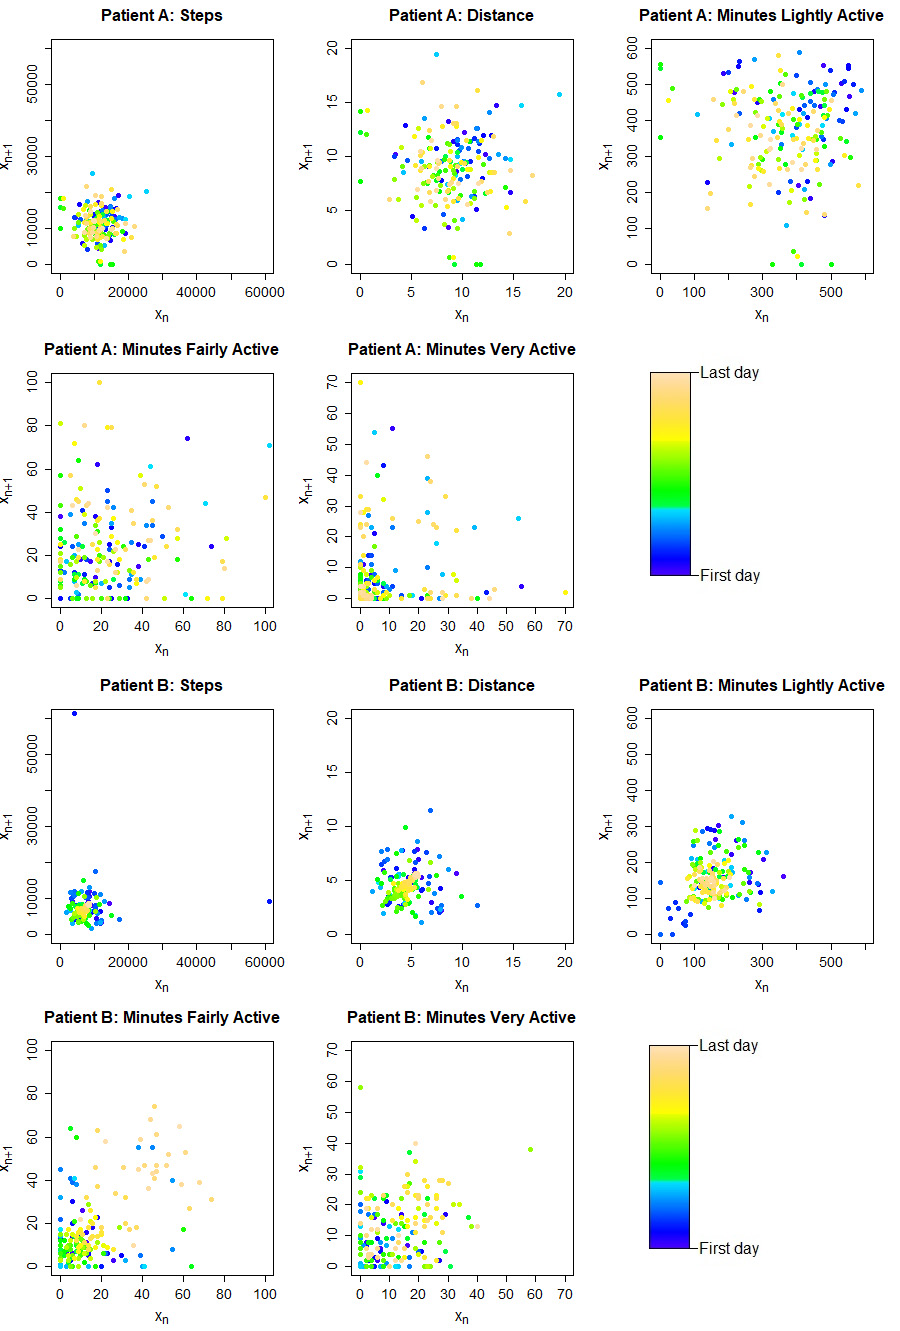
To measure association between physical activity variability (PHAV) parameters accessed from the Poincaré plot, Pearson’s and Spearman’s correlation coefficients were calculated (Fig. 5).
Heatmap of Pearson’s (A) and Spearman’s correlation (B) coefficients. Non-significant associations were shown as white spaces.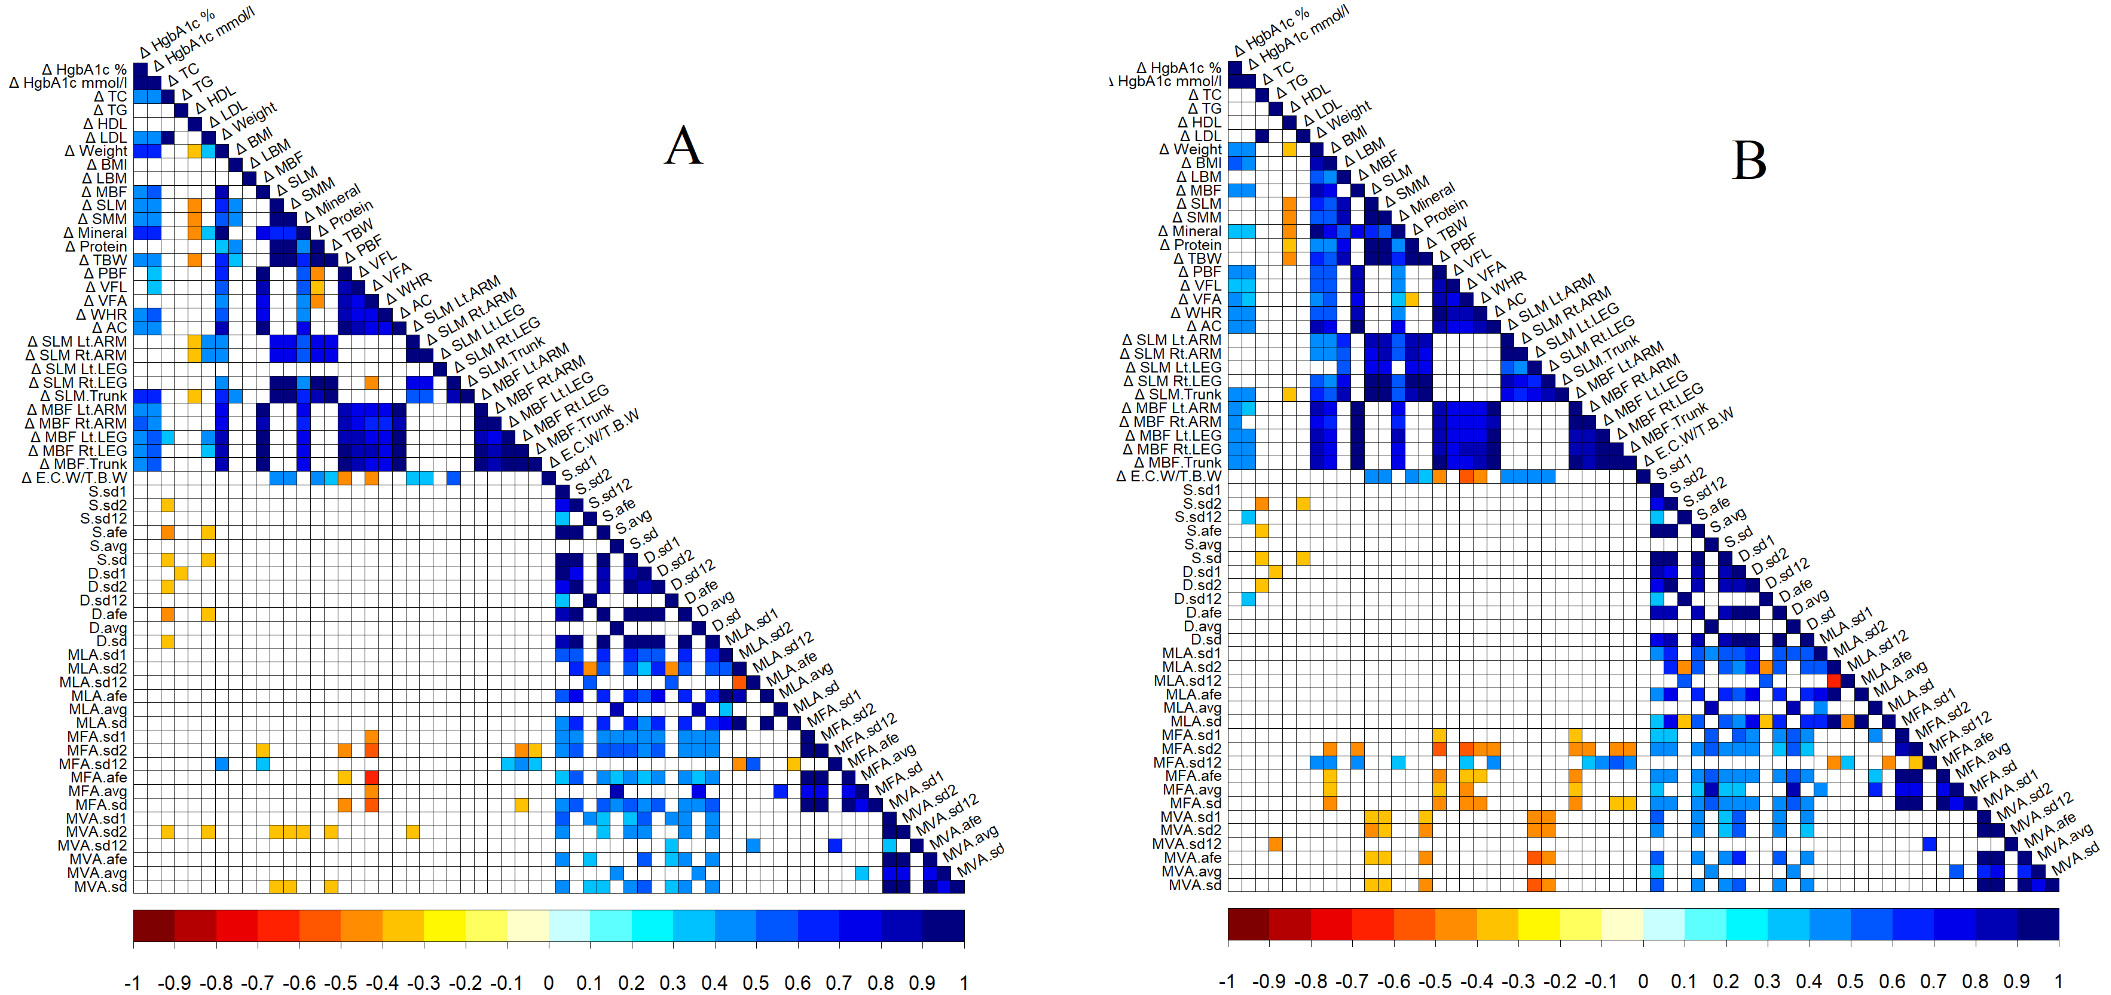
Statistically significant negative correlations between changes (delta
In previous paragraphs, we have described in detail how data were collected and analysed. However, many data operations (extraction, integration and analysis) were done manually. We have a vision to improve the proposed remote patient physical monitoring system in order the system could be used for all patients and we could remotely monitor patient health on a day-to-day basis. In this section, we will describe a vision of an integrated remote patient physical monitoring system compatible with existing SANTA-HIS and Lithuanian national eHealth framework.
VUHSK has developed hospital information system (SANTA-HIS), which integrates electronic health record, laboratory, picture archiving and communication system (PACS), registry of informed consent, staff and resource management, document management, quality management system, adverse events management system and many other systems that are necessary for effective health care services. SANTA-HIS system is integrated with Lithuanian national health information system which is called Electronic Health Services and Cooperation Infrastructure Information System (ESPBI IS). ESPBI IS was launched for patients and health care practitioners from 2015 and already has huge amounts of clinical data.
Figure 6 shows the vision of a remote patient physical monitoring system. The elements of the systems, which are shown in green, are already developed and used on a daily basis by health care practitioners.
Vision of remote patient physical monitoring system.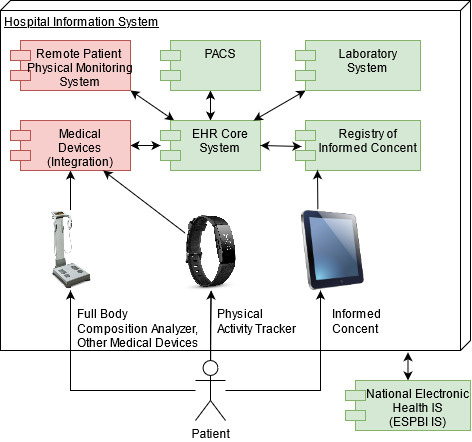
Remote patient physical monitoring system and external medical devices integration system (shown in red) should be implemented and integrated into existing SANTA-HIS in order to automate data operations.
We strongly believe that we can benefit from the systems integrations because we will have all needed data in one place, and we can make detailed analyses and have a clear picture of the patient’s health. Systems integration will let health care practitioners to review and use patient data collected in other clinics and laboratories. Objective patient physical activity data and other parameters are essential in clinical work because it helps us know how the patient feels under real-life conditions and adheres doctor’s recommendations. We can find out why a patient can’t reach those goals and help solve the problem faster and more effectively.
Nonlinear physical activity variability parameters showed potential to include variability measurement in monitoring patients with prediabetic status. Using these parameters, we can visualize physical activity variability (Poincaré plot). Implementation architecture suggested in our paper can be used for implementation of these parameters into clinical practice and improve telemonitoring availability for physicians. In future research, the target value for variability in daily steps and other physical activity parameters should be evaluated not only in the larger group of prediabetic patients but also in healthy subjects to understand the impact on clinical parameters and health improvement.
Footnotes
Conflict of interest
None to report.