
Abstract
BACKGROUND:
The current method to evaluate major depressive disorder (MDD) relies on subjective clinical interviews and self-questionnaires.
OBJECTIVE:
Autonomic imbalance in MDD patients is characterized using entropy measures of heart rate variability (HRV). A machine learning approach for screening depression based on the entropy is demonstrated.
METHODS:
The participants experience five experimental phases: baseline (BASE), stress task (MAT), stress task recovery (REC1), relaxation task (RLX), and relaxation task recovery (REC2). The four entropy indices, approximate entropy, sample entropy, fuzzy entropy, and Shannon entropy, are extracted for each phase, and a total of 20 features are used. A support vector machine classifier and recursive feature elimination are employed for classification.
RESULTS:
The entropy features are lower in the MDD group; however, the disease does not have a significant effect. Experimental tasks significantly affect the features. The entropy did not recover during REC1. The differences in the entropy features between the two groups increased after MAT and showed the largest gap in REC2. We achieved 70% accuracy, 64% sensitivity, and 76% specificity with three optimal features during RLX and REC2.
CONCLUSION:
Monitoring of HRV complexity changes when a subject experiences autonomic arousal and recovery can potentially facilitate objective depression recognition.
Keywords
Introduction
Nonlinear dynamics and information theory have been applied to physiological phenomena to understand the complex behavior of underlying biological systems [1]. In particular, cardiovascular regulation is known to originate from nonlinear regulatory subsystems mediated by an autonomic nervous system (ANS) [2, 3]: The interaction between sympathetic and vagal nerve stimulation on the heart rate control is not simply static, but rather dynamic and nonlinear [4]. Cardiac regulatory dynamics have been generally investigated using time series data extracted from electrocardiogram (ECG), i.e., the time intervals between consecutive R-peaks in the ECG signal (RRI). Heart rate variability (HRV), which represents variations in the RRIs, has been used to assess and model autonomic cardiac regulation [5]. Although HRV has been analyzed traditionally using linear methods, such as time- and frequency-domain analyses [5], growing evidence has demonstrated that linear HRV measures may not correctly represent the complex dynamics of heartbeat regulation modulated by the ANS [1, 2, 3] and that linear HRV features show a relatively higher inter-subject variability than nonlinear HRV indices [6], suggesting the importance of nonlinear HRV analysis.
Based on these results, nonlinear HRV analyses, including entropy, Lyapunov exponent, detrended fluctuation analysis, symbolic dynamics, or Poincaré plots, have been adopted to evaluate ANS activity in various clinical diseases. For example, nonlinear measures were used to model heartbeat dynamics in patients with ventricular arrhythmia [7], diabetes [8], Parkinson’s disease [9], and sleep apnea [10], as they differ considerably for healthy subjects. These results suggest that nonlinear and non-stationary characteristics of cardiac regulation can reveal relevant information on the pathological states of the ANS. Reduced complexity in HRV has been generally interpreted as an outcome of the pathological ANS dynamics of diseases, indicating the subject’s lack of ability to adapt to a changing environment [11].
Among these applications based on HRV, assessment of psychiatric disorders has great potential because conventional methods to evaluate most psychiatric disorders rely on verbal interviews and scores from subjective self-questionnaires [12]. Therefore, previous studies have attempted to find a more objective method to evaluate psychiatric disorders, using plasma biomarkers [13], functional imaging [14], salivary cortisol [15], vocal acoustic features [16], and physiological signals, such as electroencephalogram [17], and electrodermal activity [18]. In addition, nonlinear HRV measures have been used to study psychiatric disorders, such as major depressive disorder (MDD) [6], bipolar disorder [19, 20], and schizophrenia [21]. Given that HRV measurement is non-invasive and easy-to-quantify, this technique can facilitate objective evaluation and accurate identification of patients with psychiatric disorders. Furthermore, with recent advances in machine learning methods, automated diagnosis systems for psychiatric disorders have been demonstrated based on nonlinear HRV analysis. For example, Valenza et al. demonstrated the feasibility of predicting mood changes between depression and euthymia in bipolar patients using nonlinear HRV features [22]. HRV entropy combined with other physical activity measures has been successfully used to classify patients with schizophrenia from healthy controls [23].
In this study, we demonstrate the entropy analysis of HRV measured from patients with MDD and its application for automated MDD detection using machine learning approach. Entropy-based measures have been widely used to quantify complexity in various biomedical time series datasets, including RRI data [2, 3, 24]. Entropy analysis can be applied to non-stationary data and is more resistant to noise than the linear HRV indices. Furthermore, compared to other nonlinear measures such as the fractal dimension, correlation dimension, and Lyapunov exponents, entropy measures require a shorter length of data [25, 26]. This characteristic suggests that entropy measures may provide more reliable results from short-term HRV analysis (e.g., 5 min) than other nonlinear HRV features.
Depression is a common disease with a significant economic burden, which is characterized by a persistent low mood, fatigue, insomnia, anhedonia, restlessness, and substantial weight loss or gain [27, 28]. Major depression is also associated with an increased risk of coronary heart disease, and the disturbed ANS system is one of the mechanisms underlying a link between MDD and cardiovascular disease [29]. Untreated severe depression can lead to suicidal behavior, which is a serious social issue [30], affirming the need to develop an objective diagnosis technique for MDD that can compensate the conventional methods. Our study is inspired by several previous studies, which have demonstrated that HRV-based automated diagnosis systems for MDD using machine learning methods [31, 32, 33, 34, 35]. The aforementioned studies applied neuro-fuzzy networks, support vector machine (SVM), linear discrimination analysis, logistic regression, and Bayesian networks on HRV features to differentiate MDD patients from healthy controls. These studies achieved accuracies between 71–95%. However, their results were partially or entirely dependent on linear HRV features. Machine learning-based diagnosis of MDD considering nonlinear HRV features has not been studied in detail. To the best of our knowledge, classification of major depression based solely on entropy features has not been reported to date.
We consider four entropy measures: approximate entropy (ApEn), sample entropy (SampEn), fuzzy entropy (FuzzEn), and Shannon entropy (ShanEn). Pincus first proposed the concept of ApEn to assess time series irregularity and to represent signal randomness [3]. SampEn and FuzzEn were developed later as improved versions of ApEn [24, 36]. In addition, ShanEn, which is based on information theory and used to evaluate the distribution complexity of heartbeat signal samples, has also been introduced [37]. Entropy features measured from patients with MDD have been previously reported. For example, the HRV ApEn and SampEn values obtained from MDD patients are significantly lower than those of healthy subjects [38, 39, 40, 41]. In addition, the HRV ShanEn is significantly reduced in patients with MDD [42] or bipolar disorders [43], suggesting that entropy measures are substantially affected by depressive symptoms.
Therefore, we first aim to analyze the entropy features measured from patients with MDD and healthy controls. In addition to the measurement of the basal ANS activity, we consider mental stress to examine the ANS reactivity to stimuli and the recovery from the stimuli. Previous studies have demonstrated dysfunctional autonomic responses to stimuli such as emotional cues and stress, resulting in attenuated or exaggerated HRV reactivity [44, 45, 46, 47, 48]. Furthermore, patients with MDD showed weaker stress recovery than the healthy controls [49]. The second aim is to demonstrate automated differentiation of patient with MDD using the entropy features as input data. To this end, feature selection is performed by support vector machine-recursive feature elimination (SVM-RFE), and four machine learning algorithms are employed. We expect that multiple autonomic alterations during the measurement may improve the discriminative power of HRV features [50].
Materials and methods
Participants
All participants were recruited at the Samsung Medical Center, Seoul, Korea. A total of 33 MDD patients and 33 healthy controls participated in the experiment, and they were matched for age and gender. A senior psychiatrist evaluated the patients with MDD based on the DSM-IV criteria. The depressive episode severity was evaluated using the Hamilton depression rating score (HAMD) [51]. Healthy subjects who had no history of psychiatric disorders were recruited to be part of the control group. The experimental procedure was explained to all participants, and they submitted signed informed consent. As compensation, $50 was paid to each participant. This study was approved by the Institutional Review Board of the Samsung Medical Center, Seoul, Korea (No. 2015-07-151), and performed according to the relevant guidelines.
Experimental procedure
All subjects entered a room and sat in an armchair with a headrest. The experimenter explained the measurement procedure in detail while attaching the electrodes and sensors. The protocol used in this study was designed to assess autonomic reactivity to mental stress and relaxation tasks (Fig. 1) [50]. The entire protocol consisted of five consecutive phases: the baseline (BASE), mental stress task (MAT), recovery from the stress task (REC1), relaxation task (RLX), and recovery from the relaxation task (REC2) phases. Each phase was 5-min long. During BASE, the subjects were instructed to rest and minimize their movement to measure basal ANS activity. During MAT, a mental arithmetic test was conducted by the subjects, who were asked to serially subtract 7 starting from 500 and to report answers verbally [52]. The mental arithmetic test has been widely used as a psychological stressor to perturb the cardiovascular system and measure autonomic reactivity in depressed patients [45]. During REC1, the subjects were instructed to relax to allow autonomic recovery from the mental task. During RLX, the subjects were asked to rest while watching 10 30-s long images of natural scenery presented on a PC monitor. In the final phase (REC2), the image presentation was stopped, and the subjects were instructed to rest to allow autonomic recovery from the relaxation task.
Experimental protocol for ECG measurement. ECG signals were recorded during five consecutive phases, each of which had 5 min duration.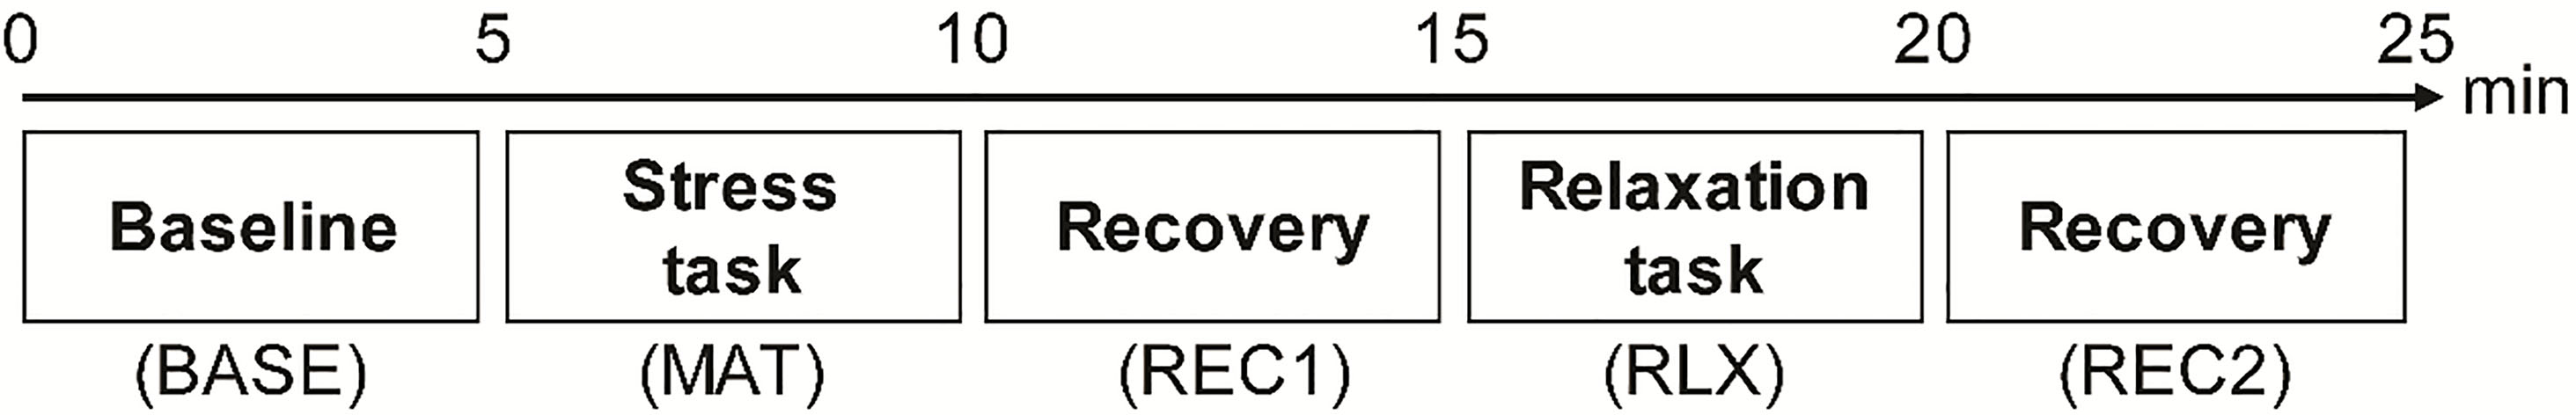
Electrocardiogram (ECG) signals were measured using the ProComp Infiniti system (SA7500, Thought Technology, Canada). Three Ag/AgCl electrodes were attached on the wrists and an ankle in a lead II configuration. The measured signal was amplified, band-pass filtered, and sampled at 256 Hz. We used Kubios HRV Premium software (Kubios, www.kubios.com) to analyze the ECG signals. This system implements an in-house QRS detection algorithm based on the Pan-Tompkins method [53, 54]. All detected R-peaks were inspected by the same operator to maintain consistency. A piecewise cubic spline interpolation method was used to correct artifacts. Finally, the entropy features were calculated separately from the individual phases using the RRI data.
Approximate entropy
Pincus first suggested ApEn to measure time-series data irregularity. In this work, we followed the originally proposed ApEn definition [3].
First, a sequence of vectors
Then, for each
where
Next, we define
Finally, ApEn is defined as
The value of ApEn depends on three parameters, i.e., the embedding dimension,
SampEn was proposed to decrease bias in ApEn, which is caused by self-comparison of vector
Next, we define
Then, SampEn is defined as
In this study, the values of
FuzzEn was introduced by Chen et al. to reduce the parameter dependence of SampEn [36]. The vector similarity in ApEn and SampEn is defined based on the Heaviside function. However, FuzzEn is derived from the concept of fuzzy sets, with the Heaviside function being replaced by an exponential function. First, all vectors are normalized by removing a baseline
Therefore,
The similarity degree,
The following relation is then defined:
Finally, FuzzEn is defined as
In this study, the values of
ShanEn is used to assess the complexity of the RRI series distribution based on information theory [57, 58]. First,
where
Figure 2 shows an overview of the data processing procedure. A leave-one-out (LOO) method was used to split the data and evaluate performance of the classifier. We used an SVM-RFE algorithm as a feature selection method [60]. The RFE algorithm is a backward sequential selection method, which eliminates the least relevant features individually during each iteration. For this study, the feature importance was decided by the weights calculated from an SVM algorithm with a linear kernel function. All procedures were performed using MATLAB R2018a (MathWorks, Natick, MA). The feature selection was performed using Library for SVM (LIBSVM) [61] and the RFE algorithm from the Mathworks File Exchange [62].
Overview of data processing procedure.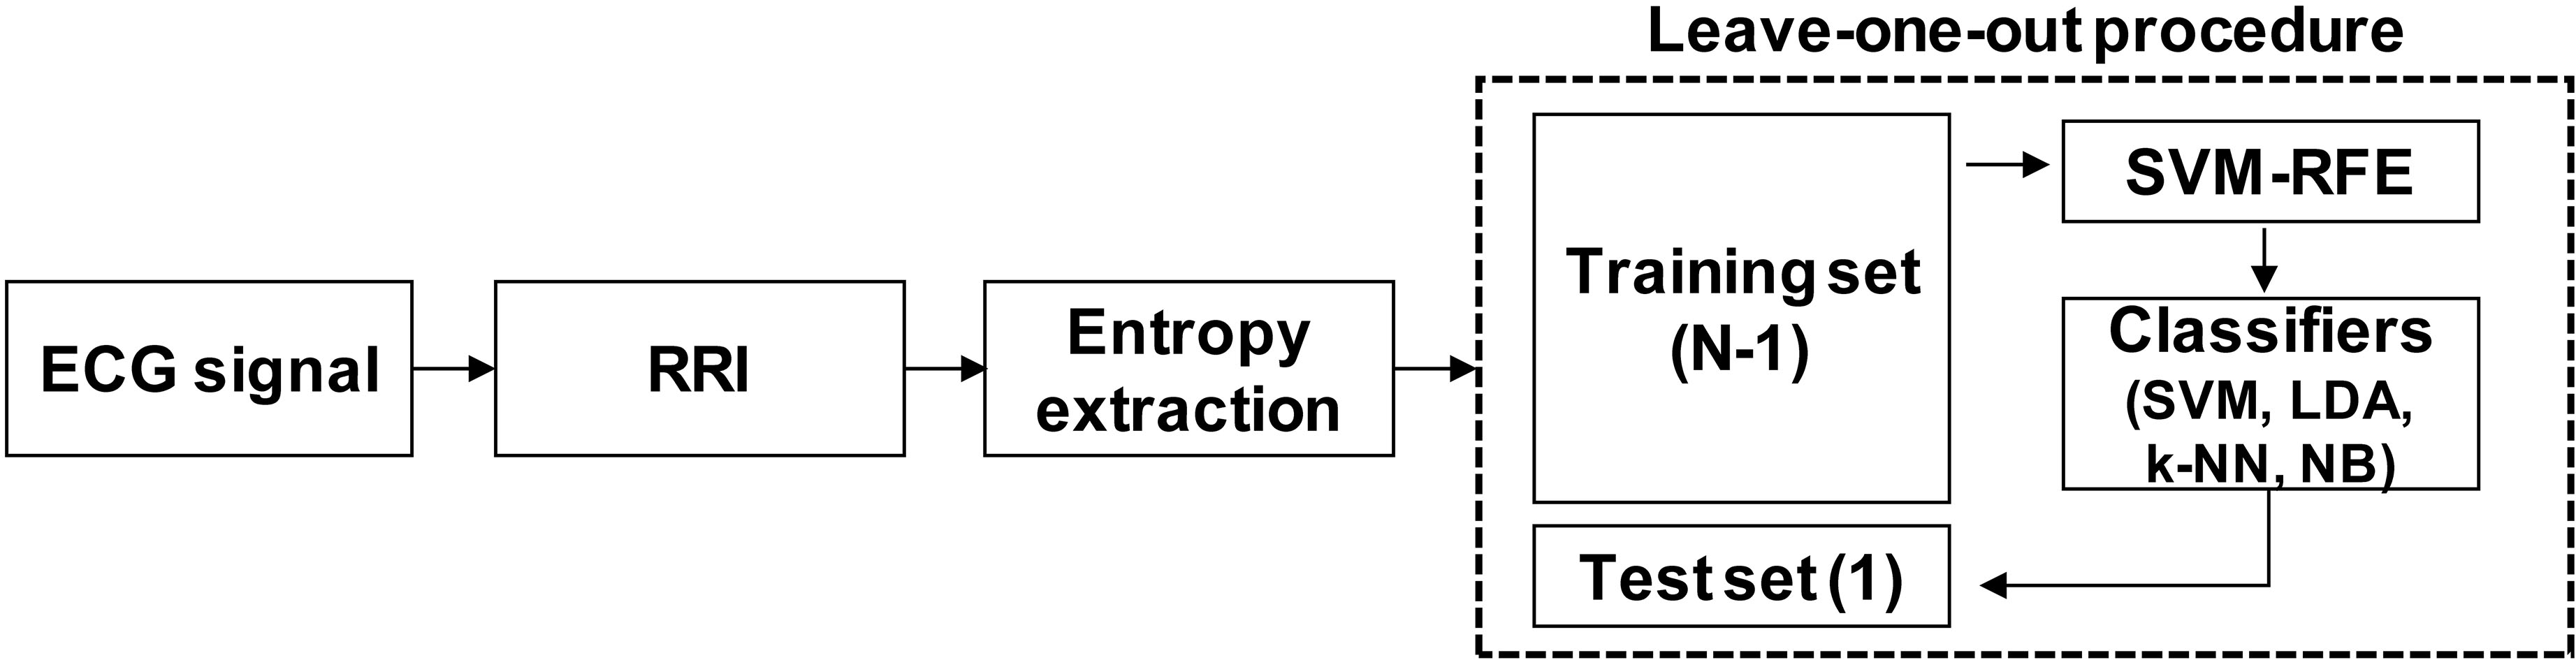
For the LOO procedure, the entropy data were normalized by subtracting the median and dividing by the mean absolute deviation (MAD). Four supervised machine learning algorithms, i.e., SVM, linear discriminant analysis (LDA),
We present a brief description of each classifier here. Further details on these machine learning algorithms can be found in the literature [63, 64, 65]. An SVM algorithm is based on the margin maximization principle [65]. The input data is mapped into a high-dimensional feature space, and in this space, an optimal separating hyperplane is constructed, which maximizes the interclass distances [66]. We used a linear kernel function for both the SVM-RFE and the classifier model. We employed a fixed value of the regularization parameter
An LDA assumes a normal distribution of the data with an equal covariance matrix [67]. It seeks a projection that maximizes the ratio of the between-class variance to the within-class variance [63]. As the LDA requires very low computational power and is simple to implement, it is suitable for classifying various physiological signals [67, 68].
Construction of a
An NB classifier is a probabilistic model derived from Bayes’ theorem, which relies on two assumptions: (1) the predictive attributes are assumed to be conditionally independent given the class; (2) it is assumed that no hidden attributes affect the prediction process [69]. Under those assumptions, the Bayesian classifier uses a training dataset to estimate the parameters of the feature probability distribution. Then, it calculates the posterior probability of the newly introduced test data and chooses the class with the maximum value. In the present study, we assumed that the entropy measures followed a Gaussian distribution.
Statistical analyses
Statistical analyses were performed using MATLAB R2018a, SPSS 25 (SPSS Inc., Chicago, IL, USA), and R software 3.5.1 (The R Foundation for Statistical Computing, Vienna, Austria). The age, years of education, body mass index (BMI), and HAMD were compared between the MDD and control groups using Mann-Whitney U tests as these factors were not normally distributed. The sex and marital status were compared between the two groups using chi-square tests. ApEn, SampEn, FuzzEn, ShanEn, and RRI were tested for the assumptions of normality and homogeneity of variance required for an analysis of variance (ANOVA) using the Shapiro-Wilk test and Levene’s test, respectively. SampEn, FuzzEn, and RRI satisfied both assumptions. Therefore, we used a repeated-measures ANOVA to test the effects of group and task on those features. In contrast, ApEn and ShanEn violated the normality assumption. For those features, we used the non-parametric equivalent of a repeated-measures ANOVA to test the effects of group and task using the R statistics package “nparLD” [70]. This package included a rank-based non-parametric method, which utilized estimators of relative treatment effects to test longitudinal data in factorial experiments [71]. Hence, ANOVA-type statistics for examination of the hypotheses were provided. Statistical tests of the main effects were followed by post-hoc pairwise comparisons between different tasks, which were corrected using the Bonferroni method. In all statistical tests, a
Results
Demographic and clinical characteristics of participants
The participants for the present study were 33 healthy subjects (24 females) and 33 MDD patients (24 females). Descriptive statistics of the demographic and clinical characteristics of the participants are summarized in Table 1. No significant differences were observed for sex, age, years of education, marital status, or BMI. The MDD group showed significantly higher HAMD than the control group (
Demographic and clinical characteristics of control and MDD groups
Demographic and clinical characteristics of control and MDD groups
The factors of the two groups were compared using the Mann-Whitney U test (
A. Effects of group and task on RRI tested with repeated-measures ANOVA; B. The simple main effect of the task was significant for both MDD and control groups (
Post-hoc pairwise comparisons between tasks were performed for MDD and control groups separately, and
Mean 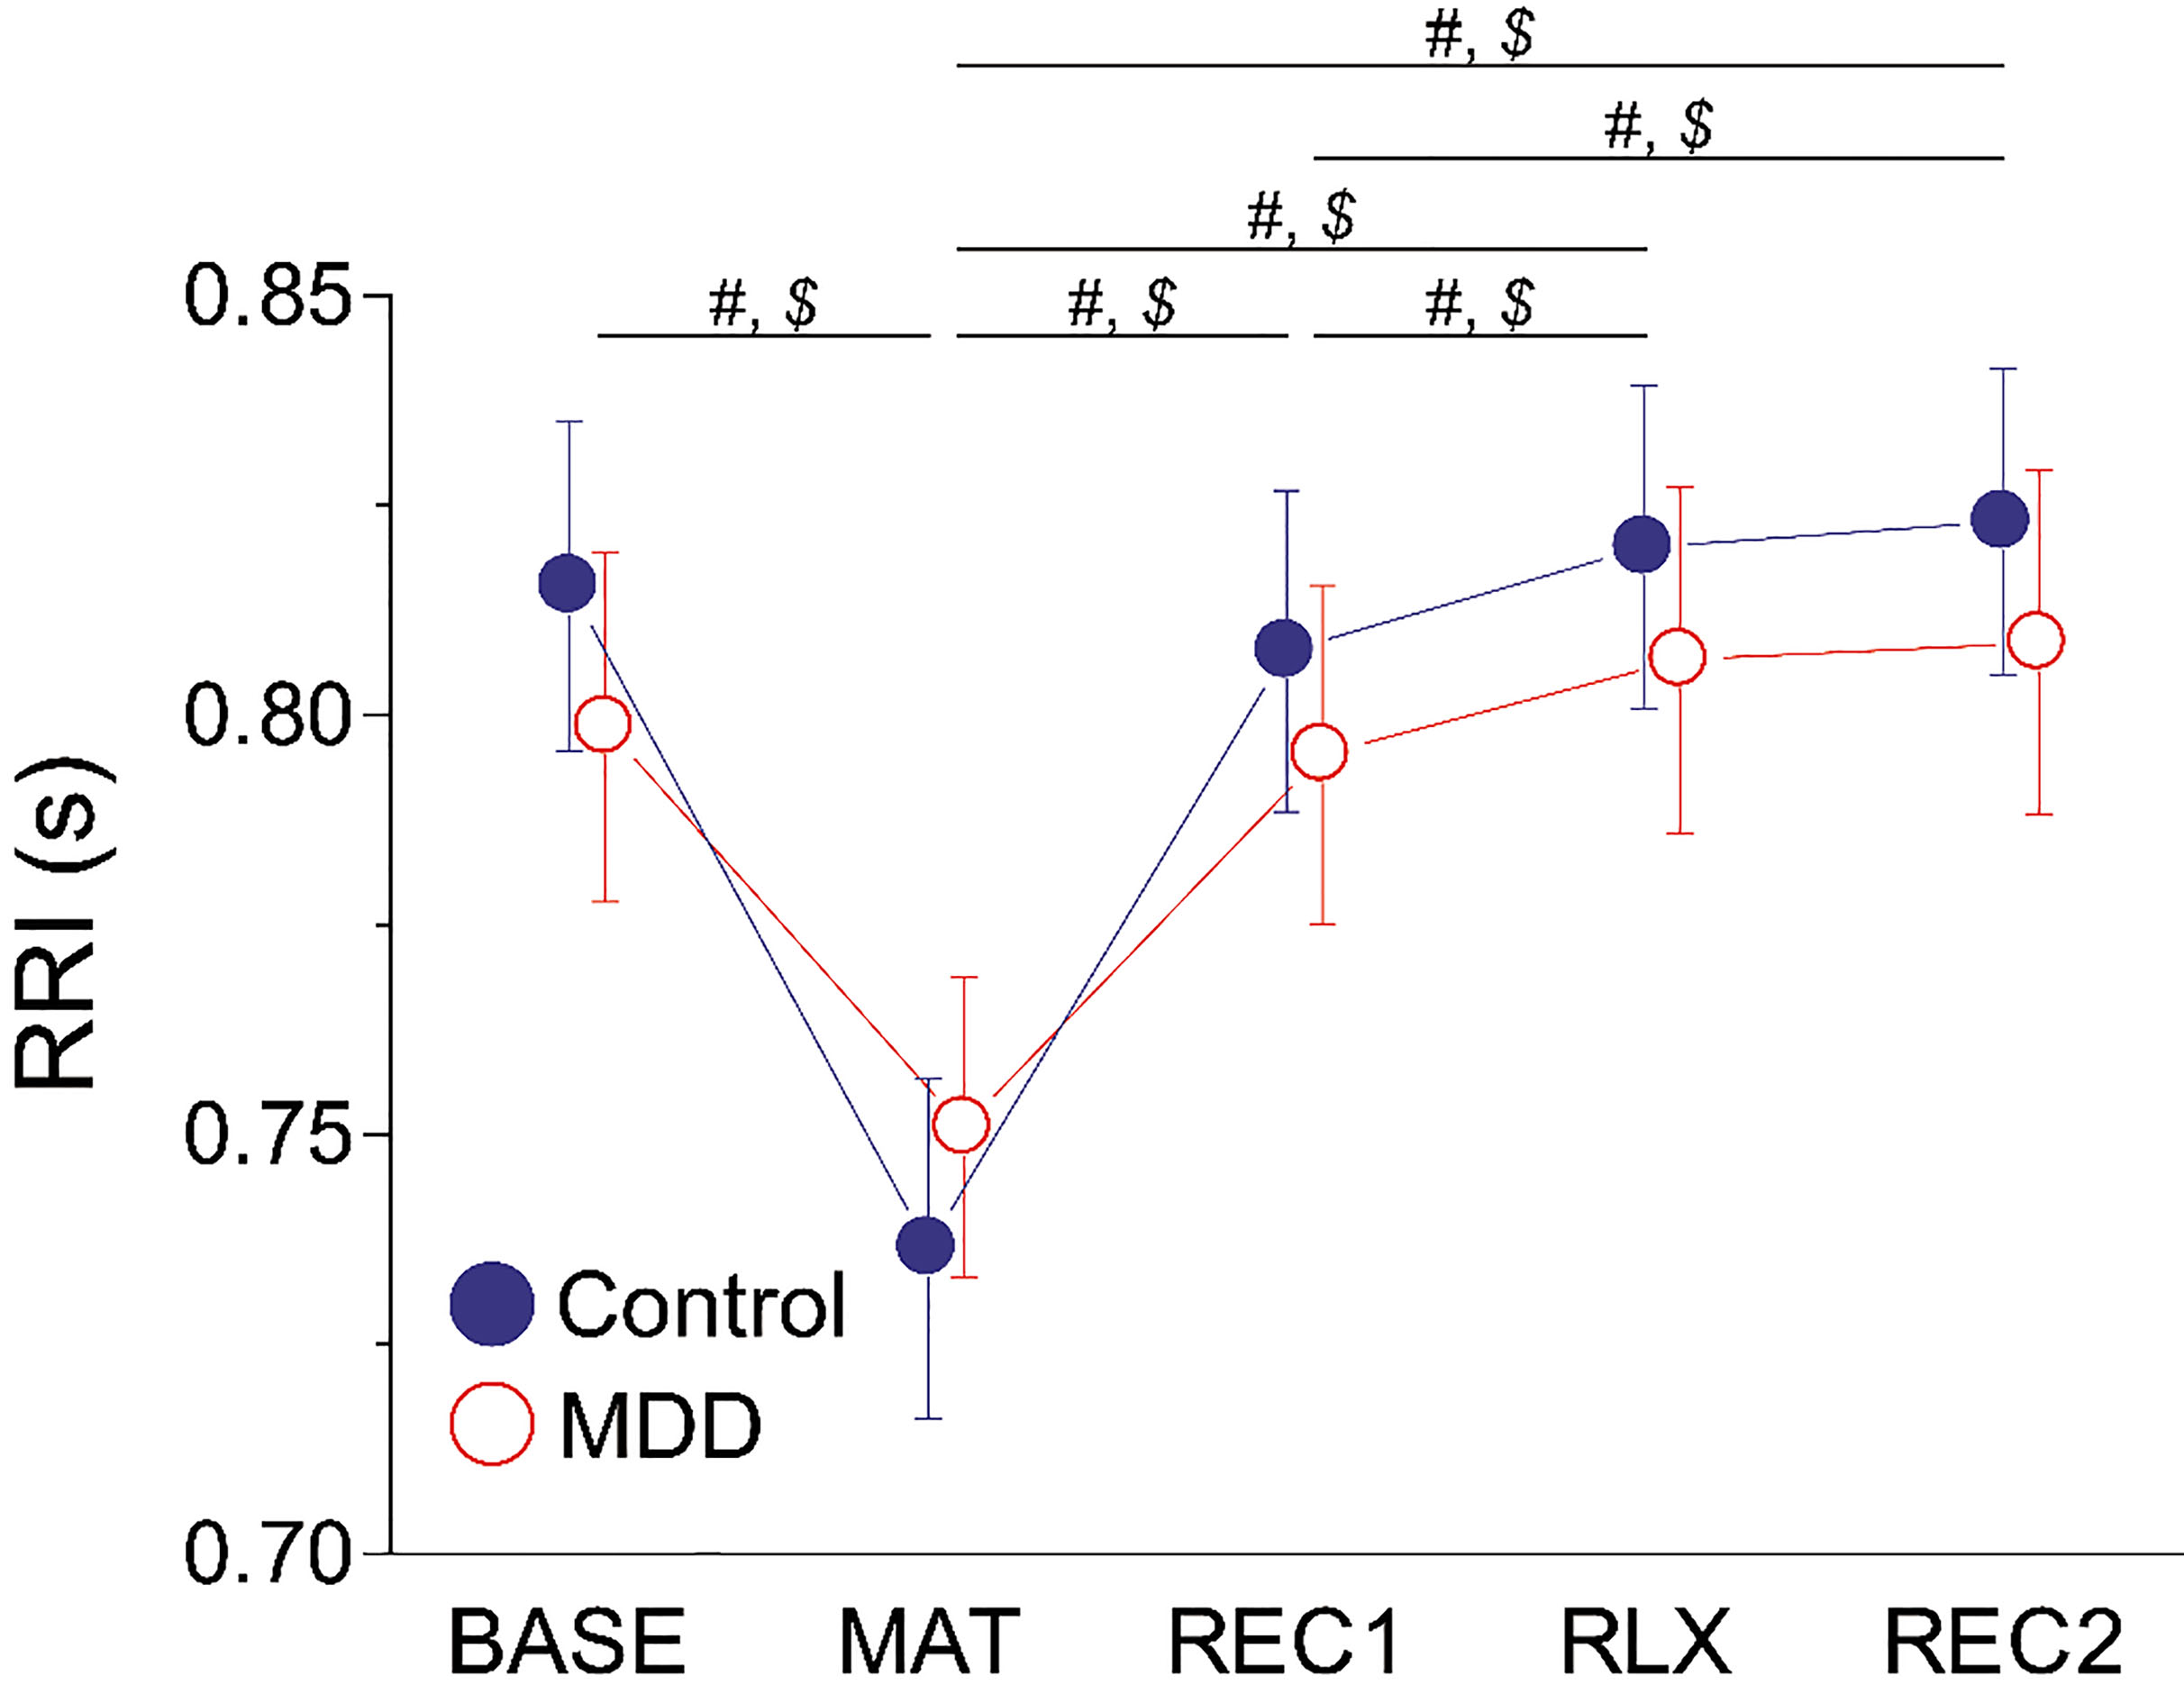
We examined the influence of group and task on RRI to understand the effects of the MDD and our experimental protocol on the autonomic activity of the participants. The RRI changes during measurement are shown in Fig. 3. We used a repeated-measures ANOVA to statistically test the effects of group and task (Table 2). The main effect of group was non-significant, but significant main effects of task (
Mean (SD) values of ApEn, SampEn, FuzzEn, and ShanEn measured during each phase in control (
33) and MDD groups (
33)
Mean (SD) values of ApEn, SampEn, FuzzEn, and ShanEn measured during each phase in control (
Mean 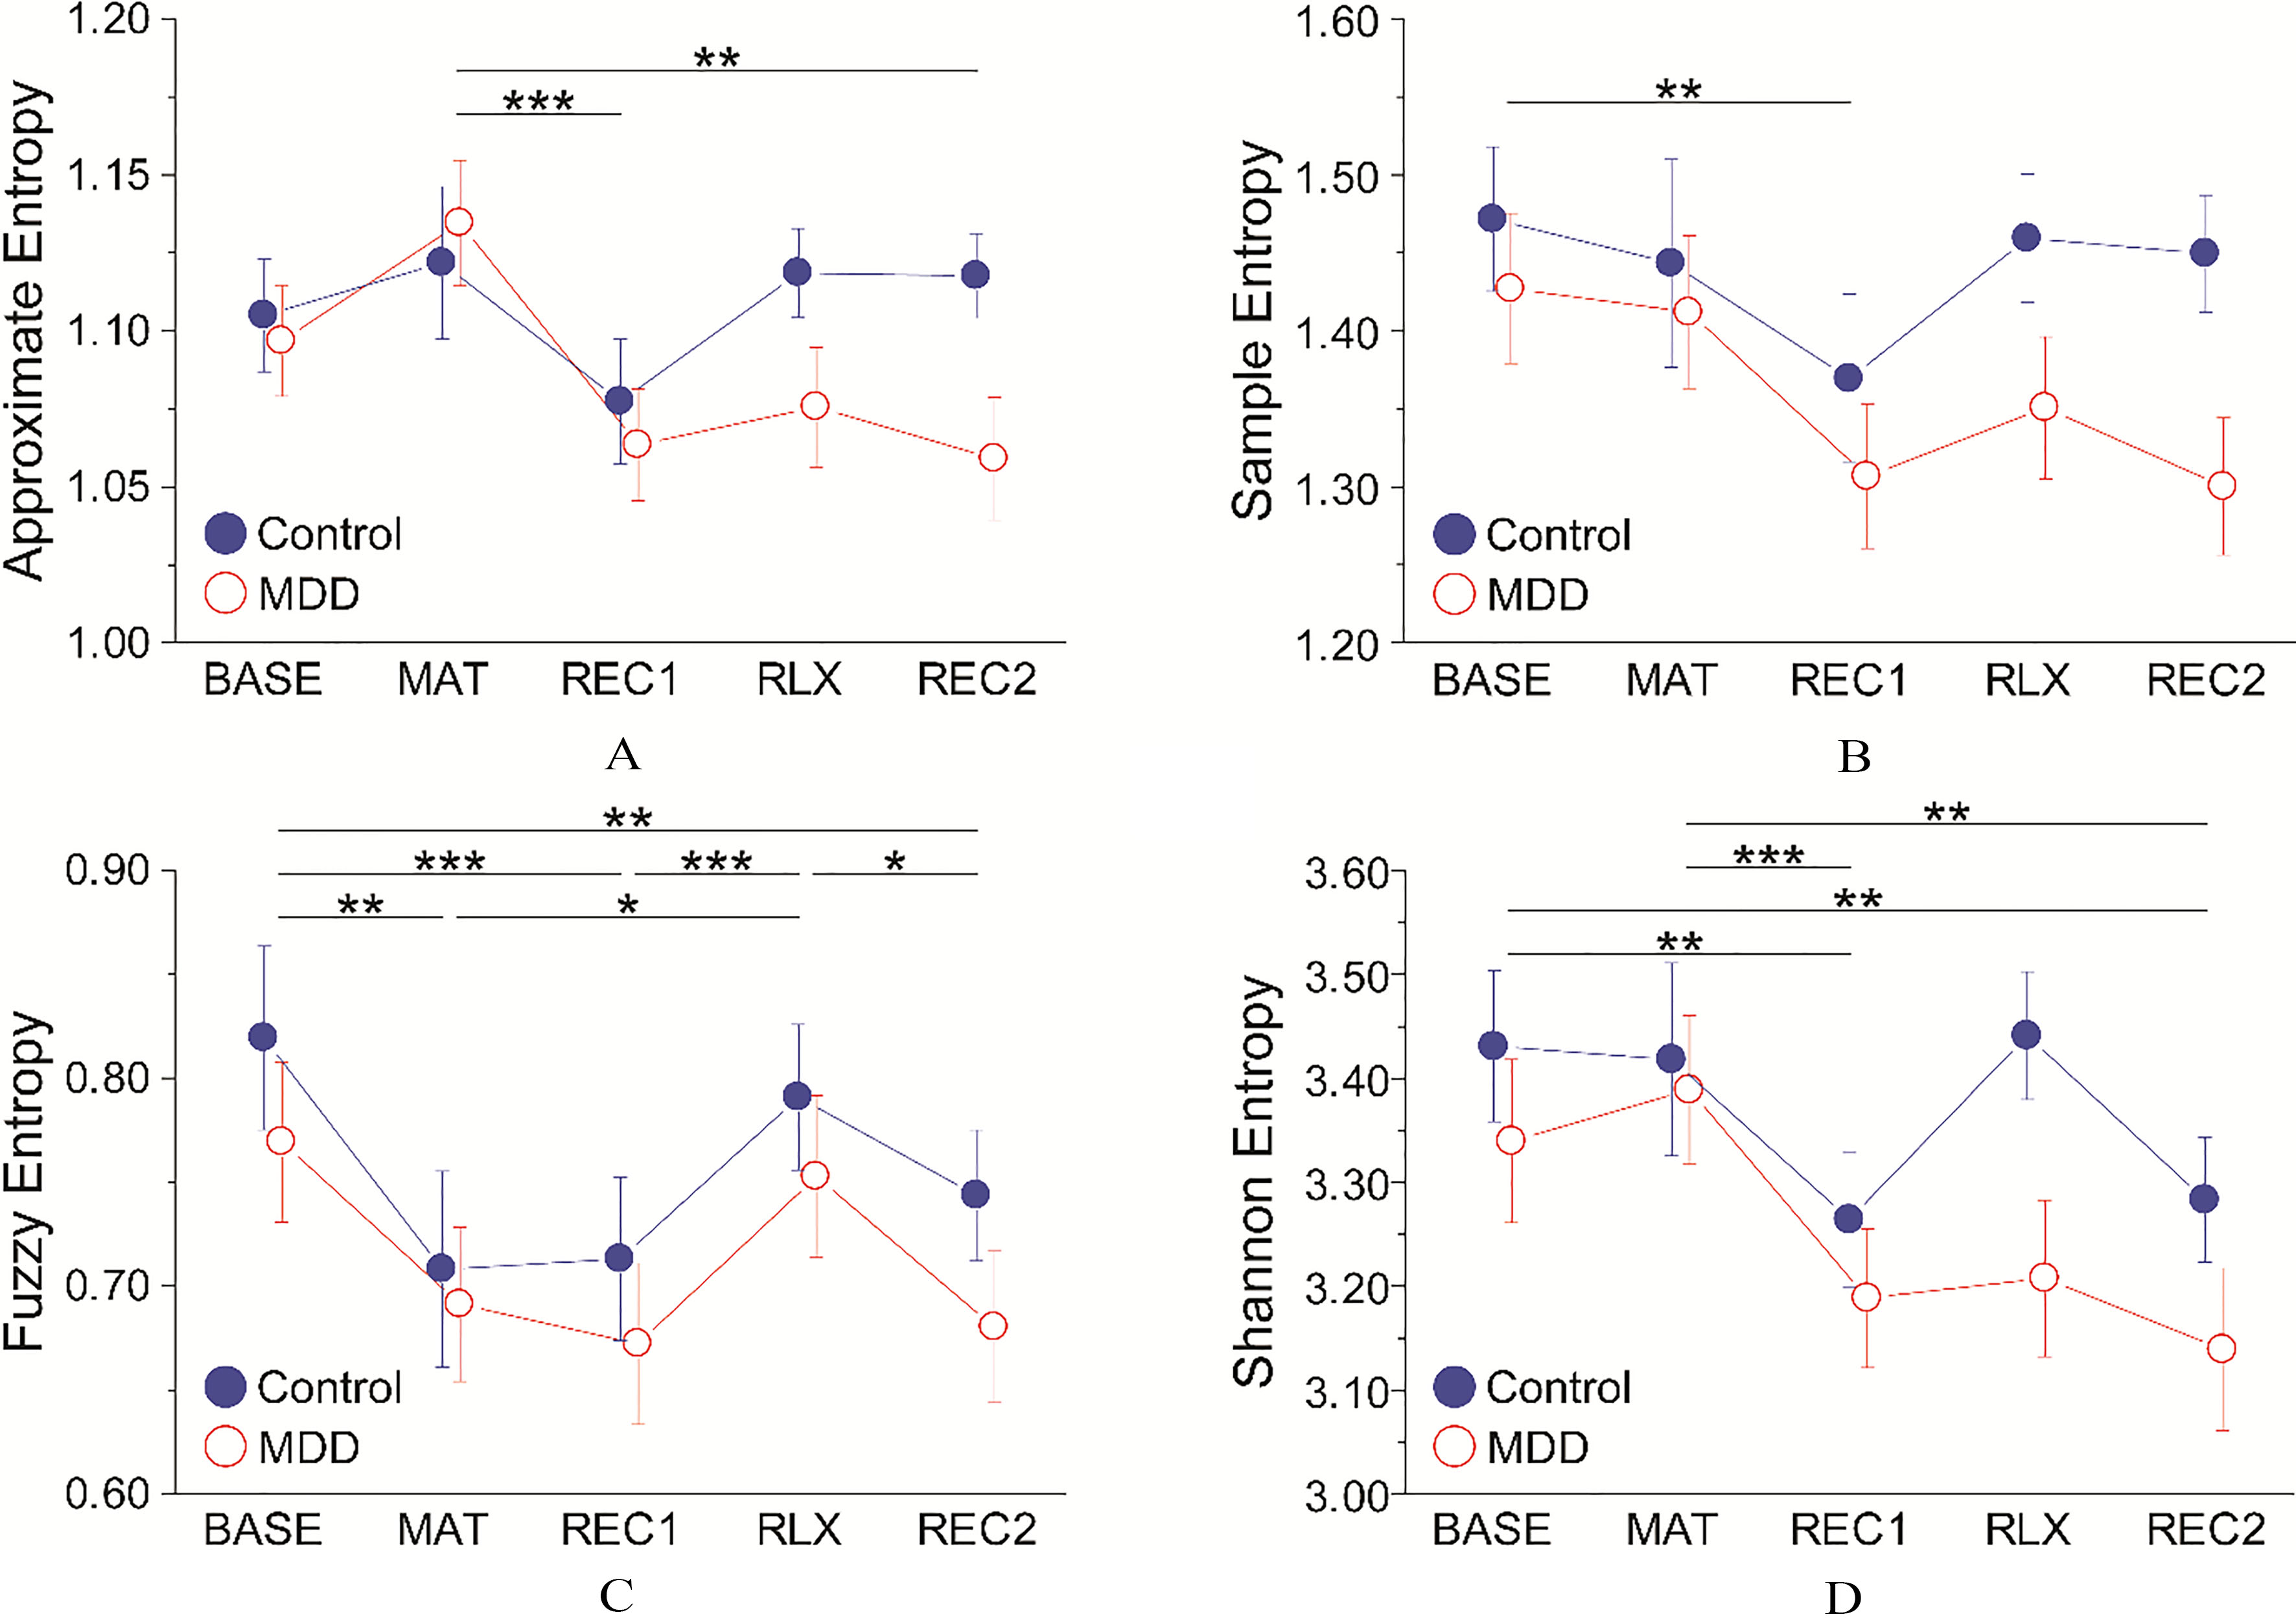
A. Effects of group and task on entropy. Statistical analyses for SampEn and FuzzEn were performed with a repeated-measures ANOVA. Statistical analyses for ApEn and ShanEn were performed with the non-parametric equivalent of a repeated-measures ANOVA using the R statistics package “nparLD”. B. Post-hoc pairwise comparisons between tasks were corrected using the Bonferroni method (
Similar to the RRI, we tested the effects of group and task on each entropy measure. The ApEn, SampEn, FuzzEn, and ShanEn changes during measurement are presented in Fig. 4 and Table 3. SampEn and FuzzEn were tested with repeated-measures ANOVA. However, we used the non-parametric equivalent of a repeated-measures ANOVA for ApEn and ShanEn, as they violated the normality assumption (for further details, see the Methods). All four entropy features were significantly affected by the main effect of task (Table 4). However, there were no significant effects of group or interaction on any entropy measures. Pairwise comparisons between tasks revealed the following (Table 4): ApEn was significantly higher during MAT than in REC1 and REC2. SampEn was reduced significantly during REC1 compared to BASE. The BASE FuzzEn was significantly higher than those for MAT, REC1, and REC2. The RLX FuzzEn was significantly higher than those for MAT, REC1, and REC2. The BASE ShanEn was significantly higher than those for REC1 and REC2. The MAT ShanEn was significantly higher than those for REC1 and REC2.
Classification of control and MDD participants using entropy features
Four supervised machine learning algorithms (SVM, LDA, k-NN, and NB) were implemented to classify healthy and MDD participants using a total of 20 entropy features (i.e., four entropy features from five phases) as input data. SVM-RFE performed feature selection The performance of classification were evaluated using the LOO procedure, as shown in Fig. 2.
Figure 5 shows the prediction accuracy as a function of the number of features selected by the SVM-RFE method. The best performance results for each classifier are summarized in Table 5. SVM outperformed the LDA, k-NN, and NB classifiers and achieved 70% accuracy, 64% sensitivity, and 76% specificity using the three most relevant features. The best performance measures of LDA were similar to those of SVM, and were also based on the same three optimal features. The k-NN accuracy peaked with the first feature, but use of additional features did not yield better performance. The NB classifier required nine relevant features to achieve 67% accuracy. When all 20 features were utilized for classification, the SVM, LDA, k-NN, and NB models achieved only 50%, 42%, 39%, and 59% accuracy, respectively, indicating that the feature selection substantially improved performance of the classifiers.
Best performance of each classifier
Best performance of each classifier
Average ranks of 20 entropy measures determined by SVM-RFE
Average accuracy as function of number of selected features. The features were ranked by SVM-RFE.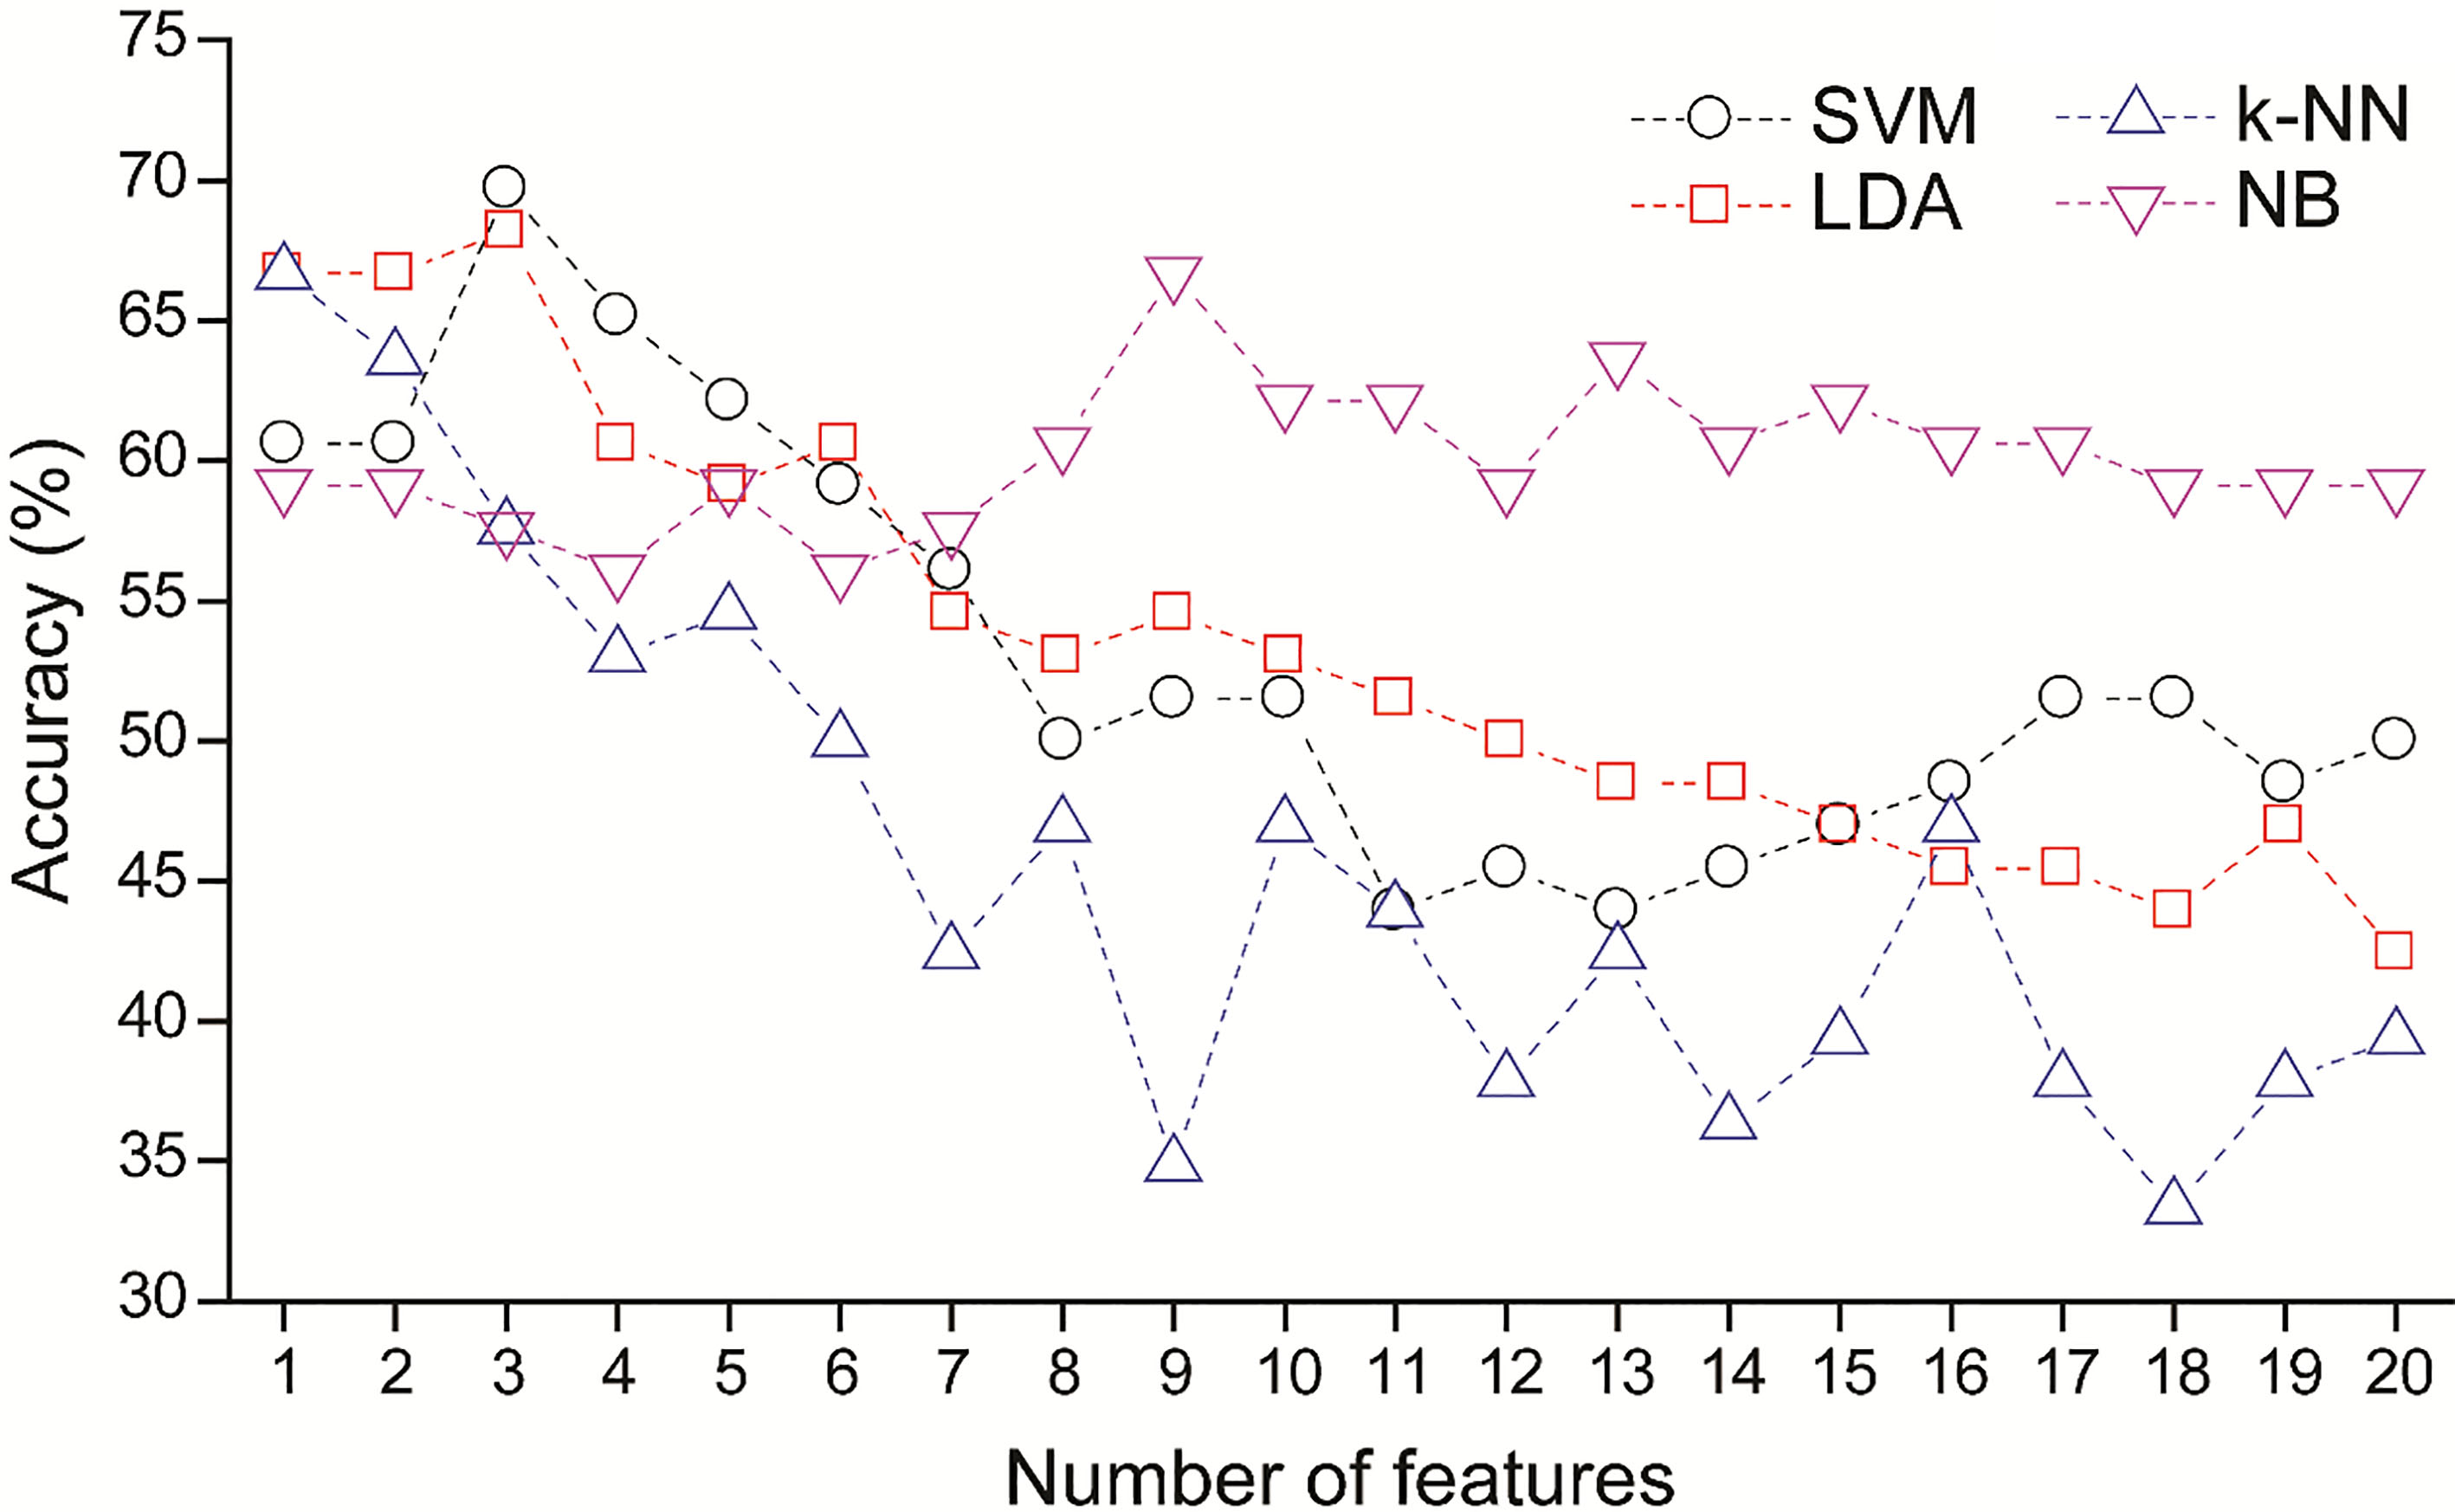
The average ranks of the 20 entropy features are listed in Table 6. These ranks were computed by SVM-RFE during the LOO procedure. The most relevant feature was SampEn from REC2, followed by FuzzEn from REC2, ShanEn from RLX, ApEn from RLX, and FuzzEn from BASE.
We have demonstrated differentiation of patients with MDD from healthy controls with 70% accuracy, 64% sensitivity, and 76% specificity, using the three most relevant entropy features. To the best of our knowledge, the present study is the first to classify MDD patients and healthy controls using only HRV entropy features. The feature ranking determined by SVM-RFE revealed that the features extracted from the REC2 and RLX phases were highly relevant, suggesting that the entropy measured when a subject is experiencing autonomic stress and recovery can improve the discriminative power of HRV entropy features.
First, we examined whether our experimental protocol induced multiple alterations in the ANS activities of participants during measurements (Fig. 3 and Table 2). The significant decrease in RRI during the MAT phase observed in this study suggests that the mental stress task successfully induced increased sympathetic activity. The participants recovered from this stress during the first recovery (REC1), as indicated by a significant difference in RRI between the MAT and REC1 phases. Interestingly, the RRI values increased significantly in the RLX and REC2 phases compared to the REC1 phase. These results suggest that REC1 was not sufficiently long for the participants to fully recover from the mental stress and, also, that the participants further recovered during the relaxation task (RLX) and the second recovery (REC2).
Previous studies have generally shown that entropy features are significantly reduced in MDD patients compared to healthy participants [38, 39, 40]. Conflicting results have also been reported, for which no significant differences in ApEn and SampEn were obtained for MDD and control groups [72, 73, 74]. In this study, mean values of entropy features were lower in the MDD group than in the control group except for the ApEn from MAT (Table 3). However, there were no significant differences in entropy features between the control and patient groups (Table 4). This inconsistency is likely a result of the heterogeneous presentation and multifactorial etiology of MDD, which substantially increase variability in the assessment of ANS activity [75].
Our experimental tasks affected the entropy features, but the entropy responded differently than the RRI (Fig. 4 and Table 4). For example, the RRI was significantly reduced during the stress task compared with the baseline, before recovering during the subsequent phases. However, the entropy continued to decrease and did not recover in REC1, suggesting that entropy features (but not RRI) may reflect prolonged sympathetic excitation in the recovery phase. In addition, although the mean RRI values were higher in REC2 than in RLX, the entropy features were lower in REC2 than in RLX. FuzzEn and ShanEn were significantly decreased in REC2 compared to BASE, indicating that they did not achieve full recovery to the initial values, unlike the RRI values. Similar to the RRI, SampEn and FuzzEn were lower in MAT than in BASE. Mental stress typically induces a decrease in HRV complexity, including entropy features [76, 77, 78]. The entropy was increased in the RLX phase, indicating that the relaxation task induced vagal activity. These results suggest that the entropy features used in the present study could reflect changes in the balance between sympathetic and parasympathetic cardiac modulation during our experimental protocol, as demonstrated by a previous study [76].
Based on these entropy features, we achieved 70% accuracy in differentiating the patients with MDD using the SVM classifier (Table 5). The feature selection substantially improved the performance of all classifiers. For example, the SVM classifier accuracy was 50% when all features were used, but increased to 70% when the three most relevant features were used (Fig. 5). The top three most relevant features were from REC2 and RLX (Table 6), suggesting that observation of the baseline ANS activity may not be ideal for distinguishing MDD patients from the healthy population. Similarly, Schumann et al. suggested that the resting HRV evaluates cardiac vagal modulation only, and lacks information on sympathetic modulation [79]. The most relevant feature in the present study was SampEn from REC2. FuzzEn from REC2 and ShanEn from RLX ranked second and third, respectively. Interestingly, the difference in SampEn between the MDD and control groups increased after the MAT phase and showed the largest gap in REC2 (Fig. 4 and Table 3). A similar trend was observed for the other entropy features. For FuzzEn and ShanEn, the differences between the two groups were larger in REC1, RLX, and REC2 compared to MAT. A previous study demonstrated that patients with MDD exhibit reduced autonomic recovery from laboratory stress [49]. This may explain the growing entropy difference between the MDD and control groups after the stress task. Therefore, our feature selection results suggest that analyzing HRV entropy in response to autonomic stimuli and recovery from those stimuli may reflect differences in ANS reactivity between MDD and control subjects. In previous studies on HRV-based classification of depressive symptoms, various autonomic stimuli were also adopted during HRV measurements, such as emotion elicitation [31], random number generation [33], and Ewing tests [34]. This approach revealed the disrupted autonomic cardiac control in depressed patients.
A relatively small number of subjects (MDD
Conclusion
We have found that ANS stimulation during measurement was crucial for revealing an altered heartbeat regulation of depressed patients, as these characteristics were not manifested in the baseline activity. In particular, the differences in the entropy features between the MDD and control groups increased after the stress phase and showed the largest gap in the final recovery phase. Similarly, the feature ranking from the SVM-RFE suggests that the HRV features from the relaxation and the last recovery phases are most relevant in classifying the MDD and control groups. Unlike the RRI, reduced HRV entropy due to mental stress did not recover, suggesting that entropy features may reflect prolonged sympathetic excitation in the recovery phase. This finding suggests that monitoring of HRV complexity changes when a subject is experiencing autonomic arousal and recovery can potentially allow higher-accuracy depressive symptom recognition. Future works can also examine patients with other medical conditions which elicit similar symptoms to those of the MDD, such as dementia [83].
Footnotes
Acknowledgments
This work was supported by the National Research Foundation of Korea (NRF) grant funded by the Korea government (MSIT) (No. 2017R1C1B5017730) and the Institute for Information and Communications Technology Promotion (IITP) grant funded by the Korea government (MSIT) (No. 2015-0-00062, The development of skin adhesive patches for the monitoring and prediction of mental disorders). This research was furthermore supported by the Original Technology Research Program for Brain Science through the National Research Foundation of Korea (NRF) funded by the Ministry of Science and ICT (No. NRF-2016M3C7A1947307; PI HJJ), and the Bio and Medical Technology Development Program of the NRF funded by the Korean government, MSIP (No. NRF-2017M3A9F1027323; PI HJJ).
Conflict of interest
The authors declare that they have no competing interests.