
Abstract
BACKGROUND:
Minimally invasive total knee arthroplasty (TKA) has been actively advertised by the orthopedic industry. The purpose of this network meta-analysis was to comprehensively compare the effectiveness of four minimally invasive surgery (MIS) approaches and the medial parapatellar (MPP) approach to improve the American Knee Society Score (KSS) in primary TKA.
MATERIALS AND METHODS:
Studies were comprehensively searched on PubMed, Embase, Cochrane Library (CENTRAL), Web of Science and Science Direct up to June 2018 with a major focus on the outcome of KSS. Risk of bias was assessed using the Cochrane risk of bias tool. Quality assessment was performed using the GRADE system. Both pair-wise and network meta-analyses are calculated to comprehensively compare the effectiveness of four MIS and TKA approaches.
RESULTS:
Eleven trials with 1025 knees undergoing TKA were included. Our analysis showed that both MPP and MIS approaches provided improvement in terms of short-term (four-eight weeks) total, objective and functional KSS. The network-meta analysis revealed that MIS approaches showed a trend towards superior KSS improvement over standard MPP approaches. However, statistical advantages were only observed in the mini-MPP group for functional KSS compared to the conventional MPP and quadriceps-sparing (QS) groups.
CONCLUSIONS:
Evidence shows that MIS TKA approaches are effective alternatives to MPP approaches. However, orthopedic surgeons should be cautiously optimistic about minimally invasive TKA in terms of KSS improvement.
Keywords
Introduction
Total knee arthroplasty (TKA) is considered to be the optimal surgical method to treat advanced osteoarthritis for excellent alleviation of pain, restoration of joint function and improvement in life quality. As the most popular surgical approach in primary TKA, the medial parapatellar (MPP) approach offers excellent operative visualization at the sacrifice of peripatellar blood supply, quadriceps tendon and medial portion of the quadriceps muscle. This might lead to avascular necrosis, anterior knee pain as well as extensor mechanism weakening and thus functional outcomes remain a concern.
Minimally invasive surgery (MIS) has been promoted for quicker rehabilitation and shorter hospitalization. Until now, four MIS approaches have been well documented, including mini-medial parapatellar (mini-MPP), mini-midvastus (mini-MV), mini-subvastus (mini-SV) and quadriceps-sparing (QS). Although technically demanding, proponents of MIS surgery state improved cosmetic appeal, decreased postoperative pain, accelerated recovery as measured by quadriceps function, better early range of motion (ROM), and better cost savings as advantages in comparison to the standard TKA approach [1, 2, 3, 4]. Possible problems with the surgical technique include its steep surgical learning curve, longer operative time, compromised surgical exposure, technical errors (e.g. fracture or component malposition), and neurovascular damage [5, 6, 7, 8, 9, 10, 11]. Several authors expressed concerns that MIS approaches may lead to component misalignment [12] and perioperative complications such as local wound-related problems, deep venous thrombosis (DVT) and pulmonary embolism (PE) [13, 14, 15].
Recent studies revealed that the MPP approach has comparative clinical results as MIS approaches. Recently, comparative studies have migrated from MIS procedures versus MPP procedure to comparisons between MIS approaches and thus more well-designed randomized controlled trials (RCTs) have been published. Therefore, we conducted a Bayesian network meta-analysis to compare the effectiveness of four MIS approaches as well as the standard MPP approach for the improvement of short-term (four-eight weeks) total, objective and functional Knee Society Score (KSS).
Materials and methods
Inclusion and exclusion criteria
For our analysis, we included properly designed RCTs evaluating the effects of minimally invasive approaches for TKA. To guarantee the quality of this review, we adopted a rigorous standard for the included studies. We required that the included studies adequately describe the method of randomization. Non-RCTs, abstract-only papers, and RCT protocols were excluded. We included RCT studies that described adult participants (age
Search strategy
PubMed, Embase, Cochrane Library (CENTRAL), Web of Science and Science Direct were searched up to June 2018. The following keywords were used to search the databases: arthroplasty, replacement, knee, knee prosthesis, knee replacement arthroplasty, total knee arthroplasty, total knee, TKA, mini-MV, mini-midvastus, mini-subvastus, mini-medial parapatellar, quadriceps-sparing, minimally invasive surgical procedures, minimal access surgical procedures, minimal surgical procedure with the limitation of RCTs (Appendix 1). The Preferred Reporting Items for Systematic Review and Meta-Analyses (PRISMA) [16] methodology guidance was employed. To avoid the potential omission of studies, we searched additional databases for gray literature. In addition, to guarantee literature saturation, we also scanned the relevant trials enrolled by previous systematic reviews and meta-analyses related to TKA. We applied no language restrictions to our database searches.
Study selection
Two independent reviewers (LZ and XL) independently reviewed the titles and abstracts of all the literature retrieved by the search. Duplications were removed using Endnote X7 (Thomson Reuters Co., New York, USA). Full-text articles were obtained and examined if necessary. Then, the reviewers followed the eligibility criteria to select potentially relevant studies. If a disagreement occurred regarding the inclusion or exclusion of a study, then a third reviewer was consulted.
Data extraction and quality assessment
Two reviewers (LZ and XL) independently extracted the data using a pre-designed extraction form, consisting of surgical approach, components description, follow-up duration, male/female patient rate, average years, BMI and outcome measures. Next, the data were integrated. Discrepancies between the results were largely resolved through discussions; however, a third reviewer was consulted if an agreement could not be reached. The outcomes were change in total KSS, functional KSS and objective KSS scores.
Two reviewers (LZ and XL) independently evaluated the quality of the trials. The Cochrane Collaboration tool (Review Manager, V.5.2; Revman, Copenhagen, Denmark: The Nordic Cochrane Centre, The Cochrane Collaboration) was used to evaluate the risk of bias in the included RCTs. This tool covers the following domains: random sequence generation, allocation concealment, blinding, incomplete outcome data, selective reporting, and other bias.
After all outcomes were evaluated and a table summarizing the findings was created using the GRADE system [17], following the four-step approach to rate the quality of evidence in each of the direct and mixed estimates based on methods developed by the GRADE working group [18, 19].
Statistical analysis
First, a pair-wise meta-analysis was performed using random effects models. Every pair of studies with the same treatments was calculated. Next, the results were reported as the mean difference (MD) with a corresponding 95% confidence interval (CI), in addition to the number of pairs of studies. These statistical analyses were performed using STATA with the metan package (version 14.0; Stata Corporation, College Station, Texas, USA).
Second, random effects network models were developed within a Bayesian framework using the Markov Chain Monte Carlo (MCMC) algorithm in WinBUGS (Bayesian inference Using Gibbs Sampling for Windows, version 1.4.3; Imperial College and MRC, UK) [20]. The model was based on Markov chains for 100,000 iterations after a burn-in of 50,000. A thinning interval of 10 was applied, which meant collecting one sample every 10 iterations. Consequently, 30,000 samples were obtained for each parameter. In this process, the Brooks-Gelman-Rubin method was used to assess the convergence between direct and indirect variances [21]. According to the theory of Brooks and Gelman, if the result of the Potential Scale Reduction Factor (PSRF) is close to or equal to 1, convergence has been reached. This result was also presented by MD, with a 95% CI. If the null value was not included in the 95% CI of the MD, a statistically significant difference was indicated. The rank probability for each treatment was estimated by WinBUGS, and the data were then imported into STATA. Next, plots of the surface under the cumulative ranking curves (SUCRA) were generated [22]. The value of the SUCRA was presented as the percentage of the area under the curve: 100% indicates the best treatment, and 0% indicates the worst treatment. Placebo compared with other treatments was always considered and were thus presented. The network order in STATA was used to plot the MDs and 95% CIs in these three different follow-up durations.
Inconsistency analysis
If there was a ‘loop’ (e.g., A-B-C) in the network, each comparison in the loop (e.g., A-B) might have an indirect result from the other comparisons (e.g., A-C and C-B); consequently, the direct and indirect result may be different. The inconsistency of the model was assessed by the node-splitting method [23]. If the p-value was smaller than 0.05, an inconsistency was considered to be detected. The node-splitting models were generated by the gemtc package (version 0.6-1,
Sensitivity analysis and meta-regression
For testing the influence of low-quality studies, a sensitivity analysis was conducted after excluding them. We recalculated the network result with the rank probability. If no significant difference occurred, the outcome of the NMA was considered valid.
Furthermore, meta-regression was used to test the relationship between the sample size and treatment effect. As recommended by the UK’s National Institute for Health and Care Excellence, a single interaction term was used as the covariate [25]. The deviance information criterion (DIC) [26] was used as the measurement of model fit. Thus, a lower DIC value suggested a more parsimonious model. If the reduction of DIC was less than 3, the covariate was not considered to be associated with the result. Additionally, a regression parameter named coefficient was calculated. If the null was in the 95% CI of the parameter, the association was not supported. Graphs were prepared using Sigmaplot 10.0.
Results
Eligible studies
Our search strategy yielded 856 potentially relevant articles. After carefully screening the titles and abstracts, 56 potentially eligible articles were obtained. After a careful full-text screening, 45 articles were discarded for the reasons listed in Fig. 1. Eleven RCTs met the inclusion criteria.
PRISMA 2009 flow diagram.
The quantification of the risk of bias for the included RCTs were generated by Revman and presented in Fig. 2 All of these studies were described as “randomized”. The generation of a random sequence was detailed in six reports and the allocations were only properly concealed in four of the articles. In addition, the detection bias was unclear, because there was insufficient information about the methods used to conceal the allocation in 10 of the studies.
Risk of bias graph (upper) and summary (lower).
The characteristics of the included trials are presented in Table 1. Eleven trials with 1025 knees were included. The network for total, objective and function KSS included six, nine, and eight studies, respectively. The total numbers of participants in these studies were 385 895, and 761, respectively.
Estimates of effects and quality ratings
The results of the GRADE evaluation of interventions are presented in Appendix 2. All the reasons for downgrading are labeled. Because the design of the inclusion criteria was rigid, there was no obvious nontransitivity. Due to the inconsistency and imprecision, the confidence of the evidence of total, objective and function KSS results was low or very low.
Network of comparisons
Three comprehensive network plots were built using STATA (Fig. 3). The size of the circle represents the number of participants, and the thickness of the edge represents the number of studies.
Network for the comparison of the five approaches. MPP, medial parapatellar; MV, midvastus; SV, subvastus; QS, quadriceps-sparing.
All data were imported into STATA, and direct comparisons were made using metan with a random-effects model. The MDs and 95% CIs were calculated. The results are listed in the lower-left triangle of Table 2 (A, B, C, respectively) and Appendix 3.
Characteristics of the included studies
Characteristics of the included studies
KSS, Knee Society Score; MPP, medial parapatellar; MV, midvastus; QS, quadriceps-sparing; SV, subvastus; TKA, total knee arthroplasty.
Results of the pair-wise and network meta-analysis (mean difference, with 95% confidence interval)
a. Upper-right triangle presents the findings (MDs with 95% CI) of the network meta-analysis conducted using WinBUGS 1.4.3. b. Lower-left triangle presents the findings (MDs with 95% CrI) of the pairwise meta-analyses conducted using STATA 14 and N refers to the numbers of RCTs which compared the two interventions directly. c. A positive MD favors the lower-right intervention, a negative MD favours the upper-left intervention. d. Statistically significant findings are presented as bold and underlined values. MPP, medial parapatellar; MV, midvastus; QS, quadriceps-sparing; SV, subvastus.
In terms of total KSS score, mini-SV and QS conferred greater (but not significant) improvement than the standard MPP approach at four to eight weeks (MD
In terms of objective and function score, all mini approaches showed better (but not significant) improvement than standard MPP. Notably, QS showed an equal improvement as standard MPP approach for mini-MPP. Moreover, although mini-MPP did not show a significantly better improvement compared with QS in objective score, it demonstrated significantly greater improvement (MD
Forest plot of network meta-analysis of all treatments for KSS improvement. MPP, medial parapatellar; MV, midvastus; QS, quadriceps-sparing; SV, subvastus.
Surface under the cumulative ranking curve (SUCRA) of the five approaches. The area under the curve represents the cumulative rank probability of each treatment. The larger the area, the better the cumulative rank probability. MPP, medial parapatellar; MV, midvastus; QS, quadriceps-sparing; SV, subvastus.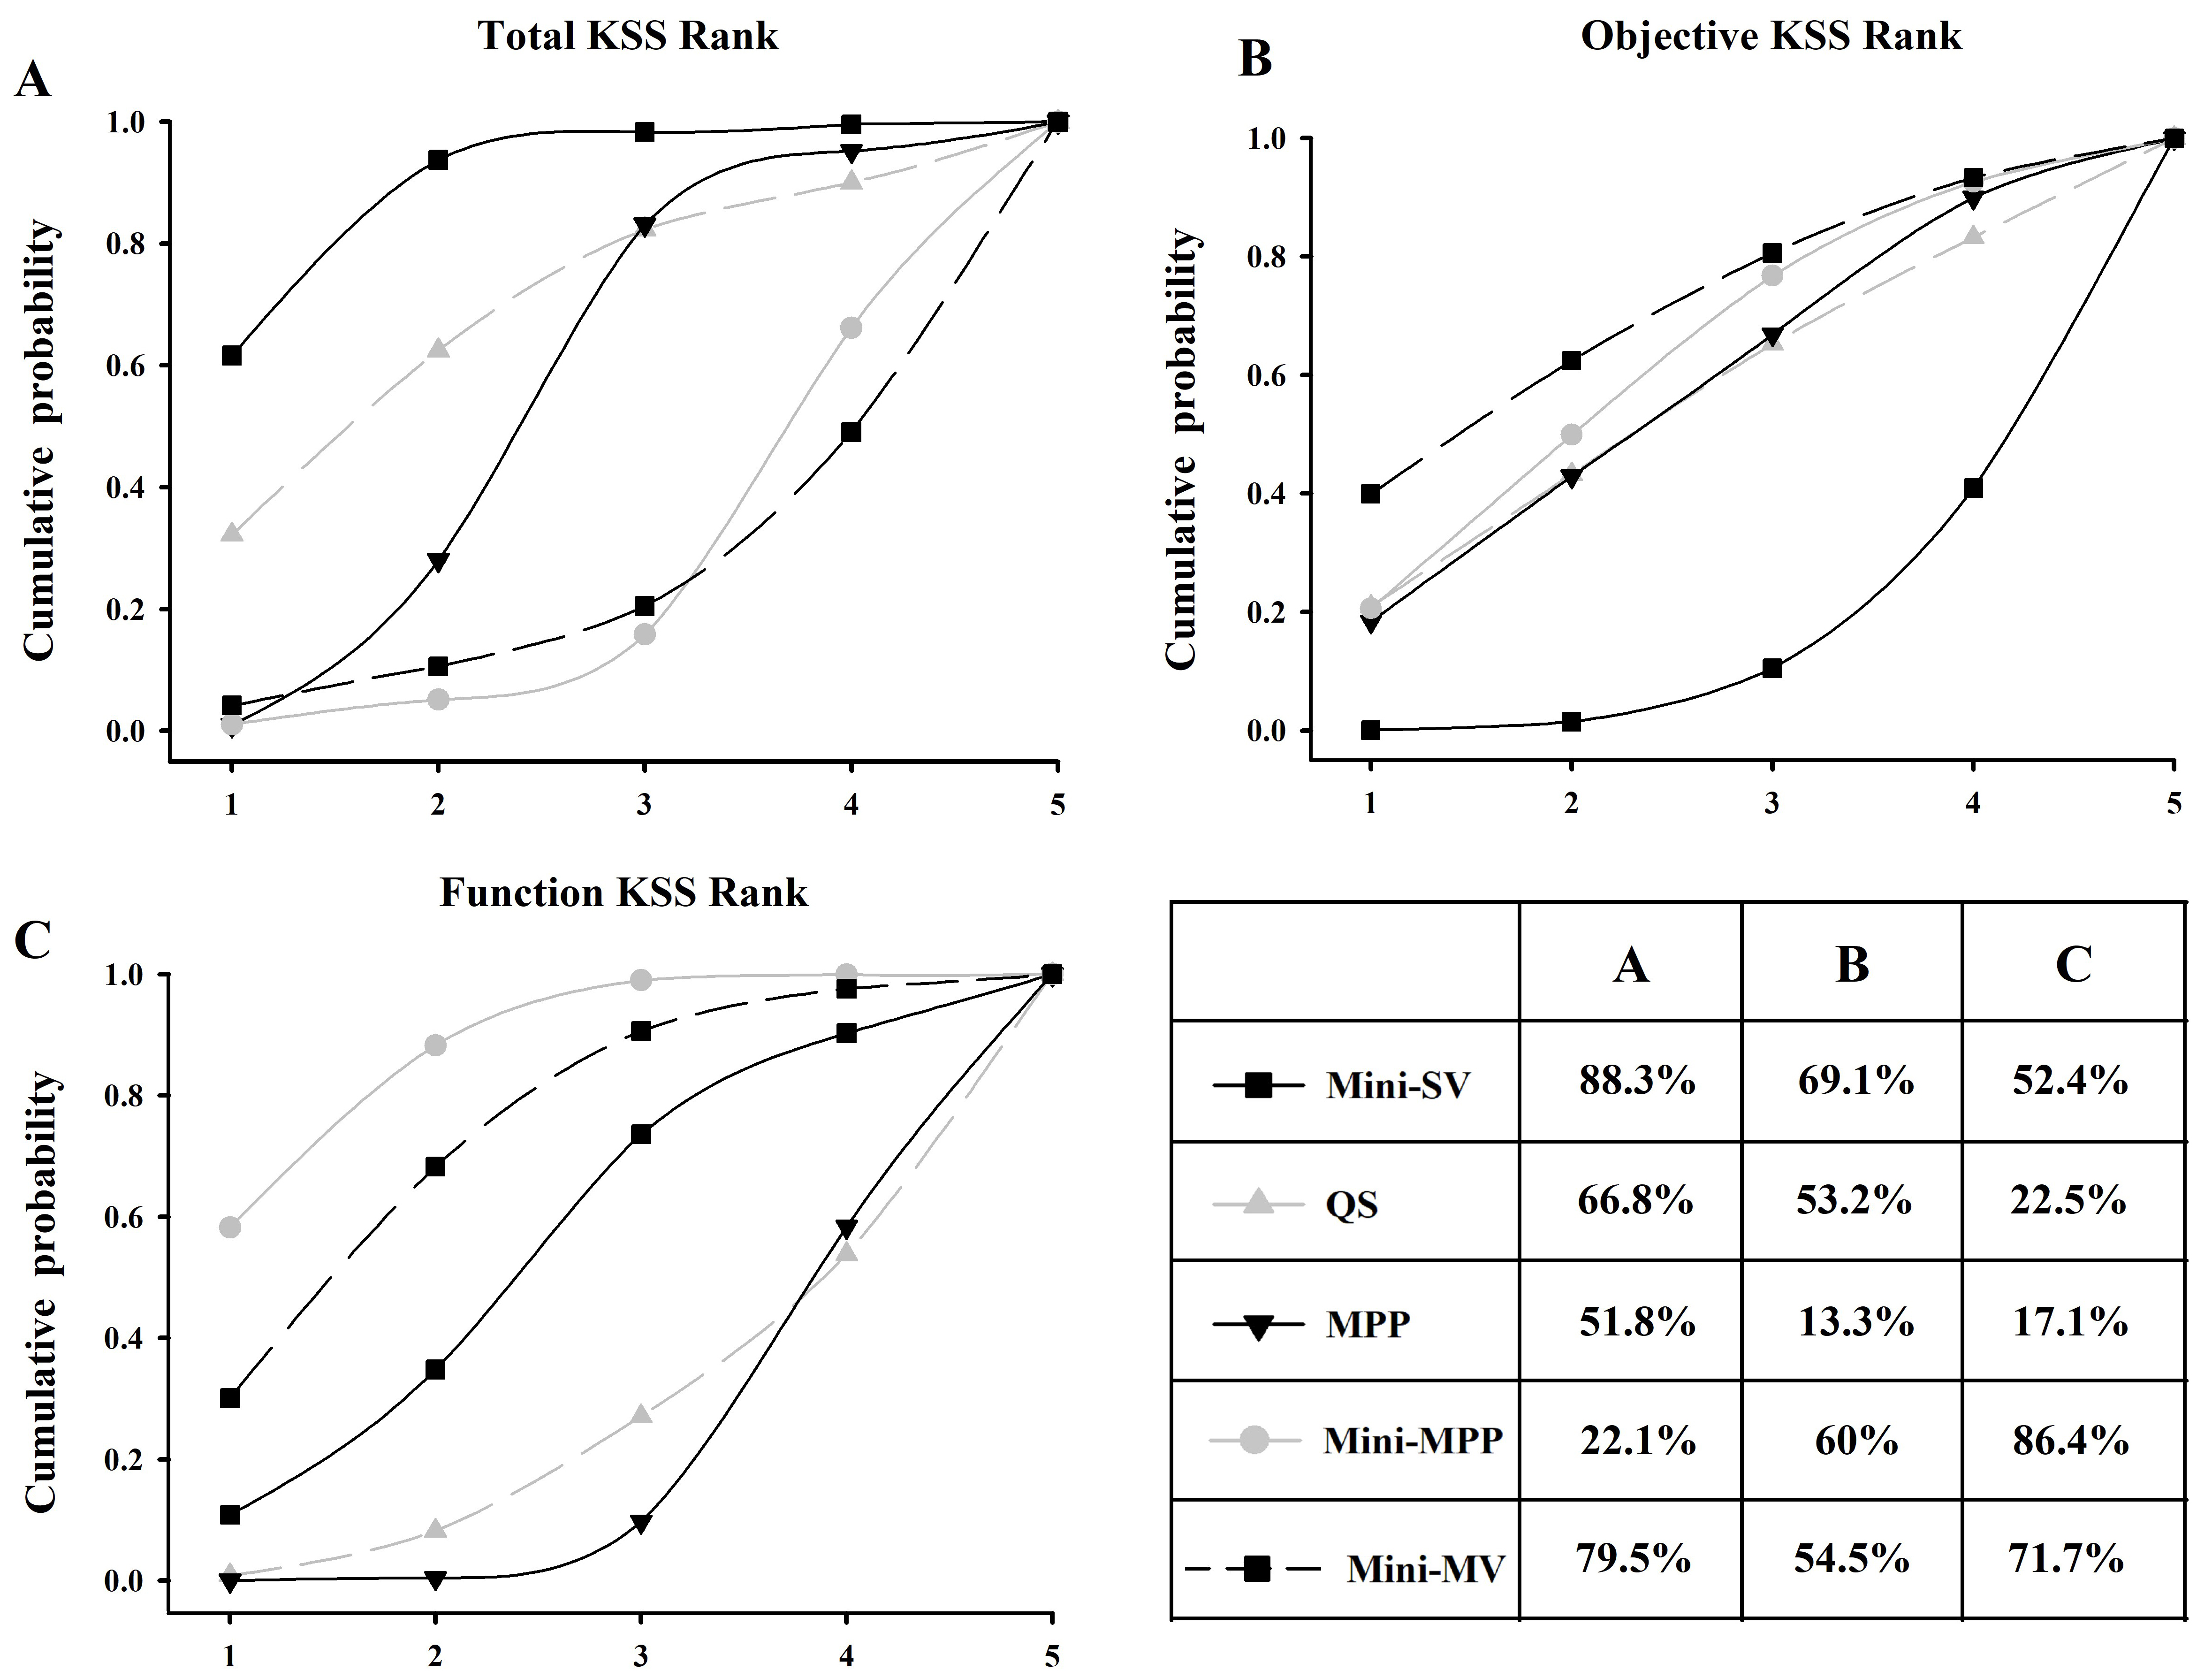
All potential comparisons were calculated via WinBUGS and are presented as MDs and 95% CIs. All the PSRF parameters were approximately 1, indicating a strong convergence. The results are listed in the upper-right triangle of Table 2, and the significant differences are presented as bold and underlined values. In terms of total KSS, mini-SV and QS approaches corresponded to greater but not significant improvement compared with standard MPP (MD
No statistically significant differences were observed when the total and objective knee score was compared between MIS groups at four-eight weeks. The only statistically significant differences were observed when the function score was compared between mini-MPP and QS (MD
Forest plot of all treatments for KSS improvement
The results of KSS improvement are presented in Fig. 4. All treatments showed statistically significant superiority when compared with pre-operative score except for mini-MPP and mini-MV with regard to total KSS scores.
Rank probability based on SUCRA
The ranking probability of each treatment in terms of KSS improvement is illustrated in Fig. 5. The area under the curve represents the cumulative rank probability of each treatment. Larger areas under the SUCRA curve represent better effectiveness. Mini-MV showed the highest probability of being the best treatment for improving total (79.5%) and objective (81.1%) KSS, respectively. Mini-MPP showed the highest probability (86.4%) of being the best treatment for improving functional KSS, followed by mini-MV (71.7%) and mini-SV (52.4%). It also ranked the second in improving objective KSS. Standard MPP, however, showed the lowest probability of being the best approach to improve objective (13.3%) and function (17.1%) KSS.
Inconsistency analysis
In objective and function KSS, six comparisons were necessary to detect the inconsistency. All the results are listed in Table 3.
Results of inconsistency analysis and meta-regression
Results of inconsistency analysis and meta-regression
MPP, medial parapatellar; MV, midvastus; QS, quadriceps-sparing; SV, subvastus.
A low-quality study (Thienpont 2012) included objective KSS and function KSS’s data. The comparison in the study is mini-MPP vs. MPP. After excluding this pair of data, the rank probability of two networks was calculated again. After exclusion, in the objective result, mini-SV (from 69.1% changed to 83.5%) was still ranked as number one and was better than mini-MV (from 54.5% changed to 72%), QS (53.2% to 40.7%), MPP (13.3% to 33.2%), and mini-MPP (60.0% to 20.6%). In function KSS’s result, mini-MV changed to number one from 71.7% to 90.0%. Mini-SV ranked number two (from 52.4% changed to 71.5%), mini-MPP declined to number three (from 86.4% changed to 45.2%), and QS was number four (22.5% changed to 7.6%).
Meta-regression was performed on the three different KSS’ networks, and no significant change in the DIC was observed (Table 3). These data suggest that the covariate (the sample size of the study) was associated with the treatment effects in objective and function KSS.
Discussion
The present network meta-analysis compared the effectiveness of MIS approaches (mini-MPP, mini-MV, mini-SV, QS) and standard MPP approach for TKA in terms of KSS improvement at four-eight weeks. The network results indicated that all five approaches improved KSS outcomes compared with preoperative data. There is also a trend favoring MIS approaches in KSS score over standard MPP approach at four-eight weeks. Only mini-MPP showed a statistically significant difference when compared with standard MPP and QS for function KSS score. In terms of ranking probability, mini-SV has the highest probability of improving total and objective KSS (88.3% and 69.1%, respectively). Mini-MPP has the highest probability (86.4%) for improving functional KSS, followed by mini-MV (71.7%) and mini-SV (52.4%). Standard MPP approach was the least effective for objective and functional KSS score, 13.3% and 17.1%, respectively.
TKA surgeries alleviate pain, restore function and improve patient’s satisfaction as inflammatory tissue and damaged cartilage are removed and alignment of the lower limb is fixed. Thus, it is one of the most successful and effective surgical procedures for patients with severe osteoarthritis. In accordance, Fig. 4 showed significantly improved total, objective and functional KSS after all approaches when compared with baseline data.
It is feasible to presume that the MIS approach may reveal better results when compared with standard approaches due to their limited damage to the extensor muscles and quadriceps tendon. In recent years, after retrospectively or at best prospectively compared cohorts (age/sex matched), MIS approaches seemed to fail to confer a substantial postoperative advantage in regard to some early outcomes such as hospital stay, VAS, KSS and straight leg raise [7, 27, 28]. This was confirmed by several other recent RCTs [29, 30] and RCT meta-analyses [31, 6, 15, 32, 33]. In our pooled analysis, only mini-MPP showed statistically significantly better KSS function score improvement at postoperative four-eight weeks (MD
The failure of demonstrating significant superior KSS score improvement in the MIS group could be possibly attributed to the following reasons: 1. There is a learning curve for surgeons undergoing MIS TKA. Lack of experience may result in poor clinical outcome, leading to underestimation of the MIS group effect [35, 36]. 2. Routinely applied advanced anesthetics, pain management, rapid rehabilitation, and patient education protocols which may accelerate the recovery of patients who accept conventional TKA procedure and thus narrow the difference. 3. Recently, some attention also shifted from the putatively objective tests (e.g. gait speed and duration of surgery) to the ultimately objective quantitative parameters such as serum biomarkers of muscle damage and inflammation (e.g. serum creatine kinas and C-reactive protein) [37, 38, 39]. Surprisingly, no superiority over MPP or even more muscle damage was found in the MIS approach [37, 39], suggesting MIS TKA is not less muscle sparing than the conventional approach.
In contrast to our results, several studies have reported that MIS TKA is associated with a significant better short-term KSS improvement. It should be noted that those non-randomized data comparing the outcomes of two surgical techniques must be interpreted with caution because they have the potential of a selection bias that may confound the relationship between the intervention and the outcome. Lin et al. performed a meta-analysis that compared the conventional MPP with the MIS approach [40] and found superior outcomes in KSS (objective and total) in the MIS approach. However, their analysis combined different MIS procedures in one analysis, hampering its clinical interpretation. Also, they did not integrate data over time. Most importantly, the primary outcome of our present study is the KSS improvement, not the difference within pre- and post-operation data, respectively. In a meta-analysis of 14 RCTs, Wu et al. also reported that mini-SV provides greater total KSS than MPP (
Until now, there are a few studies which compared MIS approaches. Although they showed significantly improvements in short-term clinical outcomes and expedite return of function, there seems no substantive difference between the MIS approaches for TKA. Results of participants undergoing mMV and mMPP approach TKA demonstrate similar results for short- and long-term results in clinical parameters (VAS, KSS, HSS, ROM), radiographic component positioning and complication [44, 45, 46, 47, 48, 49]. Notably, Heekin [49] and Sun [48] reported significantly better quadricep strength in the mini-MV group as measured by Cybex testing and straight leg raise whereas Zhang [47] and Liu [44] did not. In terms of QS vs. mini-MPP, Hung et al. reported no significant difference in any of the clinical (VAS, KSS, ROM) and radiographic outcomes after a minimum of five years of follow-up [50, 51]. Lin reported similar results with a shorter follow-up from postoperative 24 hours to two years [12]. Aglietti found no difference between mini-subvastus and QS approaches with regard to operation time, blood loss, complications, postoperative pain (day one), degrees flexion (one, three, six months) and radiographic data. However, active straight leg raise was achieved slightly quicker in the mini-subvastus group (
Mini-SV and QS avoid damaging the quadriceps tendon and muscle. Thus, it is reasonable to expect that such approaches could lead to superior functional improvement over other approaches. However, none of our results supported this. On the contrary, our pooled results revealed that mini-MPP better improved KSS function score over QS (MD
First, there appeared a number of methodological variations. For example, those studies with poorly concealing randomization of subjects would result in potential allocation bias. Also, although surgeons could not be blinded to the study allocation, further bias from patient expectation and the clinical outcome assessor might compromise the internal validity of a trial. Second, only a small number of studies based their sample size on a power calculation. As a result, such studies may lack sufficient power to demonstrate significant acceleration of clinical recovery after MIS approaches and are unable to detect a statistical difference between the two different procedures resulting in type II statistical error. Third, surgical experience could be an additional source of bias in this study and potential confound results [36]. A learning phase was identified using the MIS technique, as they are more technically demanding. A sudden jump from standard TKA approaches to MIS approaches will exposes patients to unnecessary risks and compromises surgical benefits. In the present study, only five included studies quantified the experience of participating surgeons [27, 54, 55, 56, 12]. Furthermore, even for the “experienced” surgeon who was assigned to perform MIS TKA to eliminate such bias, it cannot be presumed that the ability to perform the procedures in each arm of RCTs would be managed at the same standard and thus the intervention effect could be under- or over-estimated [12]. This may explain the heterogeneity.
Thus, with the early wide deviations of the “outcomes pendulum” logically coming to equilibrium, there is little left to extract from the continuation of traditional meticulous comparisons and debates over which approach is better. Perhaps future attention should focus on the clarification of more specific and strict indications and contraindications for each approach (e.g., comorbidities, degree of flexion/extension, angle of valgus/varus deformity, etc.). Moreover, improvement of surgical technique, modified implant design, intra-operative navigation system as well as postoperative rehabilitation should be advocated in both standard and MIS TKA procedures as they may help to achieve better postoperative function and better patient satisfaction.
Advantages and strengths
This study has some advantages and strengths. This is the first Bayesian network meta-analysis, which compares all available MIS TKA as well as conventional TKA. Unlike conventional meta-analyses techniques, Bayesian methodology advantageously enabled us to simultaneously compare every approach. We included the KSS score system as our primary outcome to assess patient outcomes, as it is a powerful scoring system with extensive validation. Our primary outcome is KSS improvement rather than postoperative KSS score. This study only included RCTs with a prospective design criterion. Furthermore, all p-values regarding the inconsistencies were less than 0.05. The sensitivity analysis did not show a significant change in the cumulative probabilities rank, and no significant change in the DIC was found according to the meta-regression results. Therefore, the outcome of this meta-analysis is valid and reliable. In addition, we calculated indirect comparisons via Bayesian statistics. Furthermore, this model was used to build inconsistency, sensitivity and meta-regression tests.
Study limitations
We acknowledge some limitations in this study. First, due to the lack of available trial data, our study provides results only at postoperative four-eight weeks and thus we are unable to ascertain the longer-term comparison result between these five approaches. Also, the direct estimates for some procedures are based on a single study. Thus, we highlight the need for more high-quality prospective RCTs with greater sample sizes and longer follow-up periods in the future to supplement and corroborate these results.
Second, the qualities of the included studies varied. Some studies were better-designed RCTs with high patient numbers and adequate randomization; however, other studies had few participants or weak blinding/allocation. This limitation can be addressed after more high-quality studies are conducted in the future.
Third, heterogeneity exists within particular subgroups. Variations which may have accounted for such heterogeneity include: the difference in sample sizes, different inclusion and exclusion criteria, the variations in randomization and blinding, experience of MIS approaches, the use of a wide variety of implants and navigation systems, and variability in the use of minimally invasive techniques and postoperative pain management standardization. Unfortunately, not all studies quantified these factors and our review ignored these differences. This uncertainty is magnified when integrating them in mixed-treatment comparisons, as evidenced by the enlarged 95% CIs. This may explain why most of our comparisons were statistically insignificant.
Conclusion
Based on the current evidence, the MIS approach was not significantly statistically superior to the standard parapatellar approach in terms of KSS scores at postoperative four-eight weeks. We recommend that the choice of the surgical approach is based on surgeon experience and preference as well as patients’ particular characteristics and demands.
Footnotes
Conflict of interest
The authors declare that they have no conflict of interest.
Supplementary data
Appendices 1–3 are available to download from http://dx.doi.org/10.3233/THC-192078.