
Abstract
This paper presents a new software framework,
Introduction
A fundamental underlying idea of the Semantic Web is to share Linked Data (LD) which is harmonized using ontologies. This approach has been proven useful in, for example, the Cultural Heritage (CH) domain in aggregating, harmonizing, and enriching data silos of different galleries, libraries, archives, and museums (GLAM) whose contents are typically heterogeneous and distributed, but often related semantically to each other [11].
Semantic Web content is published for machines via LD services and for human consumption using web-based LD applications, such as semantic portals. In general, semantic portals are information systems which aggregate information from multiple sources and publish them using Semantic Web technologies into user interfaces for solving information needs of end-users [10,20,25–27]. Such portals, based on knowledge graphs published in LD services, typically provide the end-user with intelligent services for data exploration [14] and analysis based on the well-defined semantics of the content. These services may include faceted, ontology-based, and entity-based search engines, semantic browsing based on semantic relations extracted and reasoned from the underlying knowledge graphs, and tooling for data-analysis, visualization, and serendipitous knowledge discovery [12].

Visualization of the movement of pre-modern manuscripts as arcs from places of production to last known locations using the Mapping Manuscript Migrations Portal. Subsets of manuscripts can be filtered out for visualization using the facets on the left (Label, Author, Work, Production place etc.). The blue end of the arc shows the production place and the last known location is in red (this is not necessarily visible in black and white print). There are different options available for inspecting the filtered result set using tabs on top of the image: Table, Production places, Last knows locations, Migrations (selected in the image), and Export. The Export tab enables the user to export the SPARQL query, which was used for generating the Table result view, into the public SPARQL query service Yasgui. In Yasgui the current result set can be, e.g., downloaded in CSV format for external analysis.
To extend the notion of sharing and reusing data on the Web, this paper proposes that one should harmonize and share the way in which semantic portals, especially their user interfaces, are implemented and used, too. It is argued that in this way implementing semantic portals can be made easier for software developers, and from the end-user’s perspective, portals based on similar functional logic are easier to learn to use.
An approach towards these goals is the Sampo model1
Sampo is, according to the Finnish epic Kalevala, a mythical machine giving riches and fortune to its holder, a kind of ancient metaphor of technology.
As LD can be used to express virtually everything, a vital challenge is to be able to create user-friendly domain-centric semantic portals with minimal effort. Domain-centric means that the underlying knowledge graphs have been selected beforehand and the scope of the portal is limited to a specific domain. However, the availability of tools for building such custom applications on top of LD is limited [4].
To tackle these challenges, the key contribution of this paper is to introduce the
Information about
A prerequisite for using
An example of an application of
This paper is structured as follows. Section 2 reviews existing tools and surveys related to creation of user interfaces for semantic portals. In Section 3 we present specific requirements for tools for building user interfaces for semantic portals. In addition, requirements regarding the portals themselves are explicated. The
User interfaces for LD applications can be created in various ways, and can employ a variety of user interaction paradigms [2]. This section provides some relevant references for designing and implementing user interfaces for semantic portals.
Khalili et al. [16] discuss the state of end-user application development for LD, and present the Linked Data Reactor (LD-R), which is an open-source software framework for building modern web-based LD user interfaces. LD-R is based on the idea of using existing solutions, such as the Flux pattern3
Flux pattern for building user interfaces:
SPARQL Faceter [19] is a JavaScript library for building faceted search user interfaces, implemented using AngularJS5
The metaphactory platform [4] is used for building semantic web applications for LD, with focus on both addressing management needs of large organizations and providing domain-centric intuitive end-user interfaces. The platform is deployed in several different use cases, including the ResearchSpace project using the British Museum collection as LD.
Bikakis and Sellis [1] have surveyed LD exploration and visualization systems, and presented some general features and requirements of such systems. Klímek et al. [18] have surveyed existing tooling for LD consumption for non-technical end-users and presented general requirements for end-user LD platforms, encompassing variety of topics, such as, dataset discovery and data manipulation.
Po et al. [21] present LD visualization techniques and tools, and evaluation of the tools in different use cases. Of the presented 16 use cases of LD visualization, five cases (5, 6, 8, 11, and 12) are relevant for semantic portals in general, and cover the basic functionalities of them. None of the evaluated visualization tools are able to handle all of these use cases.
For general tasks related to querying, parsing, and processing RDF6
This section presented related work for creating user interfaces for semantic portals. The
In this section, desired features of semantic portal user interfaces are outlined, together with requirements for tools for building them. This is based on earlier research presented in Section 2, as well as the authors’ own experience in developing such systems [9,19].
From the related work regarding tools (e.g. software libraries and frameworks) for implementing LD applications, we found the following requirements (denoted by T) that tools for implementing semantic portal user interfaces should fulfill:
Enable rapid creation of use case-specific applications with minimal effort [4,19],
Ability to query data directly from a SPARQL endpoint [18,19],
Support for hierarchical data exploration using ontologies [19,21],
Scalable techniques used, that can handle a large number of data objects over an exploration scenario, using a limited number of resources [1],
Enable creating intuitive and user-friendly user interfaces for non-technical users [4,17–19],
Ability to produce visualizations that automatically adapt to available resources, especially screen resolution and size [21],
Designed and implemented in a way that fosters sustainability [18,19].
From the related work regarding LD applications, we gathered requirements (denoted by SP) that are relevant for the structure and functionalities of the user interfaces of semantic portals. Most of the semantic portals would need to fulfill these to solve the information needs of end-users:
The portal supports having multiple perspectives for accessing the knowledge graph(s) [9,21],
The perspectives provide methods for browsing and exploring the knowledge graphs to find something useful and interesting without initially knowing exactly what to search for [1,21],
Users can visualize instances that share one or more specific properties, e.g., all instances of a specific class with a common property value [21],
Users can visualize the properties and relations of a specific instance [21],
Users can explore and visualize the instances of a specific class [21],
Users can explore and follow links between various instances [21],
Users can visualize the data graphically, e.g., geographically on maps, temporally on a timeline, or as a graph diagram of connected entities [18,21],
Users can export non-RDF output, e.g., a CSV file [18].
Search paradigms and result set visualizations for semantic portals
The following search paradigms are essential in LD user interfaces [4,21] like semantic portals.
Free text search across the whole knowledge graph is the most widely recognized search paradigm. The search can use all textual metadata fields of all entities, or to be narrowed down to, e.g., only use labels, and/or only use entities of specific classes.
Faceted search [5,28], known also as view-based search [22] and dynamic hierarchies [24], is based on indexing data items along orthogonal category hierarchies, i.e., facets (e.g., places, times, document types, etc.). In searching, the user selects in free order categories on facets, and the data items included in the selected categories are considered the search results. After each selection, a count is computed for each category showing the number of results, if the user next makes that selection, omitting categories with no hits. The idea of faceted search is especially useful on the Semantic Web where hierarchical ontologies used for data annotation provide a natural basis for facets, and reasoning can be used for mapping heterogeneous data to facets. Faceted search can be implemented with server-side solutions, such as Solr,8
In geospatial search the user can see resources on a map, and browse and explore them. It should be possible to filter the result set by making a selection on a map with e.g. drawing a bounding box.
Temporal search can be performed by constraining the result set based on a timeline component or a timespan selector. A timeline can be used to browse and explore the resources.
The result set that has been constrained using one or more search paradigms can be shown to the user in many different ways. The user can be provided with options of various result set display methods to choose from, that are considered relevant: Table is often an intuitive way of displaying the resulting resources as a simple 2-dimensional table with each resource as a separate row and their most important properties shown as table columns. Another useful tabular format is to use a grid to position and show each result inside a rectangle. Geospatial visualizations show the results visually on a map as, e.g., markers, polygons or heatmap layers. Temporal visualizations display the results on a timeline. Spatio-temporal visualizations display the results with interlinked geospatial and temporal components. Statistical visualizations, e.g., bar charts, histograms, line graphs, pie charts, and sankey diagrams, are useful if the result set is large, by providing summaries of the results instead of individual resources.
All of the previous display methods need to able to handle information overloading issues [21] related to large result sets with, e.g., pagination, infinite scrolling, or clustering of individual resources into larger groups.
The structure of the user interface should support having multiple perspectives for data exploration and searching, each of which are built around entities of a specific class. This way distinct perspectives to the underlying data can be built iteratively and individually.
Moreover, each entity of interest in the knowledge graph should have a landing page, which shows the metadata related to the single entity. Additionally, the landing pages provide both internal and external recommendation links to other related entities, e.g., for the landing page of a person, their family, relatives, and friends could be shown as links to the landing pages of the persons in question. Social network visualizations can be integrated to the landing pages of people, to provide a useful and intuitive way of seeing the person in their social and historical context. The URLs of the landing pages must be constructed in a in a systematic way to enable easy linking within the portal and from external applications.
Sampo-UI framework
This section presents the architecture, design principles, and the main user interface components of the
The
The framework is meant for creating full stack JavaScript web applications. The main parts are (1) a client based on the widely used and established React12
Figure 2 depicts the overall architecture of

General architecture of
The API endpoints provided by the Node.js backend are described using a document that conforms to the OpenAPI Specification.18
For handling the API requests related to faceted, full text, and spatial search, the Node.js backend includes a set of generalized templates21
Generalized templates for
See instructions for configuring the Node.js backend for SPARQL endpoints in
While the Node.js backend makes it possible to run any relevant JavaScript libraries on the server, the architecture can be extended by connecting the Node.js backend to additional backend services, as illustrated in Fig. 2. This is useful, e.g., if Python modules are needed for dynamic processing of SPARQL query results. An example of such extension is the Sparql2GraphServer API23
Figure 2 also shows how API requests to external vector and raster-based services for geographical data can be made directly from the client, as long as the respective API key does not need be hidden. If the API key need to be hidden, the API requests are routed through the Node.js backend. In
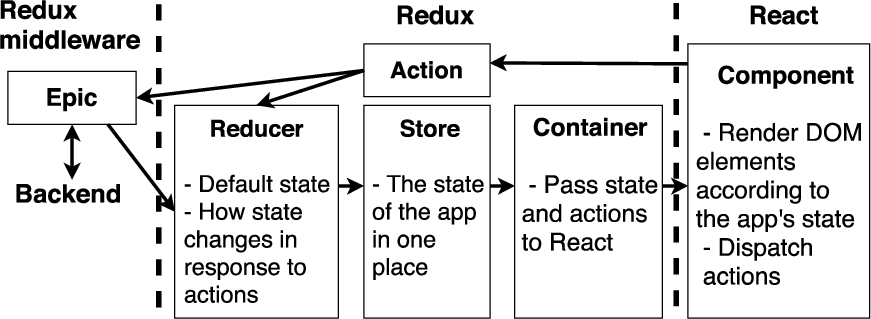
The modular architecture of the client is depicted in Fig. 3, where boundaries between the main client-side libraries are marked with a dashed line. The state of the application (e.g., the user’s facet selections and the search results) is maintained using the strict unidirectional data flow enforced by Redux.25
In Redux Observable epics are functions which take a stream of actions as input and return a stream of actions.
Nowadays the size of the knowledge graphs that a semantic portal needs to be able to process ranges from thousands to tens of millions triples. Furthermore, the data may be available from a single triplestore or from multiple triplestores. For handling these varying settings we have developed two main approaches for implementing faceted search in
The most critical requirement for ServerFS is that all underlying data needs to be made available from a single SPARQL endpoint. ServerFS also causes considerable load on the triplestore when the knowledge graph is large or the portal has a usage spike,28
If the triplestore is deployed using a Docker container or similar, it is possible to handle the usage spikes with autoscaling [3] carried out by a container-orchestration system.
In some application settings, e.g. in NameSampo portal [15] that re-uses several existing SPARQL endpoints, it is not possible to aggregate all data into a single triplestore. For these settings we have developed a second approach named “client-side faceted search” (ClientFS). The main idea here is that the whole initial result set for faceted search is first fetched into the client as JavaScript objects, after which all faceted search functionalities are implemented using a set of Redux selectors.29
Based on our experiences, due to the memory limit set by the browser running the client, the initial result set in ClientFS has to have an upper limit of approximately 30 000 instances on modern mobile devices or desktops with more than 4 GBs of RAM. Even though this limitation rules out many large knowledge graphs, we have found ClientFS effective especially when the initial query is a full text query, which is sent to multiple triplestores simultaneously. Then the results from each triplestore are merged and used as the initial result set for ClientFS. This approach is in use, e.g., in the above-mentioned NameSampo portal.
Figure 4 illustrates how the different tasks related to faceted search are divided between the client and the backend, when using either ServerFS or ClientFS. The example configurations of

Faceted search architecture options of

Main views of a semantic portal, using the default structure provided by the Sampo-UI framework. The arrows depict navigation links between the views.
Figure 5 illustrates the three main views of
The portal landing page welcomes the user with an introduction text and list of links to different faceted search perspectives for studying the underlying knowledge graph(s). To minimize page load time, no SPARQL queries are being executed on this view.
Each faceted search perspective typically contains a group of facets configured for a specific entity type in the knowledge graph. For viewing the search results and conducting data analysis tasks several result set visualization components can be added.
The entity landing page provides information related to a single entity. The faceted search perspective and the entity landing page share the same result set visualization components.
Component-based user interface development is enforced by many state-of-the-art libraries and frameworks for web application development, such as React,31
The user interface components of
Figure 6 demonstrates how a group of
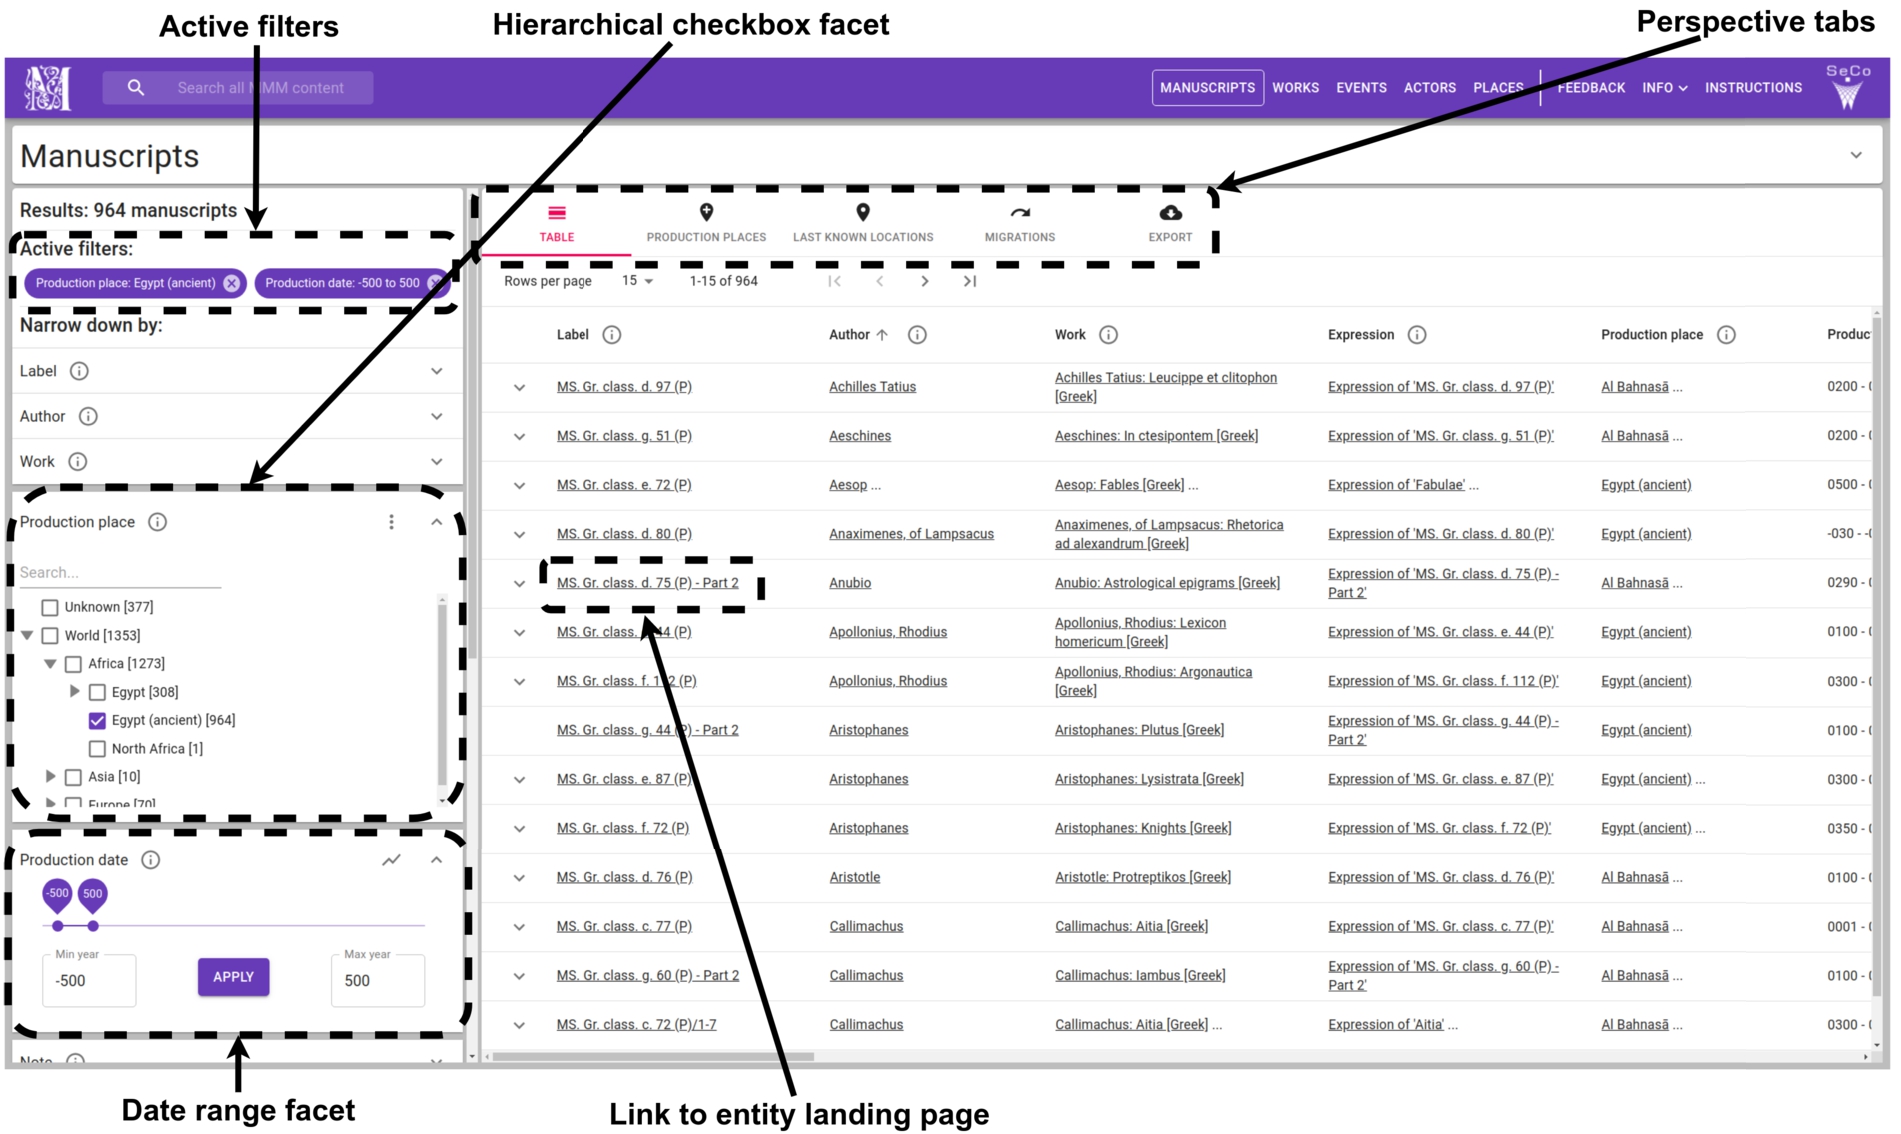
A selection of
The Hierarchical checkbox facet component has been developed for filtering with URIs, literal values, or geographical regions. The user can make selections with checkboxes or by drawing a bounding box on a map. There are several additional user-controllable options for faceted search, such as sorting of facet values (e.g., by hit counts), visualization of facet value distributions (e.g., by a pie chart), and selecting multiple disjunctive values in a single facet. For showing hierarchies of arbitrary depth efficiently, only concepts and their parent concepts need to be selected in the SPARQL query of the facet. The
For free text search a Text facet component can be used. For filtering with date or integer ranges the developer can choose to use either the Date facet with date pickers, the Range facet with input fields, or the Slider facet component.
Specific user-controllable options for each facet are provided by the Facet header component. The currently active facet selections are shown to the user with the Active filters component. All facet components of
User interface components for result set visualizations
On the faceted search perspective shown in Fig. 5, the Perspective tabs component provides the user the ability to switch between different result set visualizations, while persisting the state of the facets. The default component for rendering the results is Paginated table, illustrated in Fig. 6. It has controls for pagination actions, changing the rows per page, and sorting the result set. The Paginated table component consists of a number of smaller components, which are used to handle for example expanding of rows and showing multiple values in a single table cell. Separate components are provided for displaying plain text, HTML, or images in the Paginated table component, or elsewhere in the application.
For rendering geographical data,
Unlike the Leaflet map component, the Deck.gl37
To visualize spatio-temporal data, the Deck.gl component is used as a basis for the Temporal map component. The Temporal map component renders any geographical data with timestamps as an interactive animation.
For showing statistics,
Moreover, as LD provides a good basis for graph structures,
Because the underlying visualization libraries consume data in different formats, specific result mapper functions are provided in the backend of
Thanks to the component-based design and the centralized application state, the developer can easily add new components and result mapper functions for searching and for visualizing results sets as needed. The responsiveness and accessibility of the majority of
In this section experiences of applying the
The portal is published at
The WarVictimSampo portal was created to replace an older web application that was used to provide access to the War Victims 1914–1922 database44
The data contains also Finnish victims of the First World War and the Kindred Nations Wars in 1914–1922.
Simultaneously with the development of the new user interface, the database was updated with new victims and converted into a LD knowledge graph. The new portal needed to work with the knowledge graph and enable exploring, visualising, and studying the results in ways that are useful for both researchers and the general public. The project had relatively little resources and time for creating the user interface of the portal, so it was was preferable to use some existing application or framework as a basis for the user interface.
The portal was created with two faceted search perspectives to the data with various options for search and visualization: the war victims perspective, and a perspective for battles of the Finnish Civil War. More perspectives are planned to be added later. The WarVictimSampo portal was opened to the public in November 2019 and gathered nearly 20000 unique users in the first month.
The development started by forking the
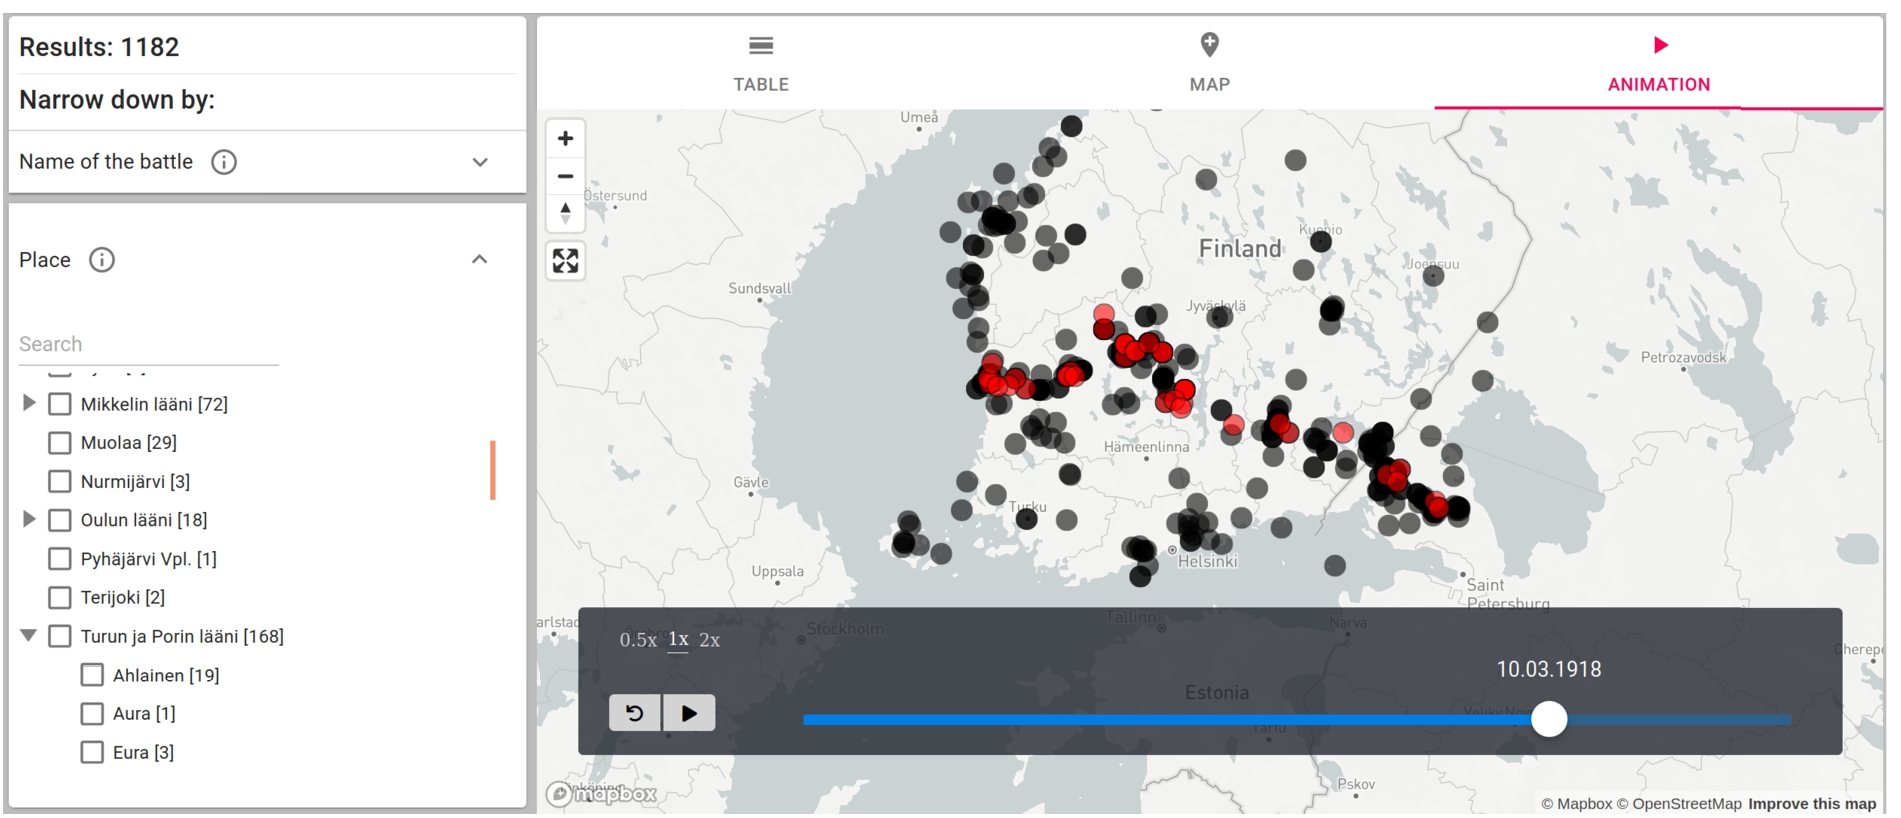
Animation result set visualization of the battles of the Finnish Civil War. As time goes by on the time slider at the bottom, new battles emerge as red spots and turn later into black spots. In the image, the main front line of the Civil War from east to west can be seen. The battles can filtered using the facets on the left.
The War Victims of Finland 1914–1922 database has very detailed information about the victims and a piece of information can relate to a person in more than 150 different ways. In the portal this data can be filtered with multiple different types of facets to best fit each type of information. These facets were created using the facet components of
After filtering out a result set in the portal, the results can be analyzed with various result set visualizations based on the components presented in Section 4.5. The default visualization of the results is a table created with the Paginated table component. There is also map for visualizing the death places and the battle places. The map was created with the Leaflet map component.
For statistical analysis the portal includes pie chart and a line chart result set visualization. The pie chart and line chart visualizations were created based on existing components of
The Temporal map component of
The entity landing pages for war victims are a core functionality of the portal. To best express things specific to this case, such as sources of different pieces of information, a custom component was created by extending the general entity landing page component of
Finally the CSV export functionality of
Faceted search, combined with visualizations for data analysis, was easy to implement with the
For example, Fig. 8 shows two different line charts generated by the line chart view of the WarVictimSampo for comparing the ages of people from one side of the Civil War whose official place of residence was in two different provinces of Finland. In both charts, the party “Red”50
The Civil War was fought between socialist Reds (“punainen” in Finnish) and conservative Whites (“valkoinen”).
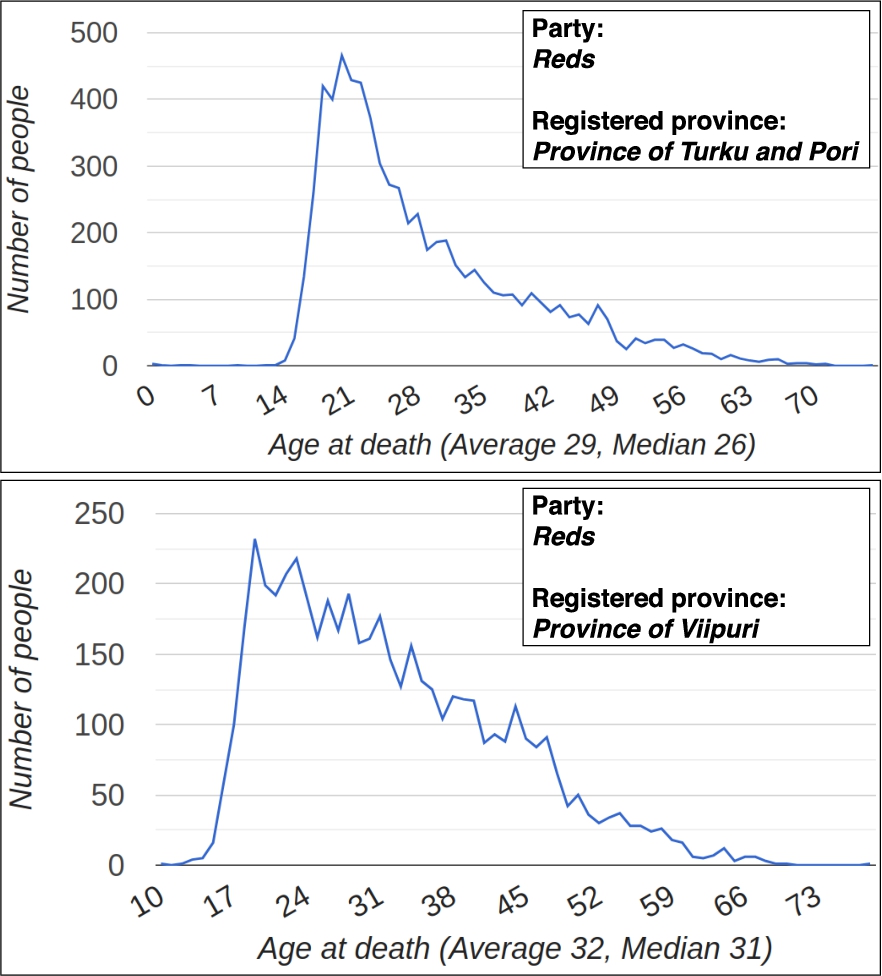
Two line charts generated with the WarVictimSampo portal depicting number of people of certain age at death in the result set. The upper chart depicts people of the Red party from the Province of Turku and Pori and the lower chart depicts people of the Red party from the Province of Viipuri.
Using
The ability to easily customize the existing components, and add new ones, was very useful here. This made it possible to better express the characteristics of the specific rich and complicated data. The customization requires some programming skill, but the core functionality provided by the framework includes robust patterns and tools for processing the data and delivering it to the components in a predictable and uniform way. Because the framework is integrated with a plethora of open source JavaScript visualizations libraries, even the creation of new result set visualization components is relatively easy.
This section describes the contributions, availability, sustainability, and limitations of
Contributions
This paper presented general features and requirements for user interfaces of semantic portals and the new
Table 1 presents the already published and forth-coming semantic portals that have been implemented using
More information about the portals and related publications can be found on the homepage:
Semantic portals using the
The impact of the framework has been demonstrated through the case study presented in Section 5, the portals already using it, and the several new semantic portal user interfaces that are being built with it as shown in Table 1.
The following list of
Ready-to-use basis for a user interface of a semantic portal, which needs only minor modifications for deploying as a modern web application into production,
Well documented API and query templates for using single and multiple SPARQL endpoints, including password protected SPARQL endpoints,
Hierarchical checkbox facet component for querying and visualizing ontological hierarchies of arbitrary depth efficiently,
Two scalable faceted search approaches, ServerFS and ClientFS, for different use scenarios. Result set visualization components use pagination and clustering,
Facilitate creating user-friendly, intuitive, and accessible user interfaces by enforcing the Material Design guidelines as a basis,
User interface components and visualization libraries support responsive web design,
Sustainability fostered by providing open source code, extensive documentation, and support for software development through preconfigured development environments.
The semantic portals created with
The portals provide multiple perspectives for accessing the knowledge graph(s),
Each perspective includes a user interface based on faceted search with different result set visualizations to support data analysis,
Faceted, text, temporal, and geographical search paradigms are supported,
Faceted search is efficient for visualizing instances that share one or more specific properties,
Customised entity landing pages provide various ways to study individual entities using several visualizations,
Each perspective is customized for a specific entity type,
The perspectives are interlinked with each other and they contain links to the entity landing pages, which are in turn interlinked with each other,
The data can be visualized using interactive maps, statistics, networks, and animations,
Ready-to-use functionalities for CSV export.
Considering the requirements for tools for creating user interfaces for semantic portals, as well as the requirements for the portals themselves,
The design philosophy behind
These choices are based on the experiences of developing
SPARQL Faceter’s ideas of using only SPARQL for data retrieval is also adopted in
Instead of using only client-side code, introducing a Node.js backend to the architecture adds some overall complexity, but the benefits are plentiful. A significant part of the logic related to various search paradigms and the processing of search results can be carried out in the backend using pure JavaScript, instead of having to integrate the functionality inside client-side frameworks or libraries, which are known to become deprecated considerably sooner than pure JavaScript code. Additionally, using the backend for SPARQL queries makes it possible to run many computationally expensive operations related to data processing on the server, instead of relying on the varying computational resources of the client. Also querying password protected APIs or SPARQL endpoints using only client-side code is impossible without exposing the API keys or passwords to the users.
A central task in developing user interfaces for LD is to be able to convert raw SPARQL result rows into arrays of JavaScript objects. With simple SPARQL queries this is trivial, provided that one result row corresponds to one entity of interest. However, in real world settings it is typical that a high number of SPARQL result rows need to be merged into arrays of deeply nested JavaScript objects. This kind of functionality was not supported in any of the existing libraries we have surveyed, so a comprehensive set of result handling functions were developed in
Limitations and future work
When designing user interfaces for semantic portals, one has to select which search paradigms are supported. A key challenge here is that the search paradigm selection affects the data creation phase and publishing phase, so that ontologies and metadata annotations support the planned user interfaces, and that the needed APIs and search indices are deployed and properly configured. Hence the functionalities provided by the
Since a user interface built with the
The backend of Sampo-UI could also be used by another client via the well defined API. In order to further improve the reusability of
As the API provided by
Several new features are being planned for
The
Sustainability of
Footnotes
Acknowledgements
The