
Abstract
Since the birth of the Semantic Web, numerous knowledge bases have appeared. The applications that exploit them rely on the quality of their data through time. In this regard, one of the main dimensions of data quality is conformance to the expected usage of the vocabulary. However, the vocabulary usage (i.e., how classes and properties are actually populated) can vary from one base to another. Moreover, through time, such usage can evolve within a base and diverge from the previous practices. Methods have been proposed to follow the evolution of a knowledge base by the observation of the changes of their intentional schema (or ontology); however, they do not capture the evolution of their actual data, which can vary greatly in practice.
In this paper, we propose a data-driven approach to assess the global evolution of vocabulary usage in large RDF graphs. Our proposal relies on two structural measures defined at different granularities (dataset vs update), which are based on pattern mining techniques. We have performed a thorough experimentation which shows that our approach is scalable, and can capture structural evolution through time of both synthetic (LUBM) and real knowledge bases (different snapshots and updates of DBpedia).
Introduction
The last years have witnessed a huge growth in the amount of open and structured data, published in Knowledge Bases (KB) such as RDF graphs. Data consumers and application developers are however heavily dependent on the quality of this open data for their usage. One important quality criterion [57] is the stability across time of the usage of the vocabulary (i.e., RDF classes and properties). For example, a movie application will expect a set of properties in the description of films, and some of its functionalities might become unavailable, or at least degraded, if some properties are removed or replaced during the evolution of the KB.
To manage the evolution of the vocabulary usages in knowledge bases (i.e., how the ontologies forming the vocabulary are actually used and populated), one could suggest that it is enough to compare two sets of properties – one for each version – to assess their evolution. In this regard, several approaches have been proposed to monitor the evolution of ontologies [4,55], as well as the evolution of their associated data in conformance with their schema [18,41]. However, a knowledge base may not, in practice, conform exactly to a fixed schema due to deviations coming either from the content itself, which can have missing data or inadequate vocabulary; or from the heterogeneity of the sources (data publishers and extractors). Indeed, particularly among human sources, the level of modeling skills or the focus of their contributions can also vary. Vocabulary usage should then be seen as a statistical distribution over the sets of classes and properties used in resource descriptions, i.e., over RDF structures. For example, in a movie knowledge base, a possible distribution could be such that 80% of movies have a release date, and 95% of movies with a release date also have a release country. This heterogeneity in vocabulary usage makes it difficult to detect and measure the structural evolution of RDF graphs, although it must be assessed as it can strongly impact data usage.
Vocabulary usage can be analyzed in terms of structural patterns, i.e., combinations of RDF classes and properties, and in terms of the statistical distribution of those patterns in the data. Such structural patterns have been shown to be common in RDF graphs [35], and have been used to optimize SPARQL queries [24]. In our previous work [21], we have exploited pattern mining techniques [54] to compare two knowledge bases, measuring their structural similarity. However, this approach only aimed at comparing different knowledge bases, not at evaluating the fine-grained evolution of the structural patterns of a single knowledge base. To that purpose, it is necessary to be able to compare RDF graphs at different levels of detail, i.e., individual updates w.r.t. the entire knowledge base. While the first option to perform such comparisons were to build on graph kernels [6], they are known for suffering scalability issues, so we stuck to pattern mining techniques to achieve the scalability required without losing expressivity.
In this paper, we propose a data-driven approach to assess the structural evolution of large knowledge bases. When analyzing the evolution of large knowledge bases, such as DBpedia, we can characterize such an evolution as a sequence of updates (e.g., more than 900,000 updates for DBpedia between 2015-10 and 2016-10). Besides, from time to time, the knowledge base maintainers can publish a version of the KB, called snapshot, that represents a consolidated view of the KB. While they are different in nature, we want to stress that updates and snapshots are defined at different granularity levels: 1) updates are much more frequent than snapshots; and 2) each update only contains (and affects) a small subset of the KB resources, while a snapshot contains all resources existing at a point in time.
While we can use our structural similarity measure [21] to compare two snapshots, we need new measures to assess the structural evolution in a fine-grained way, comparing updates to snapshots. In particular, we propose two new measures which make possible to: 1) identify which updates are outdated in the sense that they conform to an older snapshot (e.g., they are using old versions of particular URIs, or they follow old modeling practices); and 2) identify which updates alter the heterogeneity of the structural patterns w.r.t. the last snapshot. In this last regard, an increase of heterogeneity means that the update introduces new structural patterns instead of reusing former ones (e.g., adding new properties which were not previously present in the data,1
Note that they might even come from a typo in the URIs, as they would be considered as new vocabulary.
Database

The contributions of the paper are twofold:
two new similarity measures to compare individual updates to consolidated versions of a KB (snapshots);
a methodology to apply the different similarity measures to the data-driven assessment of data evolution in a KB.
The rest of the paper is as follows. Section 2 briefly describes the basics of the frequent pattern mining techniques that this paper is based on. Section 3 recalls the representations and definitions we need to apply our proposal (i.e., the representation we defined in [21] to use pattern mining techniques to extract structural patterns from RDF graphs, and presents its extension to represent updates), as well as a running example which will serve to illustrate the new measures. Then, Section 4 describes the different measures we propose to use to assess the evolution of a knowledge base, and Section 5 introduces the proposed methodology to apply such measures in a deployment scenario. Section 6 details the experiments we have carried out on both synthetic data and DBpedia to show the feasibility of our proposal. Finally, Section 7 discusses the related work, and Section 8 presents the conclusions and future work.
This section briefly defines the basic concepts of the well-known data mining technique called frequent itemset mining. Then, the pattern mining approaches based on the Minimum Description Length (MDL) principle are presented.
Frequent itemset mining
Pattern mining methods are data mining approaches that extract regularities from a database [1]. Formally, let
A transaction t supports an itemset X iff
For instance, in Table 1, t1, t2 and t3 support {a, b}, which means that
An itemset X is called frequent, iff
For instance, in Table 1, for
Frequent itemset mining is the pattern mining method that finds all frequent itemsets in a database with respect to a threshold
One of the major problems with frequent itemset mining, and pattern mining in general, is that the number of extracted patterns can be huge. Several methods tackle this problem, among which one is based on information theory and more specifically on the Minimal Description Length (MDL) principle [13,42]. The main idea of the MDL principle is that “any regularity in the data can be used to compress the data”. This principle is used to compare several models by selecting the model which offers the best trade-off between the complexity of the model and the compression of the data by this model. The idea is that “the best model is the one that compresses the data best”. From that concept, Vreeken et al. [54], propose an approach, called KRIMP, to find “the set of frequent itemsets (as a model) that yield the best lossless compression of the database”. Before presenting KRIMP in detail, some notions have to be defined.
Code table and standard code table A code table is a subset of itemsets that can be extracted from a database. An example of a code table
The standard code table is a specific code table which contains all singletons and only singletons. An example of a standard code table
Coverage and usage When a code table is defined, we can encode the database. To do so, the itemsets of the code table are considered one by one, from the longest to the shortest one, and from the most frequent to the less frequent. Each itemset of the code table is replaced in the transactions of the database by its associated code (the third column of the code table, Table 1). The transactions where the itemset is replaced are said to be “covered” by this itemset. The set of all itemsets of a code table
Code length Each selected itemset has also an associated code length which is inversely related to its usage for encoding the database (
Compression ratio The ratio between the length of the encoded database according to the code table and the length of the encoded database according to the standard code table is the compression ratio, denoted by
Note that the code lengths are not the lengths of the actual codes but a theoretical evaluation of the lengths, that is why they are real numbers. In KRIMP, and model evaluation based on MDL in general, the interesting part is not the actual codes but their size.
KRIMP-based algorithms The main idea behind KRIMP is to use a greedy algorithm to try to find the code table that compress the database the most. Roughly speaking, the steps of KRIMP over a database
Handling the data
In this section, we first briefly recall the representation of RDF graphs by lists of transactions, proposed in [21], in order to apply frequent pattern mining approaches. Second, we define a transaction-based representation for individual RDF updates. Finally, we present a running example which will serve to illustrate our newly proposed measures.
From RDF graphs to transactions
As seen in Section 2, in order to apply frequent itemset mining approaches on RDF data, we first need to represent them by lists of transactions. Such a representation must be an abstraction of the structural features of the RDF graph that can be useful to detect structural patterns. Although they might incur in some loss of information, this kind of transformations (i.e., propositionalizations [19]) are usually successfully applied to enable data mining and machine learning approaches over graphs, as in [44], for example.
In [21], we proposed two representations, namely the property-based (PB) representation and the property-class-based (PCB) representation, which provide different levels of detail. Both proved to be useful to detect differences in the structure of the graphs. However, we advocate the use of PCB as it provides a finer-grained representation of RDF graphs, and throughout this paper, we adopt it.
The PCB representation is defined at the level of resources, in terms of their types, their outgoing and ingoing properties, as well as the type of their related resources. Each resource is represented by a transaction. The set of items used in transactions is defined as follows.
Let
In other words, a PCB item represents either: a class c (e.g., “person”), an ingoing property
The representation of each resource of an RDF graph by a transaction is defined as follows.
Let r be a resource occurring in an RDF graph
In other words, each resource is represented by its set of adjacent edges/triples in the graph, with their adjacent nodes/resources being abstracted by their types. Thus, the transaction representing a resource through the PCB conversion is an abstraction of the resource neighborhood. The first motivation for the use of this abstraction is that we are interested in structural patterns at schema level, not by patterns involving specific resources. As a consequence, it can happen that different resources are represented by equivalent transactions. The second motivation for this abstraction is that the complexity of frequent pattern mining approaches is related to the number of unique items appearing in all transactions. Thus, the abstraction is necessary to guarantee the scalability of our measures.
Finally, the PCB representation of an entire RDF graph
In order to evaluate the evolution of RDF graphs, we also need to define a representation of RDF updates in terms of transactions, similar to the PCB representation of RDF graphs. Generically, an update can be seen as a pair of sets of triples
We therefore choose to represent an RDF update by two lists of transactions that represent the state of affected resources respectively before and after the update.

Example of an update with three affected resources.
Let
In the PCB conversion of an update, q is the initial state of the affected part of the RDF graph, and
An important remaining issue is about the granularity of RDF updates, i.e., the way modifications are grouped into updates. For example, DBpedia Live2
Let
Finally, we must remark that a local update is too small to apply data mining techniques, but not too small to be compressed with different code tables, which is the basis of the newly proposed measures. Otherwise, we could consider it as another RDF graph and use the global comparison method that is presented in the next section.
As a running example, let
Code table
Code table
Code table
Let
whose conversion into PCB representation would be:
Taking such a state as starting point, we could update it by inserting a new producer relationship, adding
and
We will use this example to illustrate the update measures presented in the following section.
In this section, we first recall the definition of the measure we introduced in [21] and then define two new measures about the structural similarity of an RDF graph and an RDF update w.r.t. one or several RDF graphs. In all three measures, we rely on the MDL principle by using code tables as models of the structure of RDF graphs. Along this section, given a knowledge base
Measuring structural similarity with patterns through compression
Following [21], we adopt the similarity of an RDF graph according to another RDF graph as the comparison of the compression ratios achieved by their respective code tables on the first graph. Intuitively, the main idea is that the better one database can be compressed with the code table of another database compared to its own code table, the closer the two databases are structurally. Indeed, this indicates that the two code tables contain similar structural patterns, although they have been obtained independently. Thus, we adopt the following definition of structural similarity measure.
Let
In other words, when comparing
A structural similarity close to 1 indicates that the compared RDF graph
For the comparison of local updates to different RDF graphs (e.g., different snapshots of our knowledge base), a difficulty is that the states of local updates are too small for computing a reliable code table that would represent their structures. Indeed, pattern mining techniques require large databases to extract statistically relevant patterns. In this context, we propose to rely on the classification properties of the code tables obtained via MDL principle-based algorithms [49,54]. According to [54], given a set of code tables
Let
When an order is defined between the RDF graphs, we can honor it when several of them are detected as the SCG of the same update state. For example, if a temporal order is established in
Running example Let us now apply this measure to the running example presented in Section 3.3. When we encode
If such items were not previously observed in the data (and thus, they were not in the code table), Laplace smoothing comes into play, penalizing more their usage.
Finally, to check whether a local update of an RDF graph respects its current structure, we focus on the difference between the previous and final states. We determine whether the update maintains the current structure of the RDF graph by comparing the quantity of information of the encoded transactions in its initial and final states.
Let
By relying on the decomposability of
Recall that
Running example Let us consider the running example and the values of the delta of information of u. As a reminder,
The encodings of the single items are bigger than the codes in the code table, so this delta is going to be positive. Regarding the other two terms in
In this section, we propose a method to apply the structural similarity measures presented in Section 4 to assess the evolution of an RDF graph, focusing on different levels of structural conformance. As we can see in Fig. 2, our proposal considers two granularity levels.
Different level details proposed for the assessment of the evolution of an RDF base using structural similarities.
In the remainder of this section, we detail the assessment of the evolution of a knowledge base at those two levels, and we present three different use cases analyzing the benefits that our proposal provides in each of them.
The global level of assessment permits us to structurally compare the global structural model of the knowledge base at the different times chosen by the administrator to define snapshots. The administrator chooses the snapshot times based on the planned evolution of the knowledge base, as well as on the available human and machine resources. This assessment makes it possible to quantify the structural differences between versions and can be used as a signal for potentially breaking evolution of the base data structure for the applications relying on it.
Figure 2 shows the timeline of such an evaluation. Once defined the sequence of snapshots (
From the definition of structural similarity, we can observe that computing Strong versioning: for each snapshot, we store the code table and the transaction database. Note that the transaction database of a snapshot requires much less space than the original RDF graph. Lightweight versioning: for each snapshot, we only store the code table.
Local assessment of the evolution
Being able to detect changes in the global structure of the data is important, but we should not neglect the small changes that occur in a more frequent way. In particular, the ability to detect problems at smaller scale would allow to raise detection alarms when the structure of the new updates diverges too much from the structure of the knowledge base. This is specially important in scenarios where information from different sources are integrated (e.g., the results of different automatic extraction tools, or of collaborative edition), as it would make it possible the early detection of discordance among the different sources of data.
At the local level, we propose two different evaluations that rely on the two measures that enable to compare an update to snapshots. They provide information about the impact of local updates on the evolution of the structural model (see Fig. 2).
State assessment From a set of snapshots, the structural evolution of the data can be checked by determining the closest graph for each of the updates (see Definition 8). In this case, given a local update
Thus, given a set of local updates U and a sequence of snapshots
In other words, we count how many final states are classified in each of the previous snapshots of our knowledge base. Ideally, if no schema evolution is expected, all of the updates should be classified in the latest snapshot. If this is not the case, this means that some updates still refer to an outdated snapshot of the knowledge base. If the updates come from different sources, identifying which local updates are outdated enables to identify the problematic data source, and fix it if possible. As an example, in an integration scenario with different ETL (Extract, Transform, Load) pipelines, we could detect outdated versions which are not following the new vocabulary usage guidelines.
Effect assessment Last but not least, we deal with the most common scenario: only the latest snapshot is given, and we want to evaluate each local update to know what is happening with the data as it evolves. The adequacy of a local update
A positive value implies that the update modifies the affected data into a state that is structurally closer to the snapshot structures. Thus, in scenarios of data cleaning, this would be a signal of good evolution.
A negative value implies that the udpate moves away from the snapshot structures. Note that this is not necessarily bad: the data might be evolving for many different reasons. In this case, the administrator has to evaluate whether this change was expected or not by inspecting the concerned local update.
Besides, as this evaluation is built on top of the encoding of the updates, the data administrator can find explanations for positive/negative delta values by comparing the patterns that are used in the encoding of the initial and final states respectively. For instance, if a pattern is used for the initial state but not for the final state, this indicates that some structure was lost through the update.
Use case scenarios
We here sketch three different potential use case scenarios that we envision, where our approach could directly show its benefits: large scale information extraction, collaborative edition, and information systems integration.
Large scale information extraction
In this use case, one would be facing a stable schema populated automatically by information extractors. Establishing the snapshots would allow to effectively detect problems with new versions of the different extractors both from the point of view of the processed sources (e.g., changes in the format of the tables), and from the point of view of the code of the extractors themselves (e.g., URLs wrongly crawled, typos in the URIs). In such a scenario, tracking the discrepancies in data can be extremely time consuming and difficult. Adopting a correct snapshot policy would allow us to detect the points in time where the discrepancies were introduced. Moreover, thanks to the explainability of our approach,5
The codification of the transactions can be translated directly into human-readable patterns. Two examples can be found at
When it comes to the collaborative edition of knowledge bases, Wikidata [52] comes to mind directly. In this scenario, one cannot expect that all the editors have the same expertise about the underlying schema, which might not exist, as it can evolve as the edition proceeds. Even if one could force the editors to use a predefined schema, the usage of the vocabulary from the point of view of the editors might be different, each of them focusing on different aspects of the input information. Our methodology would make it possible to track the editors’ performance, providing them feedback to focus their efforts (e.g., having the mined structure of the resources makes it easy to detect missing properties of a resource). In this regard, although we consider it future work, we could design an RDF editor tool that would provide guidance based on the structural patterns identified by our approach. A starting point could be the FORMULIS tool [22] that already provides some guidance through a form-based user interface.
Information systems integration
Last but not least, an interesting use case is the integration of the information distributed among different information systems to build a knowledge lake, a use case where the use of RDF brights the most. This scenario would be quite similar to the information extraction one, however, we would be dealing from the very beginning with structured information, under the governance of different teams, with different sharing and management policies. Even when one is working with well-formed ETL pipelines, one might face a lot of problems which might arise (e.g., incomplete data, delta updates which are differently versioned, data of the same domain coming from different information systems), where the knowledge engineer is completely blind. In fact, this summarizes well the daily activity of many companies.
In this scenario, our methodology could help detecting the evolution of the dataset via updates, but it would also allow us to track the quality of the different (possibly partial) dumps provided by the different integrated information systems, structural overlap and conflicts (e.g., systems storing the same information partially but with different structures), and so on. However, we acknowledge these three use cases as future work, being application fields where our methodology could be directly applied with benefits, but some extensions might be required to adjust to the optimal data granularity required.
Experimental evaluation
In this section, we present the experiments that have been conducted to assess the ability of the proposed measures to detect the evolution of a knowledge base. First, our implemented prototype and the experimental settings of our evaluation are explained. Then, the experiments on synthetic dataset are detailed in order to evaluate the measures in a controlled scenario. Finally, the experiments carried out in a real scenario dataset (DBpedia) are presented to show how our approach can be applied as well as its scalability.
Experimental settings
The prototype has been developed in Java 8, using Jena 3.4 to process the RDF data. All the different datasets as well as all the code used in the experiments can be found at
The code tables are computed thanks to an implementation of SLIM [49]6
We have used the SLIM2012 Vreeken et al.’s implementation.
The first experiments were conducted on synthetic data to show the behaviour of our approach in a controlled setting. Firstly, we evaluated the behaviour of the similarity measure (Definition 7) in the presence of regular datasets, and the influence of their relative size on such a measure. Secondly, we focused on checking whether our proposed delta (Definition 9) captured correctly the artificial alterations of the dataset. Finally, in order to position our proposal, we compare our measure to another one based on rdf2vec [44], which is based on graph embeddings.
Synthetic datasets
To generate the synthetic datasets, we used the LUBM data generator [14]. LUBM randomly generates data about universities and their staff, and is commonly used for benchmarking purposes. We must remark that we have selected LUBM instead of other possible synthetic data generators such as WatDiv [2] or gMark [3] on purpose: LUBM generates very regular datasets which allowed us to isolate, test and validate different properties of the proposed measures. We generated a dataset of 10 universities
Influence of the differences of size between datasets
For the first experiment, the 10 universities were considered and their descriptions were merged in order to create graphs of incrementally bigger sizes. To evaluate the structural similarity (Definition 7) under different size ratios, we proceeded as follows.
We built 9 pairs of merged graphs,
For each pair of merged graphs, their respective code tables were computed, and their structural similarity was measured in both directions.

Structural similarity values between the pairs of merged datasets.
Figure 3 shows the results. The x axis represents the separation index, i.e., the index in the set of universities (
Compression ratios of the merged graphs
At first sight, this could be seen as a signal that the relative size actually influences the similarity values, however this increase is due to the fact that the smaller dataset has less information to grasp during the data mining. This fact is shown as we delve further into the meaning of the measures, to see that Definition 7 can be rewritten as
This second experiment aims at checking the practical correctness of the delta of information (Definition 9), evaluating whether it captures the deviation of structure from the expected usages, and whether it measures such deviation proportionally to its actual divergence. The main idea is to generate updates such that their deviation from the current structure of the KB is known. Thus, starting from the regular dataset, we randomly altered some instances, while keeping track of the modifications. This way, we had two updates for each instance: the disrupting one, deviating the state of the instance from the current state to a potentially structurally wrong; and the restoring one, which restored the instance’s status to the original one. Our hypothesis was that the disrupting update should have a negative delta as it diverges from the structure, while the restoring update should have a positive delta. Besides, we also wanted to check whether the measured delta for each update actually captures the extent of the modification; to this end, we also varied the amount of alterations we performed to each instance.
Thus, we proceeded as follows.
The code table of the whole dataset was computed to extract the structures.7
For the complete 10 universities dataset, mining the patterns with SLIM took 20 s.
25,000 instances were randomly selected (representing ~10% of the instances in the dataset). This set of instances was frozen for the whole experiment in order to alter always the same instances.
Each selected instance was altered by applying random modifications to some of their triples, ranging from 10% to 50% of them. For each of the selected triples, we randomly applied one of the following modifications: 1) deleting the triple, 2) randomly modifying the property, and 3) randomly modifying the property value. In our setup, the probabilities of applying each one were 0.3 (delete), 0.4 (modify property), and 0.3 (modify object). All modification rates combined, we obtained 125,000 update pairs.
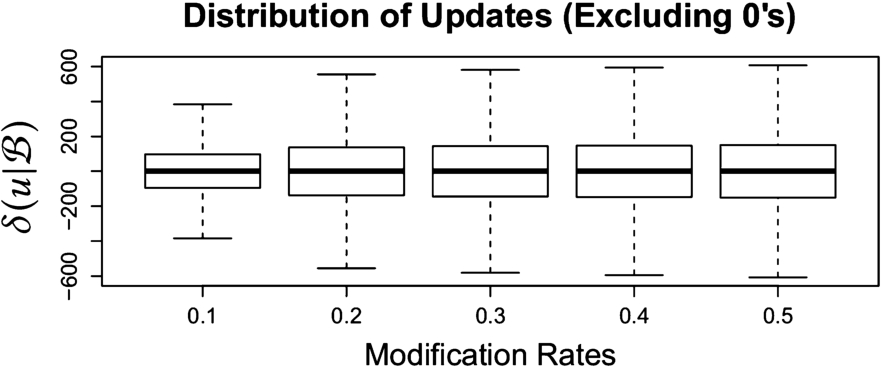
Distribution of

Means of the absolute values of the deltas.
Figure 4 shows the distribution of the delta values over all updates. We can see how the size of the deltas increases as the percentage of alterations is higher, showing that our measure is able to actually capture the divergence from the observed measures. Figure 5 shows the mean values of the absolute values of the deltas for each modification rate. Even though in the boxplot figures it is difficult to appreciate, the values steadily increase with the modifications.
Finally, we analyzed further the polarity of the delta value of the updates. Ideally, as above mentioned, in a pair of disrupting-restoring updates, the former should always be negative, and the latter positive. This happened in 97.67% of the 125000 update pairs. To discard any potential problem we analyzed the misclassified updates, which were caused by the randomness of the modifications: the amount of misclassified updates decreases as the percentage of modifications increases (1.41% for 0.1, 0.63% for 0.2, and the resting 0.29% was for 0.3 to 0.5 modification rates). While the datasets are really regular, there was still room to have small updates which improved structurally the data; however, the probability of witnessing this behaviour decreases as we increase the disruption, which is coherent with our proposal.
Given the attention that the different approaches based on graph embeddings have attracted lately, we have studied the applicability of rdf2vec [44] to the evaluation of updates, and how it compares to our approach. In short, their approach to obtain a graph embedding is based on treating each resource in an RDF graph as a word, generating random walks as sentences containing this word, and directly applying word2vec [28] on those generated sentences. This way, the authors obtain a graph embedding which has been proved to be successful in many tasks [44].
A first difference with our proposal is that this embedding does not focus on extracting any structural measure, but focuses on obtaining a representation of each single resource in the embedding space. Thus, we had to devise a measure of similarity in order to properly compare it to our encoding based proposal. In this case, we based our comparison on entity similarity, and, suggested by their authors [44], we used the cosine similarity between the resources’ vectors as a basis. Again, thanks to the regularity of the used dataset, we could safely assume that the resources belonging to a concept were going to be similar in the embedding space. Thus, we evaluated the effect of an update paying attention to the deltas of the similarities of the affected resources to the centroid of all the instances belonging to their same concept.
To calculate the effect of each update, we proceeded as follows. First, offline, we built the rdf2vec model of the dataset. Then, for each update
Apply
Obtain the affected resources of such update.
Generate new random walks for the affected resources.
Load a fresh base model.
Update the model with the new random walks.
Calculate the new centroids of the concepts, and the deltas of the cosine similarity of the affected resources.
We decided to load a fresh base model each time because updating the rdf2vec model with the random walks required to obtain the new representation of the affected resources after applying the update updated the whole model as well (i.e., all the vectors are affected). This way, we could use the rdf2vec model as an actual snapshot to perform a fair comparison. Note that in a continuous update scenario, this might derive in a continuous change of all the vectors in the space. Another possibility could have been to recalculate the model from scratch after each update, but it was too expensive and not feasible for our purposes.
Given that the update always had to be compared to the base model, we focused only on measuring the first kind of updates (i.e., the disrupting ones). Besides, given the scope of the test, we randomly sampled 100 updates for each modification rate. In Fig. 6, we can see the mean cosine similarity deltas of each update. The results are coherent with our measures, which reinforces our proposal: apart from discriminating updates, our approach provides a readable and interpretable model, which can be applied to a graph different from the training one, and is less costly.

Distribution of the average cosine similarity of the updates using rdf2vec.
To validate our proposal in a real setting we have performed an extensive experimental evaluation over different snapshots of DBpedia [20]. The aim of these experiments is two-fold: 1) showing the feasibility and scalability of our approach, and 2) implementing our methodology in a real scenario, analyzing whether it provided enough information to understand the evolution of the knowledge base. Thus, in this section, we first detail the particular experimental settings and implementation. Then, we present the results obtained following the proposal in Section 5. In Section 6.3.2, we assess the evolution of yearly snapshots of DBpedia. In Section 6.3.3, we evaluate the local updates between two periods via classification, and structural information across states.
DBpedia dataset and settings
To show the feasibility of our proposal in a challenging scenario, we have chosen DBpedia as a source of datasets and updates. On the one hand, the DBpedia project provides different versions, which we used as snapshots in our experiments. On the other hand, the DBpedia Live initiative gives access to intermediate smaller updates, which allowed us to recreate part of its fine-grained evolution. Without loss of generality, we restricted the vocabulary to be included in the snapshots to the DBpedia namespace (i.e.,
The specific list of files for each snapshot can be found on
Details of the DBpedia snapshots used in the experiments
Structural similarity through compression between the different snapshots of DBpedia:

For the DBpedia Live updates, we selected six months between 2015-10 and 2016-10 snapshots (starting in January 2016, the previous months were not available). In total, we considered the 22,495 DBpedia Live updates appearing during those first 6 months of 2016, out of around 900,000 ones applied between the two snapshots. Those 22,495 updates led to 249,619 local updates with an average of 2.43 transactions per local update.
For the extraction of the code tables, we selected a time threshold for each dataset snapshot that would allow us to obtain comparable compression ratios (and thus, ensure that the structures captured in the code tables contained a similar amount of information about the observed structures in their associated datasets). SLIM ran for 24 h on all snapshots except for 2015-10 and 2016-10, for which we had to make it run for 48 h in order to reach a similar compression ratio (
The first set of experiments aimed at checking whether the structural measure based on compression was capable to capture strong changes in a real deployment scenario. In Table 6, the measures between the different snapshots of DBpedia, and the associated color map are shown. The first column shows the compression ratio achieved for each snapshot, which represents the amount of structural information that the associated code table captures (the lower, the more information it has). Each cell of other columns contains the measure value,
Analysing the matrix of measures, there are clearly two clusters of snapshots ([3.6, 3.9] and [2015-10, 2016-10]), with snapshot 2014 being apart, as the measures between snapshots in a same cluster are generally lower than between different clusters. Regarding 2014 snapshot, we can see how our approach is able to detect a change compared to the previous versions (which coincided with a major versioning management change in DBpedia) as there is clearly a break in the structure. Focusing on each of the clusters, we can see how the values of the measure generally increase slower row-wise than column-wise when going from older snapshots to newer snapshots. This asymmetry can be explained by the fact that, as the dataset evolves and gets richer, as it is shown with the growing length of the transactions in Table 7, the structural patterns get longer. As a consequence, the transactions of the newer datasets can still be covered by the older patterns, while some transactions of the older datasets can no more be covered by the newer patterns. In the [3.6, 3.9] cluster, this is intensified by a reduction of the number of different structural patterns, appearing as a decreasing number of non-singletons through time in each dataset in Table 7. This is consistent with the observations we presented in [21].
Details of the code tables of the DBpedia snapshots relevant for execution times
Details of the code tables of the DBpedia snapshots relevant for execution times
Execution times of the comparisons (in seconds)
Execution times In Table 8, we can see the execution times of the different global comparisons performed in these experiments. Recall that the snapshots in the rows are the ones against which we compare the snapshots in the columns (i.e., we encode the transactions contained in the snapshots of the columns). Finally, note that all the comparisons take below 5 minutes, which shows the scalability of our approach.
Broadly speaking, the dominant components of the cost of the encoding of a database are the number of non-singleton codes that we have to check for each transaction, and the number of transactions.9
Note that the actual size of the transaction should be also in the equation, but it is usually much smaller than the other two terms, thus for the tendency we consider it to be a constant.
We acknowledge that there are more efficient ways to calculate the similarity, i.e., storing at least the size of a KB compressed with its own CT.

Execution times as a function of the size of the code table (its non-singleton codes) times the encoded transactions.
This first set of experiments on DBpedia snapshots showed the scalability of the global measure, as well as its capability to be an effective detector of changes between snapshots.
In this batch of experiments, we focused on evaluating the evolution of the data between snapshots. For this, we recreated the evolution of DBpedia in the six first months of 2016 by taking the updates from DBpedia Live, and applying them sequentially. For each of the DBpedia Live update files, we decomposed them into local updates, and computed their associated transactions (see Section 3.2). Then, we applied our proposed evaluation to assess potential structural deviations, and to assess each of the updates individually.
Classification of local updates in 2 and 3 DBpedia snapshots
Classification of local updates in 2 and 3 DBpedia snapshots

Information across states of the local updates on DBpedia along six months: a) distribution of
Updates evolution via classification As presented in Section 5.2, the code tables of the different snapshots of the knowledge base can be used in order to detect problems in the structure. For instance, when data from different sources are integrated or when the way of producing the data changes. In this set of experiments, the state assessment of the updates is used with the code tables of DBpedia 2014 and 2015-10 to see whether the new updates were globally coherent with the latter structure. Table 9 shows the classification of all the local updates between DBpedia 2014 and 2015-10. For the classification, only the final state of the update is considered. While in a real deployment the latest snapshot would not be available, we also consider DBpedia 2016-10 as a class (second and third rows) to check the actual evolution of the data. Finally, if the encoded length of two updates is equal, the classification hit is assigned to the most recent snapshot.
The first two rows of Table 9 present the comparison between two consecutive snapshots. When comparing 2015-10 and 2014 snapshots, most of the updates are classified by the latest code table (2015-10). However, around 5.54% of the updates are still classified as being part of the 2014 snapshot. Using the provenance of the updates, this could be a signal of outdated use of the schema by a particular source or indicate the expansion of the descriptions in a previously under-described part of the base by a particular source. The second row of the table shows how 2016-10 snapshot begins to accept part of the updates (4.77%) even though the proportion of applied updates is still far from being all the changes between the two snapshots (recall that we applied 6 months, 22,495 DBpedia Live updates out of about 900,000 ones, ~2.5% of the total). Finally, the third row of Table 9 presents the results when the three snapshots are taken into account in the analysis. In this last case, 1.26% of the updates are classified as being part of the latest snapshot. We consider this emergent value a good signal, as, while the status of the dataset is still far from 2016-10 snapshot (only ~2.5% of the updates between snapshots were applied), this indicates that the updates are forming structures specific to the next snapshot and our framework is able to detect them.
Single update evaluation Finally, we focused on the local evaluation of each of the updates regarding the current structure of the knowledge base. To do so, we performed the effects assesment of local updates presented in Section 5.2 using the two snapshots they were applied between. Again, we include the 2016-10 code table in the analysis as we want to check whether the measure could detect evolution of the data structure at this level, and which consequences this evolution would have in the resulting snapshot.
Figure 8.a) shows the global distribution of the updates according to their calculated deltas of information (
In order to validate this observation, we focused on what happened to the outliers of 2015-10, and depicted in Fig. 8.b) the timeline of such updates (ordered sequentially according their DBpedia Live ID). We can see there how according to 2015-10 we have different peaks of negative values which afterwards are softened in 2016-10. This is a strong evidence of them not being noisy modifications of the structure as their final structures are more relevant in the next snapshot of DBpedia, which is consistent with the classification results presented in the previous experiment. The important remark is that the measure can effectively detect those peaks and provide local information about the structure evolution to draw attention.
Finally, note that as we are always working with the code tables, the differences in the structure can also be explained exploiting the encoding of the states before and after each update.
The problem of assessing the evolution of the data in a knowledge base has many different potential approaches. Schema-driven approaches based on the used ontologies, such as Kontokotas et al. [18] and Rieß et al. [41], use a notion of quality based on the respect of explicit rules or patterns, either extracted from the ontology, or stated by an expert. In our approach, such patterns directly emerge from the actual usage of the data. In fact, we consider schema-driven approaches to be complementary to our approach as they give a different view on the evolution: they provide an a priori view on what should happen, while our approach allows to assess what has happened and what is happening during the evolution.
Several works have proposed methods for tracking and describing the differences between different versions of a KB. Papavasileiou et al. [31] define a language of descriptions of the changes between two versions of an ontology, both at low and high-levels of abstraction. Their approach differs from ours in the fact that they focus describing the delta between versions of a KB, while we propose to extract a model of each version that can be used for comparison and updates evaluation. Their approach could benefit from our detection of changes in data structures using data mining in order to improve their explanations. In a similar way, Roussakis et al. [45] propose another change description approach. Their proposal is closer to ours than the previous one, as it is focused on the changes at instance level. They define a new language of changes description, making it possible to detect specific change pattern previously identified by the method using generated SPARQL queries. These two approaches for change detection and their description [31,45] are complementary to our contribution. They focus on the analysis of the differences between two different versions of a KB, while our approach, on top of the evaluation of updates, focuses on the detection of differences that are large enough to be worth such analysis. Their fundamental difference comes from the fact that they both propose methods aimed at the direct comparison of complete versions, while our approach extracts a model of each version, which can be later exploited for comparisons at any granularity, giving more flexibility to the evaluation.
The closest approach to ours in the literature is proposed by Gonzaléz et al. [12]: They use Formal Concept Analysis [10] over RDF datasets to summarize and try to predict the changes in the vocabulary usage. Like our proposal, they propose a data-driven approach based on pattern mining techniques over RDF graphs. In particular, they extract the characteristic sets [30] of RDF graphs and use them to build the concept lattice representing the graph. The lattices of different versions can then be used to characterize their differences and to predict their next evolution. While the usage of lattices allowed the authors to do a prediction of future changes, the complexity of FCA algorithms forced them to reduce the expressivity of their conversion from RDF graph to transaction database. In constrast, our conversions from RDF to transactions are more expressive, the pattern mining algorithms that we use are more scalable, and our approach make it possible to evaluate the evolution of the dataset at a finer granularity.
Regarding the quality of the updates, Rashid et al. [40] proposed KBQ, a method for the assessment of the quality of updates by focusing on the persistence of resources and their completeness. They provide a more coarse-grained measure of the inner data structure than ours, as they assess quality mainly by counting the number of instances and the number of properties for each class, while we rely on precise emerging patterns. Maillot et al. [23] proposed a method to evaluate the quality of updates of a knowledge base based on the Jaccard similarity measure and the generation of relaxed queries. Our proposal handles the updates in a similar way to theirs, but gives more reliable results thanks to the usage of the MDL-based structural similarity measures. Regarding the integration of data sources, Collaran et al. [5] proposed MINTE, a method to merge RDF graphs minimizing redundancy and inconsistencies. To do so, they use a similarity measure based on ontological and graph-edit distance at RDF molecule level. In fact, they could use our different proposed measures to enrich their algorithms. More broadly, our work can be related to the field of datasets dynamics [12,48,50] as we give metrics to detect changes in datasets at both snapshot and update level. However, contrary to most approaches in this field, our goal is not to give a detailed resource or schema-level description of the evolution of the base, but to focus on the structural evolution of the graph itself.
Regarding the extracted patterns and their potential usages, we can find that our approach retains the explainability of the differences at the different detail levels, as it is trivial to extract the patterns in a more human-readable format.11
The interested reader can find two examples of this at
To the best of our knowledge, no other work have studied the evolution of RDF graphs using data mining techniques at the different granularity levels we propose. Most of the approaches related to the evolution of RDF graphs focus on the detection, description and classification of changes and their impact on the base consistency, while our approach is focused on giving an overview of the structural evolution of the graph.
In this paper we have addressed the problem of analyzing the evolution of the vocabulary usage in knowledge bases such as RDF graphs. Whereas existing approaches focus on monitoring how the vocabulary usage conforms to a fixed schema, we propose to mine structural patterns contained in data in order to take into account the variability of the usage. Our proposal relies on well established data mining techniques. We have defined two new similarity measures that allow to capture important changes in RDF graphs, both between a knowledge graph and its updates, and between different versions of the same knowledge base, called snapshots. We have also proposed a methodology to apply those measures, providing an assessment tool through the life cycle of the datasets. Last but not least, we have conducted experiments on both synthetic and real datasets (LUBM, DBpedia). The results have shown the ability of our proposal to detect turning points in the evolution of the structure of the data as well as its scalability.
As future work, we plan to further delve into the explainability of the differences between different RDF graphs, and between RDF graphs and the updates applied to them, by exploiting the patterns observed in the data. In addition, the patterns extracted from a knowledge base could be part of the describing metadata of a RDF graph, allowing, for example, to perform comparisons to assess integration of different datasets beforehand. Moreover, we want to explore the possibility of using them as skeletons for SHACL constrains.
Footnotes
Acknowledgements
This research work has been supported by projects TIN2016-78011-C4-3-R (AEI/FEDER, UE), project PEGASE (ANR-16-CE23-0011-08), and DGA/FEDER 2014-2020 “Construyendo Europa desde Aragón”.