This paper investigates how to facilitate users’ exploration through data graphs. The prime focus is on knowledge utility, i.e. increasing a user’s domain knowledge while exploring a data graph, which is crucial in the vast number of user-facing semantic web applications where the users are not experts in the domain. We introduce a highly unique exploration support mechanism underpinned by the subsumption theory for meaningful learning. A core algorithmic component for operationalising the subsumption theory for meaningful learning is the automatic identification of knowledge anchors in a data graph (). We present several metrics for identifying which are evaluated against familiar concepts in human cognitive structures. The second key component is a subsumption algorithm that utilises for generating exploration paths for knowledge expansion. The implementation of the algorithm is applied in the context of a Semantic data browser in a music domain. The resultant exploration paths are evaluated in a task-driven experimental user study compared to free data graph exploration. The findings show that exploration paths, based on subsumption and using knowledge anchors, lead to significantly higher increase in the users’ conceptual knowledge and better usability than free exploration of data graphs. The work opens a new avenue in semantic data exploration which investigates the link between learning and knowledge exploration. We provide the first framework that adopts educational theories to inform data graph exploration for knowledge expansion which extends the value of exploration and enables broader applications of data graphs in systems where the end users are not experts in the specific domain.
In recent years, RDF linked data graphs have become widely available on the Web and are being adopted in a range of user-facing applications offering search and exploration tasks. In contrast to regular search where the user has a specific need in mind and an idea of the expected search result [67], exploratory search is open-ended requiring significant amount of exploration [94], has an unclear information need [14], and is used to conduct learning and investigative tasks [60]. There are numerous examples from exploring resources in a new domain (like in academic research tasks) to browsing through large information spaces with many options (like exploring job opportunities, travel and accommodation offers, videos, music). Often, the users have no (or limited) familiarity with the specific domain. When users are novices to a domain, their cognitive structures about that domain are unlikely to match the complex knowledge structures of a data graph that represents the domain. This can have a negative impact on the exploration experience and effectiveness, as users may be unable to formulate appropriate knowledge retrieval queries (users do not know what they do not know [14]). Moreover, users can face an overwhelming amount of exploration options and may not be able to identify which exploration paths are most useful; this can lead to confusion, high cognitive load, frustration and feeling of being lost.
To overcome these challenges, appropriate ways to facilitate users’ exploration through data graphs are required. Research on exploration of data graphs has come a long way from initial works on presenting linked data in visual or textual forms [17,21]. Recent studies on data graph exploration have brought together research from related areas – Semantic Web, personalisation, adaptive hypermedia, and human-computer interaction – with the aim of reducing users’ cognitive load and providing support for knowledge exploration and discovery [27,28,100]. Several attempts have developed support for layman users, i.e. novices in the domain. Examples include: personalising the exploration path tailored to the user’s interests [79], presenting RDF patterns to give an overview of the domain [99], or providing graph visualisations to support navigation [70]. However, existing work on facilitating users’ exploration through data graphs has addressed mainly investigative tasks, omitting important exploratory search tasks linked to supporting learning.
The exploration of a data graph (if properly assisted) can lead to an increase in the user’s knowledge. This is similar to learning through search – an emerging research area in information retrieval [41,89], which argues that “searching for data on the Web should be considered an area in its own right for future research in the context of search as a learning activity” [51]. In the context of data graphs, learning while searching/exploring has not been studied. The closest to learning is research on tools for exploration of interlinked open educational resources [35]. However, this is a very specific context, and does not consider the generic context of learning while exploring data graphs in any domain. This generic learning context is addressed here.
The work presented in this paper opens a new avenue that studies learning through data graph exploration. It addresses a key challenge: how to support people who are not domain experts to explore data graphs in a way that can lead to expanding their domain knowledge. We investigate how to build automated ways for navigating through data graphs in order to add a new value to the exploration, which we call ‘knowledge utility’ – expanding one’s domain knowledge while exploring a data graph.1
We follow definitions of utility (i.e. reducing users’ cognitive load in knowledge retrieval) and usability (i.e. supporting users’ sense making and information exploration and discovery) [33].
Our earlier work showed that when exploring data graphs in unfamiliar or partially familiar domains, users serendipitously learn new things that they are unaware of [36,58,86]. However, not all exploration paths can be beneficial for knowledge expansion: paths may not bring new knowledge to the user leading to boredom, or may bring too many unfamiliar things so that the user becomes confused and overwhelmed [86].
The key contribution of this paper is a novel computational approach for generating exploration paths that can lead to expanding users’ domain knowledge. Our approach operationalises Ausbel’s subsumption theory for meaningful learning [9] which postulates that human cognitive structures are hierarchically organised with respect to levels of abstraction, generality, and inclusiveness of concepts; hence, familiar and inclusive entities are used as knowledge anchors to subsume new knowledge. Consequently, our approach to generate exploration paths includes:
computational methods for identifying knowledge anchors in a data graph (); and
algorithms for generating exploration paths by utilising the identified knowledge anchors.
To find possible knowledge anchors in a data graph, we utilise Rosch’s notion of Basic Level Objects (BLO) [76]. According to this notion, familiar category objects (e.g. the musical instrument Guitar) are at a level of abstraction called the basic level where the category’s members (e.g. Folk Guitar, Classical Guitar) share attributes (e.g. both have a neck and a bridge) that are not shared by members (e.g. Grand Piano, Upright Piano) of another category at the same level of abstraction such as Piano. We have adapted metrics from formal concept analysis for detecting knowledge anchors in data graphs. The metrics are applied on an existing data graph, and the output is evaluated against human Basic Level Objects in a Data Graph () derived via free-naming tasks.
To generate exploration paths, we first identify the closest knowledge anchor to be used as a starting point, from where we use subsumption to find a set of transition narratives to form a path that can expand the user’s knowledge. The effectiveness of our novel exploration approach is evaluated in a study with a Semantic data browser in the Music domain. Subsumption-based exploration paths are compared to free data graph exploration. The results show that when users have followed the suggested exploration paths, the increase of their knowledge was significantly higher and the usability was better.
The paper is structured as follows. Section 2 positions the work in the relevant literature and presents relevant theories. Section 3 presents experimental and theoretical foundations, including the application context for algorithm validation and the theoretical underpinning. Section 4 provides preliminaries with key definitions, followed by a formal description of metrics for identifying (Section 5). Section 6 describes an experimental study to validate the metrics against human . Section 7 describes a subsumption algorithm for generating exploration paths for knowledge expansion; then Section 8 presents a task-driven user study to evaluate the generated paths against free exploration. Section 9 discusses the findings, and Section 10 concludes the paper.
Related work
We will review relevant research on data graph exploration to justify the main contributions of our work, and will compare to existing approaches for identifying key entities and generating paths in data graphs. Since our work involves several evaluation steps, we review relevant evaluation approaches.
Exploration through data graphs
Semantic data exploration approaches are divided into two broad categories: (i) visualisation approaches [32,39,48,62] and (ii) text-based semantic data browsers [7,47,72,91]. Visualisation provides an important tool for exploration that leverages the human perception and analytical abilities to offer exploration trajectories. These approaches, in addition to intuitiveness, focus on the need for managing the dimensions in semantic data represented as properties, similarity and relatedness of concepts. The text-based browser approaches operate on semantically augmented data (e.g. tagged content) with layout browsing trajectories using relationships in the underpinning ontologies. These approaches adopt techniques from learning, human-computer interaction and personalisation to enhance the data exploration experience of users.
Visualisation approaches for data graph exploration
A state-of-the-art review of approaches that harness visualisation for exploratory discovery and analysis of linked data graphs is presented in [62]. Sheiderman’s seminal work on visual information seeking (overview first, zoom and filter, then details-on-demand) [82] is used to evaluate the usability and utility of these approaches and focuses on: (i) how well these approaches generate summary of data; (ii) how well they focus on finding relevant and important data; and (iii) what visualisation techniques are used. In [90], the authors utilise a cartographic metaphor and visual information seeking principles to offer overview of data based on instance types, and then automatically generating SPARQL queries based on search and interaction with a map. The focus of their work is the entry point of the vast data graph the users have to explore. There are numerous approaches to support visual SPARQL query construction and many of these works [49,83,102] have similar target audience, i.e. a layman user who is unfamiliar with the domain of the data graph. These works use visualisation techniques to help layman users to browse through large data graphs. For example the work in [83] introduced a graphical interface for semantic query construction which is based on the specification of SPARQL query language. The interface allows users to create SPARQL queries using a set of graphical notations and editing actions. The state-of-the-art in approaches to support visual SPARQL query construction is presented in [80]. The focus of these works is in supporting layman users to perform exploratory querying of RDF graphs in space and time, which themes with interactive visual query construction methods. The authors present a number of design principles to counter the challenges and evaluate them in a usability study on finding maps in a historical map repository [80]. Although these approaches hide the complexity of graph terminologies, they primarily focus on helping layman users to generate SPARQL queries instead of focusing on the properties of data graphs to guide users’ exploration. [66] presents work to manipulate data graph properties to guide exploration by helping users to focus on the most important bit of information about an entity first and then explore other related information. The approach utilises encyclopaedic knowledge patterns as relevance criteria for selecting, organising, and visualising knowledge. The patterns are discovered by mining the link structure of Wikipedia to build entity-centric summaries that can be exploited to help users in exploratory search tasks. However, this approach is feasible in multi-knowledge domains that are built by humans (e.g. Wikipedia) and may not be feasible in specific domains with complex structures. Also, the approach considers one level below the root, and does not cover entities at different abstraction levels.
These visualization efforts are geared towards helping layman users to explore complex graph structures by hiding the complexity of semantic terminology. However, the effectiveness of any visualization depends on the user’s ability to make sense of the graphical representation which in many cases can be rather complex. Users who are new to the domain may struggle to grasp the complexity of the knowledge presented in the visualisation. Our approach to automatically identify entities that are close to the human cognitive structures can be used as complementary to visualisation approaches to simplify the data graph by pointing at entities that layman users can be familiar with. The prime focus of our approach is providing exploration paths to augment users’ interaction in text-based data browsers by, which are reviewed next.
Text-based semantic data browsers
Two types of semantic data browsers had emerged since the early days – (i) pivoting (or set-oriented browsing) browsers and (ii) multi-pivoting browsers. In a pivoting browser, a many-to-many graph browsing technique is used to help a user navigate from a set of instances in the graph through common links [72]. Exploration is often restricted to a single starting point and uses ‘a resource at a time’ to navigate anywhere in the data graph [7]. This form of browsing is referred to as uni-focal browsing. Another type of browsing is multi-pivoting where the user starts from multiple points of interest, e.g. [43,47,49,91].
A noteworthy variation of the pivoting approach is the use of facets for text-based data browsing of linked datasets. Faceted browsing is the main approach for exploratory search in many applications. The approach employs classification and properties features from linked datasets as a mean to offer facets and context of exploration. Facet Graphs [44], gFacet [46], and tFacet [24], are early efforts in this area. More recent attempts include Rhizomer [23], which combines navigation menus and maps to provide flexible exploration between different classes; Facete [84], a visualization-based exploration tool that offers faceted filtering functionalities; Hippalus [68], which allows users to rank the facets according to their preferences; Voyager [96], which couples faceted browsing with visualization recommendation to support users exploration; and SynopsViz [19], which provides faceted browsing and filtering RDF over classes and properties. Although these approaches provide support for user exploration, layman users who are performing exploratory search tasks to learn or investigate a new topic, can be cognitively overloaded, especially when the facets provide many options (i.e. multiple links) for the users to explore. The authors in [99] proposed Sview, a browser that utilises a link pattern-based mechanism for entity-centric exploration over Linked Data. Link patterns describe explicit and implicit relationships between entities and are used to categorise linked entities. A link pattern hierarchy is constructed using Formal Concept Analysis (FCA), and three measures are used to select the top-k patterns from the hierarchy. The approach does not consider the user perspective when identifying link patterns to support exploratory search, which would make browsing challenging especially in unfamiliar domains.
Personalisation approaches consider the user’s profile and interests to adapt the exploration to the user’s needs. An approach that explicitly targets personalisation in semantic data exploration using users’ interests is presented in [78]. Recent approaches aim to improve search efficiency over Linked Data graphs by considering user interests [77] or to diversify the user exploration paths with recommendations based on the browsing history [34]. A method for personalised access to Linked Data has been suggested in [37] based on collaborative filtering that estimates the similarity between users, and produces resource recommendations from users with similar tastes. A graph-based recommendation methodology based on a personalised PageRank algorithm has been proposed in [64]. The approach in [18] allows the user to rate semantic associations represented as chains of relations to reveal interesting and unknown connections between entities for personalised recommendations.
The above approaches stress the importance of tailoring the exploration to users. None of them investigates users’ familiarity with the domain, which is the main focus of the approach we present here, where familiarity is related to domain understanding and knowledge expansion. Moreover, conventional personalisation approaches suffer from the ‘cold start’ problem – for a reliable user model to be obtained, the users have to spend time interacting with the system to provide sufficient information about their interests. Instead, we exploit the structure of a data graph to identify entities that are likely to be familiar to the users, which overcomes the cold start problem. Strictly considered our approach is not personalisation, because we do not dynamically adapt to the user’s knowledge as it expands while the user browses through the data graph. However, knowledge anchors are a way to approximate what entities in a domain can be familiar to the users, and are used for generating navigation paths.
show that there are 3360 interlinked, heterogeneous datasets containing approximately 3.9 billion facts. The volume and heterogeneity of such datasets makes their processing for the purpose of exploration a daunting challenge. Utilisation of various computational models makes it possible to handle this challenge in order to offer fruitful exploration of semantic data. Finding key entities in a data graph is an important aspect of such computational models and is generally implemented using ontology summarization [98] and Formal Concept Analysis (FCA) [95] techniques.
Ontology summarisation has been seen as an important method to help ontology engineers to make sense of an ontology, in order to understand, reuse and build new ontologies [39,56]. Summarising an ontology involves identifying the key concepts in an ontology [93]. An ontology summary should be concise, yet it needs to convey enough information to enable ontology understanding and to provide sufficient coverage of the entire ontology [88]. Centrality measures have been used in [98] to identify key concepts and produce RDF summaries. The notion of relevance based on the relative cardinality and the in/out degree centrality of a node has been used in [87] to produce graph summaries. The approach presented in [88] exploits the structure and the semantic relationships of a data graph to identify the most important entities using the notion of relevance, which is based on relative cardinality (i.e. judging the importance of an entity from the instances it contains) and the in/out degree centrality (i.e. the number and type of the incoming and outgoing edges) of an entity.
The closest ontology summarisation approach to the context of our work deals with extracting key concepts in an ontology [25,69]. It highlights the value of cognitive natural categories for identifying key concepts to aid ontology engineers to better understand the ontology and quickly judge the suitability of an ontology in a knowledge engineering project. The authors applies a name simplicity approach, which is inspired by the cognitive science notion of Basic Level Objects (BLO) [76] as a way to filter entities with lengthy labels for the ontology summary. The work in [25] has utilised BLO to extract ontologies from collaborative tags. A metric based on the category utility is proposed to identify basic concepts from collaborative tags, where tags of a concept are inherited by its sub-concepts and a concept has all instances of its descendants. However, these approaches focus on the experimental side, and do not adopt the formal definitions of BLO and cue validity described in [75,76] in the context of a data graph. Our work operationalises these formal definitions by developing several metrics for identifying knowledge anchors in a data graph.
Formal Concept Analysis (FCA) is a method for analysis of object-attribute data tables [95], where data is represented as a table describing objects (i.e. taxonomical concepts), attributes and their relationships. FCA has been applied in different application areas [30,71] such as Web mining and ontology engineering. In Web mining, FCA based approaches have been used to improve the quality of search results presented to the end users. For example, the work in [29] has developed a personalised domain-specific search system that uses logs of keywords and Web pages previously entered and visited by other persons to build a concept lattice. More recently, FCA has been applied to construct a link pattern hierarchy to organise semantic links between entities in a data graph [99]. In ontology engineering, FCA has been used in two topics: ontology construction and ontology refinement. The work in [74] uses FCA to construct ad hoc ontologies to help the user to better understand the research domain. In [81] the authors present OntoComp, an approach for supporting ontology engineers to check whether an OWL ontology covers all relevant concepts in a domain, and supports the engineers to refine (extend) the ontology with missing concepts. The psychological approaches to basic level concepts have been formally defined for selecting important formal concepts in a concept lattice by considering the cohesion of a formal concept [15]. This measures the pair-wise similarity between the concept’s objects based on common attributes. More recently, the work in [16] has reviewed and formalised the main existing psychological approaches to basic level concepts. Five approaches to basic level objects have been formalised with FCA [16]. The approaches utilise the validity of formal concepts to produce informative concepts capable of reducing the user’s overload from a large number of concepts supplied to the user.
Existing studies in ontology summarisation and FCA utilise BLO to identify key concepts in an ontology in order to help experts to examine or reengineer the ontology. They have been evaluated with domain experts, and are applicable in tasks where the users have a good understanding of the domain. In contrast, we apply the notion of BLO in a data graph to identify concepts which are likely to be familiar to users who are not domain experts. Focusing on layman users, we provide unique contribution that adopts Rosch’s seminal cognitive science work [76] to devise algorithms that identify (i) that represent familiar graph entities, and (ii) which correspond to human cognitive structures over a data graph. Crucially, these algorithms are validated with layman users who are not domain experts.
Generating paths in data graphs
In data graphs, the notion of path queries uses regular expressions to indicate start and end entities of paths in data graphs [22]. For example, in a geographical graph database representing neighborhoods (i.e. places) as entities and transport facilities (e.g. Bus, Tram) as edges, the user writes a simple query such as “I need to go from Place a to Place b”, and the user is then provided with different transportations facilities going through different routes (paths) starting from Place a to reach the destination Place b [22]. Another used notion is property paths which specify the possible routes between two entities in a data graph. Property paths are used to capture associations between entities in data graphs where an association from entity a to entity b comprises entity labels and edges [6]. However, in data graphs there are usually high numbers of associations (i.e. possible property paths) between the entities and ways to refine and filter the possible paths, are required. To tackle this challenge, the work in [28] presented Explass3
http://ws.nju.edu.cn/explass/
for recommending patterns (i.e. paths) between entities in a data graph. A pattern represents a sequence of classes and relationships (edges). Explass uses frequency of a pattern to reflect its relevance to the query. It also uses informativeness of classes and relationships in the pattern to indicate its informativeness by adding the informativeness of all classes and relationships. Relfinder4
http://relfinder.dbpedia.org
[45] provides an approach for helping users to get an overview of how two entities are associated together by showing all possible paths between these entities in the data graph. Discovery Hub [61] is another approach that offers faceted browsing and multiple results explanations features to drive the user in unexpected browsing paths. The work in [92] presents a linked data based exploratory search feature for retrieving topic suggestions based on the user’s query and a set of heuristics, such as frequency of entities, events and places. The notions of knowledge patterns and type-property paths have been used in [73] to support querying RDF datasets. Central types and properties in paths are extracted based on their centrality in the RDF graph and used to construct a knowledge architecture of the graph. More recently, the work in [59] proposes a serendipity model to extract paths between items in the graph based on novelty of items, which is used for serendipitous recommendations.
While several approaches address the problem of supporting users’ exploration through data graphs, none of them aims at supporting layman users who are not domain experts. Many of the existing approaches may not be suitable for layman users, who may become confused or overloaded with too much unfamiliar entities. None of the existing approaches offers exploration paths to help users to expand their domain knowledge. Several approaches generate paths that link graph entities specified by the user, and are therefore suitable for tasks where the users are familiar with the domain. Instead, we provide paths for uni-focal exploration where the user starts from a single entry point and explores the data graph. The unique feature of our work is the explicit consideration of knowledge utility of exploration paths. We are finding entities that are likely to be familiar to the user and using them as knowledge anchors to gradually introduce unfamiliar entities and facilitate learning. This can enhance the usability of semantic data exploration systems, especially when the users are not domain experts. Therefore, our work can facilitate further adoption of linked data exploration in the learning domain. It can also be useful in other applications to facilitate the exploration by users who are not familiar with the domain presented in the graph.
Data exploration evaluation approaches
In the context of ontology summarisation, there are two main approaches for evaluating a user-driven ontology summary [56]: gold standard evaluation, where the quality of the summary is expressed by its similarity to a manually built ontology by domain experts, or corpus coverage evaluation, in which the quality of the ontology is represented by its appropriateness to cover the topic of a corpus. The evaluation approach used in [69] included identifying a gold standard by asking ontology engineers to select a number of concepts they considered the most representative for summarising an ontology. In this paper, we evaluate algorithms for identifying by comparing the algorithms’ outputs versus a benchmarking set of BLO identified by humans. To the best of our knowledge, there are no evaluation approaches that consider key concepts in data graphs which correspond to cognitive structures of users who are not domain experts. Our evaluation approach that identifies through an experimental method adapting Cognitive Science methods is novel and can be applied to a range of domains.
Evaluation of data exploration applications usually considers the exploration utility from a user’s point of view or analyses the application’s usability and performance (e.g. precision, recall, speed etc.) [62]. The prime focus is assessing the usability of semantic Web applications, while assessing how well the applications help the users with their data exploration tasks is still a key challenge [40]. Task driven user studies have been utilised to assess whether a data exploration application provides useful recommendations for accomplishing users exploration tasks [66]. A task driven benchmark for evaluating semantic data exploration has been presented in [40]. The benchmark presents a set of information-seeking tasks and metrics for measuring the effectiveness of completing the tasks. The evaluation approach in [54] aims to identify whether the simulated exploration paths information networks are similar to those produced by human exploration. We will adopts the established task-based approach and will utilise an educational taxonomy for assessing conceptual knowledge to assess knowledge utility and usability of the generated exploration paths.
Experimental and theoretical foundation
Application context
Our novel data graph exploration approach includes several algorithms which are formally defined and are independent from the domain and the data graph used. In order to validate the approach and evaluate the algorithms, we need a concrete application context. We will utilise MusicPinta – a semantic data browser in the music domain [86]. MusicPinta provides a uni-focal interface for users to navigate through musical instrument information extracted from various linked datasets. The MusicPinta dataset includes several sources, including DBpedia5
http://dbpedia.org/About
for musical instruments and artists, extracted using SPARQL CONSTRUCT queries. The DBTune6
http://dbtune.org/
dataset is utilised for music-related structured data. Among the datasets on DBTune.org we utilise: (i) Jamendo which is a large repository of Creative Commons licensed music; (ii) Megatune is an independent music label; and (iii) MusicBrainz is a community-maintained open source encyclopaedia of music information. The dataset coming from DBTune.org (such as MusicBrainz, Jamendo and Megatunes) already contains the “sameAs” links between them for linking same entities. We utilise the “sameAs” links provided by DBpedia to link MusicBrainz and DBpedia datasets. In this way, DBpedia is linked to the rest of the datasets from DBtune.org, enabling exploration via rich interconnected datasets.
The MusicPinta dataset has 2.4M entities and 19M triple statements, taking 2 GB physical space, including 876 musical instruments entities, 71k (performances, albums, records, tracks), and 188k music artists. The dataset is made available on sourceforge.7
http://sourceforge.net/p/pinta/code/38/tree/
All datasets in MusicPinta are available as a linked RDF data graph and the Music ontology8
http://musicontology.com/
is the ontology used as the schema to interlink them.
Main characteristics of MusicPinta data graph. The data graph includes five class hierarchies. Each class hierarchy has number of classes linked vie the subsumption relationship rdfs:subClassOf. DBpedia categories are linked to classes via the dcterms:subject relationship, and classes are linked via domain-specific relationship MusicOntology:instrument to musical performances. The depth of a class hierarchy is the maximum depth value for entities in the class hierarchy
Instrument class hierarchy
No. of classes
No. of DBpedia categories
No. of music performances
Depth
String
151
255
348
7
Wind
108
161
1539
7
Percussion
82
182
127
5
Electronic
16
7
11
1
Other
7
0
2
1
The MusicPinta dataset provides an adequate setup since it is fairly large and diverse, yet of manageable size for experimentation. The music ontology provides sufficient class hierarchy for experimentation. For instance, the class hierarchies for the String and Wind musical instruments have depths of 7, which is considered ideal for applying the cognitive science notion of basic level objects [76] on data graphs, as this notion states that objects within a hierarchy are classified at least three different levels of abstraction (superordinate, basic, subordinate). Figures 1–3 show examples of the user interface in the MusicPinta semantic data browser.
Semantic search interface in MusicPinta where a user inserts a name of a musical instrument (e.g. Xylophone).
Description page of the entity ‘Xylophone’ in MusicPinta, extracted from DBpedia using CONSTRUCT queries.
Semantic Links (i.e. predicates) related to entity Xylophone presented in Features and Relevant Information. Features include semantic relationships rdf:type (e.g. Xylophone is an instrument), rdfs:subclassOf (e.g. subClass Xylophone belongs to superClass Tuned Percussion) and dcterms:subject (e.g. Xylophone belongs to DBpedia category Greek loanwords). Relevant Information include rdfs:subclassOf (e.g. Celesta is subClassOf Xylophone).
Knowledge utility of an exploration path
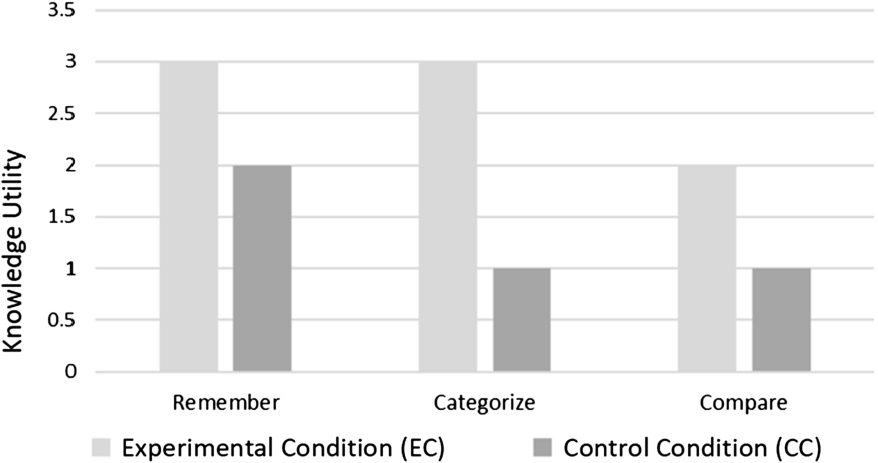
To approximate the knowledge utility of an exploration path, we need a systematic approach. For this, we adapt the well-known taxonomy by Bloom [52] which is used for assessing conceptual knowledge. The taxonomy identifies a set of progressively complex learning objectives that can be used to assess learning experiences over information seeking and search tasks [38]. It suggests linking knowledge to six cognitive processes: remember, understand, apply, analyze, evaluate, and create. Among these, remember and understand are directly related to browsing and exploration activities. The remaining processes require deeper learning activities, which usually happen outside a browsing tool, in our case Semantic data browser, and hence will not be considered. The process remember is about retrieving relevant knowledge from the long-term memory, and includes recognition (locating knowledge) and recall (retrieving it from memory) [52]. The process understand is about constructing meaning; the most relevant to our context are categorise (determine entity membership) and compare (detect similarities) [52].
To approximate the knowledge utility of an exploration path, we employ schema activation – it was applied for assessing user knowledge expansion when reading text [26]. To assess the user’s knowledge of a target domain concept (X), the user is asked to name concepts that belongs to and are similar to the target concept X. A schema activation test is conducted before an exploration and after an exploration, using three questions related to the cognitive processes remember, categories, and compare:
Q1 [remember]What comes in your mind when you hear the word X?;
Q2 [categorise]What musical instrument categories does X belong to?;
Q3 [compare]What musical instruments are similar to X?
The number of accurate concepts named (e.g. naming an entity with its exact name, or with a parent or with a member of the entity) by the user before and after exploration is counted, and the difference indicates the knowledge utility of the exploration. For example, if a user could name correctly two musical instruments similar to the musical instrument Biwa (Q3) before an exploration and then the user could name correctly six names of musical instruments similar to the instrument Biwa after the exploration, then the effect of the exploration on the cognitive process compare is indicated as 4 (i.e. as a result of the exploration the user learned 4 new similar musical instruments to the musical instrument Biwa). If the user named only one instrument after the exploration, the user knowledge did not increase, and the knowledge utility will be counted as zero.
Subsumption theory underpinning exploration
In a scoping user study, we examined user exploration of musical instruments in MusicPinta to identify what strategies would lead to paths with high knowledge utility (details of the study are given in [5]). We examined two dimensions – the user’s familiarity with the domain and the density of entities in the data graph. Paths which included familiar and dense entities and brought unfamiliar entities led to increasing the users’ knowledge. For example, when a participant was directed to explore the entity Guitar which he/she was familiar with, the participant could see unfamiliar entities linked to Guitar such as Resonator Guitar and Dobro. The entity Guitar served as an anchor from where the user made links to new concepts (Resonator Guitar and Dobro). We also noted that the dense entities, which had many subclasses and were well-connected in the graph, provided good potential anchors that could serve as bridges to learn new concepts.
While the scoping study provided us with useful insights, it did not give solid theoretical model for developing an approach that generalises across domains and data graphs. The study findings directed us to Ausubel’s subsumption theory for meaningful learning [9] as a possible theoretical underpinning model for generating exploration paths. This theory [8–10,12] has been based on the premise that a human cognitive structure (i.e. individual’s organisation, stability, and clarity of knowledge in a particular subject matter field) is the main factor that influences the learning and retention of new knowledge [10]. In relation to meaningful learning, the subsumption process postulates that a human cognitive structure is hierarchically organised with respect to levels of abstraction, generality, and inclusiveness of concepts. Highly inclusive concepts in the cognitive structure can be used as knowledge anchors to subsume and learn new, less inclusive, sub-concepts through meaningful relationships [8,9,11,13]. Once the knowledge anchors are identified, attention can be directed towards identifying the presentation and sequential arrangement of the new subsumed content [10]. Hence, to subsume new knowledge, anchoring concepts are first introduced to the user, and then used to introduce new concepts.
Basic level objects
To identifying knowledge anchors in data graphs, we need to find entities that can be highly inclusive and familiar to the users. For this, we will adopt the Basic Level Objects (BLO) notion which was introduced by Cognitive science research. It states that domains of concrete objects include familiar categories that exist at an inclusive level of abstraction in human cognitive structures (called the basic level). Most people are likely to recognise and identify objects at the basic level. An example from the experimental studies from Rosch et al. [76] of a BLO in the music domain is Guitar. Guitar represents a familiar category that is neither too generic (e.g. musical instrument) nor too specific (e.g. Folk Guitar – subclass of the category Guitar).
Rosch, et al. [76], define BLO as: categories that “carry the most information, possess the highest category cue validity, and are, thus, the most differentiated from one another”. Crucial for identifying basic level categories is calculating cue validity: “the validity of a given cue x as a predictor of a given category y (the conditional probability of ) increases as the frequency with which cue x is associated with category y increases and decreases as the frequency with which cue x is associated with categories other than y increases” [76]. A members of a BLO share many features (attributes) together, and hence they have high similarity values in terms of the feature the BLO members share. Consequently, two approaches can be applied to identify BLO in a domain taxonomy:
Distinctiveness (highest cue validity). This follows the formal definition of cue validity (given above). It identifies most differentiated category objects in a domain. A differentiated category object has most (or all) of its cues (i.e. attributes) linked to its members (i.e. subclasses of the category object) only, and not linked to other category objects in the taxonomy. Each entity linked to one (or more) members of the category object will have a single validity value used as a predictor for the distinctiveness of the category among other category objects in the taxonomy. For example, the category object in Fig. 4 has four entities (, , , ) linked to its members (, , , ). The validity of entity as predictor of category is higher than entity , since is only linked to members of the category whereas entity is linked to members of the categories and .
A data graph showing entities and relationship types between entities.
Homogeneity (highest commonality between category members). This identifies category objects whose members have high similarity values. The higher the similarity between category members, the more likely it is that the category object is at the basic level of abstraction. This is complementary with the distinctiveness feature described above. A category object with high cue validity will usually have high number of entities shared by its members. The homogeneity value for a category object considers the pair-wise similarity values between the category’s members. For example in Fig. 4, the category entity considers the pairwise similarities between its members (e.g. similarity between [, ], [, ], [, ]). The higher the similarity between members of that category, the more likely that the category is at the basic level.
In the following sections, we will utilise Ausbel’s subsumption theory to generate exploration paths through data graphs based on knowledge anchors. We will split this into two stages: (i) identifying knowledge anchors in data graphs, and (ii) using the knowledge anchors to subsume new knowledge.
Preliminaries
We provide here the main definitions that will be used in the formal description of the algorithms.
RDF describes entities and attributes (edges) in the data graph, represented as RDF statements. Each statement is a triple of the form <Subject – Predicate – Object> [20]. The Subject and Predicate denote entities in the graph. An Object is either a URI or a string. Each Predicate URI denotes a directed attribute with Subject as a source and Object as a target.
(Data graph).
Formally, a data graph is a labelled directed graph , depicting a set of RDF triples where:
is a finite set of entities;
is a finite set of edge labels;
is a finite set of triples where each triple is a proposition in the form of with , where is the Subject (source entity) and is the Object (target entity); and is the Predicate (edge label).
In our analysis of data graphs, the set of entities V will mainly consist of the concepts of the ontology and can also include individual objects (instances of concepts). The edge labels will correspond to semantic relationships between concepts and individual objects. These labels include the subsumption relationship rdfs:subclassOf and the rdf:type relationship. For a given entity , we will be interested primarily in its direct and inferred subclasses, and instances. The set of entities V can be divided further by using the rdfs:subclassOf subsumption relationship denoted as ⊆) and following its transitivity inference. This includes:
Root entity (r) which is superclass for all entities in the domain;
Category entities () which are the set of all inner entities (other than the root entity r), that have at least one subclass, and may also include some individual objects;
Leaf entities () which are the set of entities that have no subclasses, and may have one or more individuals.
Starting from the root entity r, the class hierarchy in a data graph is the set of all entities linked via the subsumption relationship rdfs:subClassOf. The set of entities in the class hierarchy include the root entity r, Category entities C and Leaf entities L.
The set of edge labels E is divided further considering two relationship categories:
Hierarchical relationships (H) is a set of subsumption relationships between the Subject and Object entities in the corresponding triples.
Domain-specific relationships (D) represent relevant links in the domain, other than hierarchical links, e.g. in a music domain, instruments used in the same performance are related.
(Data graph trajectory).
A trajectory J in a data graph is defined as a sequence of entities and edge labels within the data graph in the form of , where:
, ;
, ;
and are the first and the last entities of the data graph trajectory J, respectively;
n is the length of the data graph trajectory J.
(Entity depth).
The depth of an entity is the length of the shortest data graph trajectory from the entity v to the root entity r in the class hierarchy of the data graph.
(Exploration path).
An exploration path P in a data graph is a sequence of finite set of transition narratives generated in the form of: , where:
, ;
and are the first and last entities of the exploration path P, respectively;
m is the length of the exploration path P;
, is a text string that represents a narrative script;
presents a transition from to , which is enabled by the narrative script . Note that an exploration path P is different from a data graph trajectory J in that and in P may not be directly linked via an edge label, i.e. the transition from to in P can be either via direct link, an edge, or through an implicit link, a trajectory.
Our ultimate goal is to provide an automated way to generate an exploration path P. This is achieved in two steps: (i) identifying entities that can serve as knowledge anchors (described in Section 5) and (ii) utilising these knowledge anchors and the subsumption strategy (described in Section 3.3) to generate an exploration path (described in Section 7).
Identifying knowledge anchors in data graphs
In Section 3 we highlighted and justified the need for two approaches to identify knowledge anchors in a data graph: distinctiveness and homogeneity. We adopt metrics from FCA to define such distinctiveness and homogeneity matrices.
Distinctiveness metrics
This group of metrics aims to identify differentiated categories whose members are linked to distinctive entities that are shared amongst the categories’ members but not with other categories. Each category entity that is linked through an edge label e to members of the category entity will have a single validity value to distinguish v from the other category entities. We follow the definition of cue validity provided by Rosch et al. [76] in identifying basic level objects. According to Rosch et al., “the cue validity of an entire category may be defined as the summation of the cue validities for that category of each of the attributes of the category”. This definition is similar to the approach used to identify key concepts in formal concept analysis [16] where they summed up the validity of objects of a formal concept. Three distinctiveness metrics were developed and presented in [3].
Attribute Validity (AV). The attribute validity definition corresponds to the cue validity definition in [76] and adopts the formula from [16]. We use ‘attribute validity’ to indicate the association with data graphs – ‘cues’ in data graphs are attributes of the entities and are represented as relationships in terms of triples. The AV value of an entity with respect to a relationship type e, is calculated as the aggregation of the AV values for all entities linked to subclasses . The attribute validity value of increases, as the number of relationships of type e between and the subclasses increases; whereas the attribute validity value of decreases as the number of relationships of type e between and all entities in the data graph increases. We define the set of entities that are related to the subclasses as subjects via relationship of type e:
Formula (2) defines the attribute validity metric for a given entity v with regards to a relationship type e.
An example is provided in Fig. 4. The AV value for category entity with regard the domain-specific relationship D is the aggregation of the AV values of the subject entities , , , linked to members of the category entity (i.e. objects, , , ) via the edge label or predicate D.
The AV value for the entity equals the number of triples between the subject entity and members of the category (the object entities , ) via the relationship D (i.e. 2 triples), divided by the number of triples between the subject entity and all the object entities in the graph (i.e. , , ) via the relationship D (i.e. 3 triples). Hence the AV value for equals . The aggregation of the individual AV values for entities , , , will identify the AV value for the category entity .
Category Attribute Collocation (CAC). This approach was used in [50] to improve the cue validity metric by adding a homogeneity weight called category-feature collocation measure which takes into account the frequency of the attribute within the members of the category. This gives preference to ‘good’ categories that have many attributes shared by their members (i.e. high similarity between members of the category). In our case, a good category will be an entity with a high number of relationships of type e between and the subclasses : , relative to the number of its subclasses. Formula (3) defines the category-attribute collocation metric for a given entity v with regard to a relationship type e.
Considering the example in Fig. 4 for identifying the AV value for the entity , and considering the relationship D, the CAC adds a weight of (the number of the triples between the subject and the members of via the relationship D divided by the number of members of the category entity . Hence the CAC of will be the AV value of (i.e., ) multiplied by (2/4), equal to 0.33. The aggregation of individual CAC values for entities , , , will identify the CAC value for .
Category Utility (CU). This approach was presented in [31] as an alternative metric for obtaining categories at the basic level object. The metric takes into account that a category is useful if it can improve the ability to predict the attributes for members of the category, i.e. a good category will have many attributes shared by its members (as mentioned in the category-attribute collocation metric), and at the same time, it possess ‘unique’ attributes that are not related to many other categories in the graph. In other words, CU gives preference to a category that have unique attributes associated only with the category’s members. We adapt the formula in [16] for a data graph:
Continuing the previous example from Fig. 4 for calculating the AV and the CAC values for entity ; in addition to the category-feature collocation measure used by the CAC value, the CU will also include the proportion of all triples between the subject entity and all the object entities in the graph (i.e. entities , , ) linked via relationship D (i.e. 3 triples) over the number of entities linked via subsumption relationships (e.g. rdfs:subClassOf and rdf:type) in the graph (i.e. total 11 entities). Hence the CU value for will be: . The aggregation of CU values for entities , , , , multiplied by the total number of members of category , divided by the total number of entities in the graph linked via the susbsumption relationships will result in the CU value for .
Homogeneity metrics
These metrics aim to identify categories whose members share many entities among each other. In this work, we have utilised three set-based similarity metrics9
[3]: Common Neighbours (CN), Jaccard (Jac), and Cosine (Cos). We have selected these similarity metrics, since they are well-known and have been previously used for measuring similarity between entities in linked data graphs (e.g. Jaccard similarity was used in [28] to measure the similarity between two patterns in a linked data graph, and cosine similarity was used in [64] to measure the similarity between pairs of items in recommendation lists). In homogeneity metrics we normalise the values of the pair-wise similarity between every two members of a category objects and then take the average value. This is similar to the approach used in [15] for calculating the similarity between members of a category in formal concept analysis. For instance (see Fig. 4), the Jaccard similarity between the pair-wise members (, )of the entity considering the edge label D is equal to the number of intersected subject entities (in this example one entity, i,e., ) linked to them via edge label D, divided by the number of union subject entities (in this example two entities, i.e., ,and ) linked to them via edge label D.
Evaluation of knowledge anchor algorithms
We adapt the Cognitive Science experimental approach of free-naming tasks to identify human basic level objects over a data graph (BLODG) which are compared to the knowledge anchors KADG obtained by applying the metrics from Section 5.
Obtaining human BLODG
As described in the preliminaries, the set of entities in a data graph can be divided into two types: (i) category entities, representing the inner entities in a class taxonomy that have at least one member, and (ii) leaf entities, representing the set of entities that have no subclasses, and may have one or more individuals. Therefore, we divide the free-naming task into two strategies that correspond to the two types of entities:
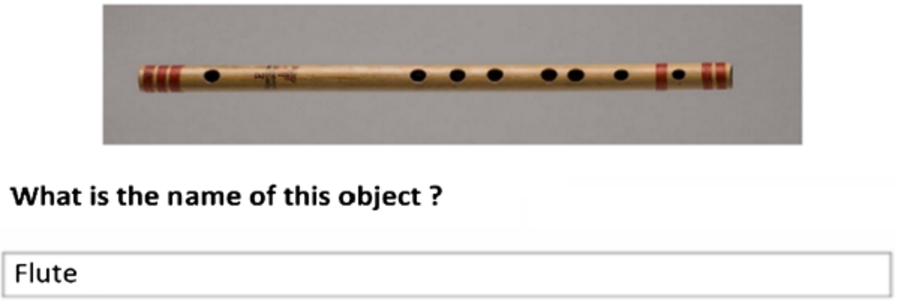
Strategy 1: the participants were shown an image of a leaf entity, and were asked to type its name.
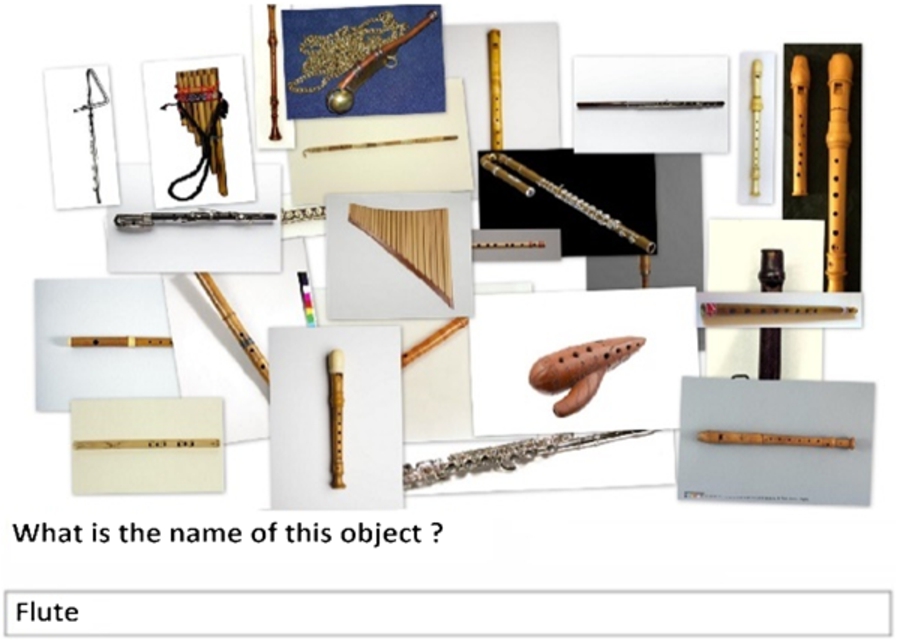
Strategy 2: the participants were shown a group of images presenting the entities of a category, and were asked to type the name of the category.
To obtain a set of human used to benchmark the metrics, we conducted a user study with the MusicPinta data graph.
Participants. The study involved 40 participants recruited on a voluntary basis, varied in gender (28 male and 12 female), their cultural background (1 Belgian, 10 British, 5 Bulgarian, 1 French, 1 German, 5 Greek, 1 Indian, 2 Italian, 6 Jordanian, 1 Libyan, 2 Malaysian, 1 Nigerian, 1 Polish, and 3 Saudi Arabian), and age (18–55, ). None of these participants had any expertise in music.
Method. The participants were asked to freely name objects that were shown in an image stimuli, under limited response time (10 seconds) for each image. Overall, 364 taxonomical musical instruments were extracted from the MusicPinta dataset by running SPARQL queries over the triple-store hosting the dataset to get all musical instrument entities linked via rdfs:subclassOf relationship. There were 256 leaf entities and 108 category entities. For each leaf entity, we collected a representative image from the Musical Instrument Museums Online (MIMO)10
http://www.mimo-international.com/MIMO/
archive to ensure that pictures of high quality were shown to participants.11
MIMO provided pictures for most musical instruments. In the rare occasions when an image did not exist in MIMO, Wikipedia images were used instead.
The study was conducted with Qualtrics (www.qualtrics.com). Examples from the surveys are in: https://login.qualtrics.com/jfe/preview/SV_cHhHPPthBFO5r6d?Q_CHL=preview.
(i) eight surveys presented 256 leaf entities, each showed 32 leaves; and (ii) two surveys presented 108 category entities (54 categories each).
Example of accurate naming of a category following Strategy 1. The user names the category entity Flute when shown an image of the leaf entity Bansuri that belongs to the category Flute.
Example of accurate naming of a category following Strategy 2. The user names the category entity Flute when shown images of leaf entities belonging to the category Indian Bambo Flutes which is a subclass of Flute.
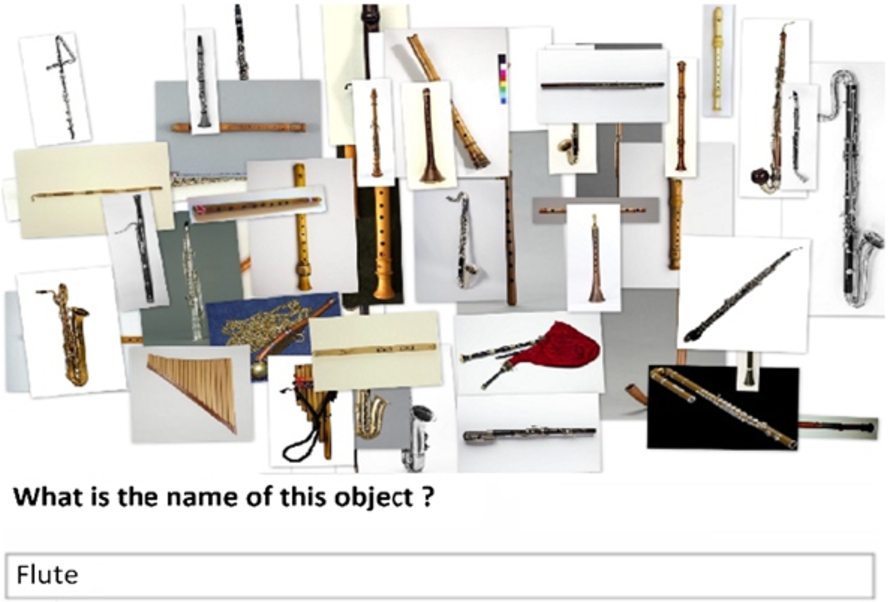
Example of accurate naming of a category following Strategy 2. The user names the category entity Flute when shown images of leaf entities that belong to Flute.
Each image was shown for 10 seconds on the participant’s screen, and the participant was asked to type the name of the given object (for leaf entities) or the category of objects (for category entities). The image allocation in the surveys was done randomly. Every survey had four respondents (i.e. each image was named by four different participants – overall there were 1456 total answers). Each participant was allocated to one survey (either leaf entities or category entities). Figures 5–8 show example images and participants’ answers (Fig. 5 from Strategy 1; Figs 6–8 from Strategy 2). Processing the answers, we identify two sets of human (see [4] for detailed algorithm how the two sets were obtained).
Set1 [resulting from Strategy1]. We mark as accurate naming of a category entity (parent) when leaf entity that belongs to this category is identified. This is illustrated in the example in Fig. 5 which shows an accurate naming of Flute. The overall count for Flute will include all cases when participants named Flute while seeing any of its leaf members.
Set2 [resulting from Strategy 2]. We mark as accurate naming of a category entity when its exact name or a name of its parent or subclass member is identified. These cases are illustrated in Figs 6, 7 and 8.
Example of accurate naming of a category following Strategy 2. The user names the category entity Flute when shown images of leaf entities that belong to Woodwind which is a parent of Flute.
In each of the two sets, entities with frequency equal or above two (i.e. named by at least two different participants) were identified as human . The union of Set1 and Set2 gives human . In total, we identified 24 human . The full list of human obtained from MusicPinta is available in [1].
Evaluating KADG against human BLODG
We used the human to examine the performance of the metrics. For each metric, we aggregated (using union) the entities identified using the hierarchical relationships (H). We noticed that the three homogeneity metrics have the same values. Therefore, we chose one metric when reporting the results, namely Jaccard similarity.13
The Jaccard similarity metric is widely used, and was used in identifying basic formal concepts in the context of formal concept analysis [15].
A cut-off threshold point for the result lists with potential entities was identified by normalizing the output values to a range between 0 and 1 from each metric and taking the mean value for the 60th percentile of the normalised lists.14
We experimented the metrics at the 60th, 70th, 80th and 90th percentiles on the metrics normalised output lists, and the metrics performed best using at the 60th percentile.
The metrics evaluated included the three distinctiveness metrics plus the Jaccard homogeneity metric; each metric was applied over both families of relationships – hierarchical (H) and domain-specific (D).
As in ontology summarisation approaches [69], a name simplicity strategy based on data graphs was applied to reduce noise when calculating key concepts (usually, basic level objects have relatively simple labels, such as chair or dog). The name simplicity approach we use is solely based on the data graph. We identify the weighted median for the length of the labels of all data graph entities and filter out all entities whose label length is higher than the median. For the MusicPinta data graph, the weighted median is 1.2, and hence we only included entities which consist of one word. Table 2 illustrates precision and recall values comparing human and derived using hierarchical and domain specific relationships. We used Precision, Recall and F scores since we are dealing with a binary classification problem where all knowledge anchors identified by our KADG metrics are considered of same rank. All class entities above the 60th percentile are identified as knowledge anchors of same rank (i.e. knowledge anchors above the 60th percentile are given the value of 1).
MusicPinta: Performance of the algorithms compared to human
Measure
Relationship type
AV
CAC
CU
Jac
Precision
H
0.60
0.62
0.62
0.60
D
0.55
0.53
0.55
0.62
Recall
H
0.68
0.73
0.73
0.55
D
0.50
0.45
0.50
0.36
F-score
H
0.64
0.67
0.67
0.57
D
0.52
0.49
0.52
0.46
Hybridisation of Metrics. Further analysis of the False Positive (FP) and False Negative (FN) entities indicated that the metrics had different performance on different taxonomical levels in the graph. This led to the following hybridisation heuristics.
Heuristic 1: Use Jaccard metric with hierarchical relationships for the most specific categories in the graph (i.e. the categories at the bottom quartile of the taxonomical level). There were FP entities (e.g. Shawm and Oboe) returned by distinctiveness metrics using the domain-specific relationship MusicOntology:Performance because these entities are highly associated with musical performances (e.g. Shawm is linked to 99 performances and Oboe is linked to 27 performance). Such entities may not be good knowledge anchors for exploration, as their hierarchical structure is flat. The best performing metric at the specific level was Jaccard for hierarchical attributes – it excluded entities which had no (or a very small number of) hierarchical attributes.
Heuristic 2: Take the majority voting for all the other taxonomical levels. Most of the entities at the middle and top taxonomical level will be well represented in the graph hierarchy and may include domain-specific relationships. Hence, combining the values of all algorithms is sensible. Each algorithm represents a voter and provides two lists of votes, each list corresponding to hierarchical or domain-specific associated attributes . At least half of the voters should vote for an entity for it to be identified in . Examples from the list of identified by applying the above hybridisation heuristics included Accordion, Guitar and Xylophone. The full list is available here [1]. Applying the hybridisation heuristics presented above improved Precision value to 0.65 (), Recall value to 0.68 (), and F score to 0.66 ().
Examining the FP and FN entities for the hybridization algorithm, led to the following observations about the possible use of as exploration anchors.
Missing basic level entities due to unpopulated areas in the data graph. We noticed that none of the metrics picked FN entities (such as Harmonica, Banjo or Cello) that belonged to the bottom quartile of the class hierarchy and had a small number of subclasses (e.g. Harmonica, Banjo and Cello each have only one subclass and there are no domain-specific relationships with their members). Similarly, none of the metrics picked Trombone (which is false negative) – although Trombone has three subclasses, it is linked only to one performance and is not linked to any DBpedia categories. While these entities belong to the cognitive structures of humans and were therefore added in the benchmarking sets, one could doubt whether such entities would be useful exploration anchors because they are not sufficiently presented in the data graph. These entities would take the user to ’dead-ends’ with unpopulated areas which may be confusing for exploration. We therefore argue that such FN cases could be seen as ‘good misses’ of algorithms.
Selecting entities that are superordinate of basic level entities. The FP included entities, such as Tambura, Reeds, Bass, Brass, Castanets, and Woodwind, which are well presented in the graph hierarchy (e.g. Reeds has 36 subclasses linked to 60 DBpedia categories, Brass has 26 subclasses linked to 22 DBpedia categories, Woodwind has 72 subclasses linked to 82 DBpedia categories). Also, their members participate in many domain-specific relationships (e.g. Reeds members are linked to 606 performances, Brass – 33, and Woodwind – 853). Although, these entities are not close to the human cognitive structures, they provide direct links entities from the benchmarking sets (e.g. Reeds links to Accordion, Brass links to Trumpet and Woodwind links to Flute). We therefore argue that such FP cases could be seen as ‘good picks’ of the algorithms because they can provide exploration bridges to reach BLO.
The generated after applying hybridisation is used for generating data graph exploration paths, as presented in the next section.
Exploration strategies based on subsumption
In this section we describe how we use to generate navigation paths following on the subsumption theory for meaningful learning (see Section 3.3). To do this, we have to address two challenges:
Challenge 1: how to find the closest knowledge anchor to the first entity of an exploration path? In uni-focal browsing (pivoting), a user starts his/her exploration from a single entity in the graph, also referred as a first entity () of an exploration path. For example, a user who wants to explore information about the musical instrument Xylophone is directed to use MusicPinta semantic data browser. The user starts his/her exploration by entering the name of Xylophone in MusicPinta Semantic search interface (see Fig. 1). Xylophone is the first entity of an exploration path. To start the subsumption process, the user has to be directed from this first entity to a suitable knowledge anchor in the data graph from where links to new entities can be made. However, there can be several knowledge anchors in a data graph; hence, we need a mechanism to identify the closest knowledge anchor to the first entity . We propose an algorithm to find the closest and most relevant knowledge anchor, presented in Section 7.1.
Challenge 2: how to use the closest knowledge anchor to subsume new class entities for generating an exploration path? The closest knowledge anchor usually can have many subclass entities at different levels of abstractions. It is important to identify which subclasses to subsume and in what order while generating an exploration path for the user. Furthermore, we also need to identify appropriate narrative scripts between the entities in the exploration path to help layman users to create meaningful relationships between familiar entities they already know. Our algorithm for generating an exploration path and the corresponding transition narratives is presented in Section 7.2.
Finding the closest KADG
Let be the first entity of an exploration path. It can be any class entity in the class hierarchy. If is a knowledge anchor (), then there is no need to identify the closest knowledge anchor, and the subsumption process can start immediately from . However, if is not a knowledge anchor (), then can be superordinate, subordinate, or sibling of one or more knowledge anchors. Hence, an automatic approach for identifying the closest knowledge anchor to is required. For this, we calculate the semantic similarity between and every knowledge anchor . The semantic similarity between two entities in the class hierarchy is based on their distances (i.e. length of the data graph trajectory between both entities). Due to the fact that class hierarchies exist in most data graphs, we adopt the semantic similarity metric from [97] and used in [101] and apply it in the context of a data graph, where semantic similarity is based on the lengths between the entities in the class hierarchy. The semantic similarity between and a knowledge anchor is calculated as:
where, is the least common ancestor of and , and depth(v) is a function for identifying the depth of the entity v in the class hierarchy.
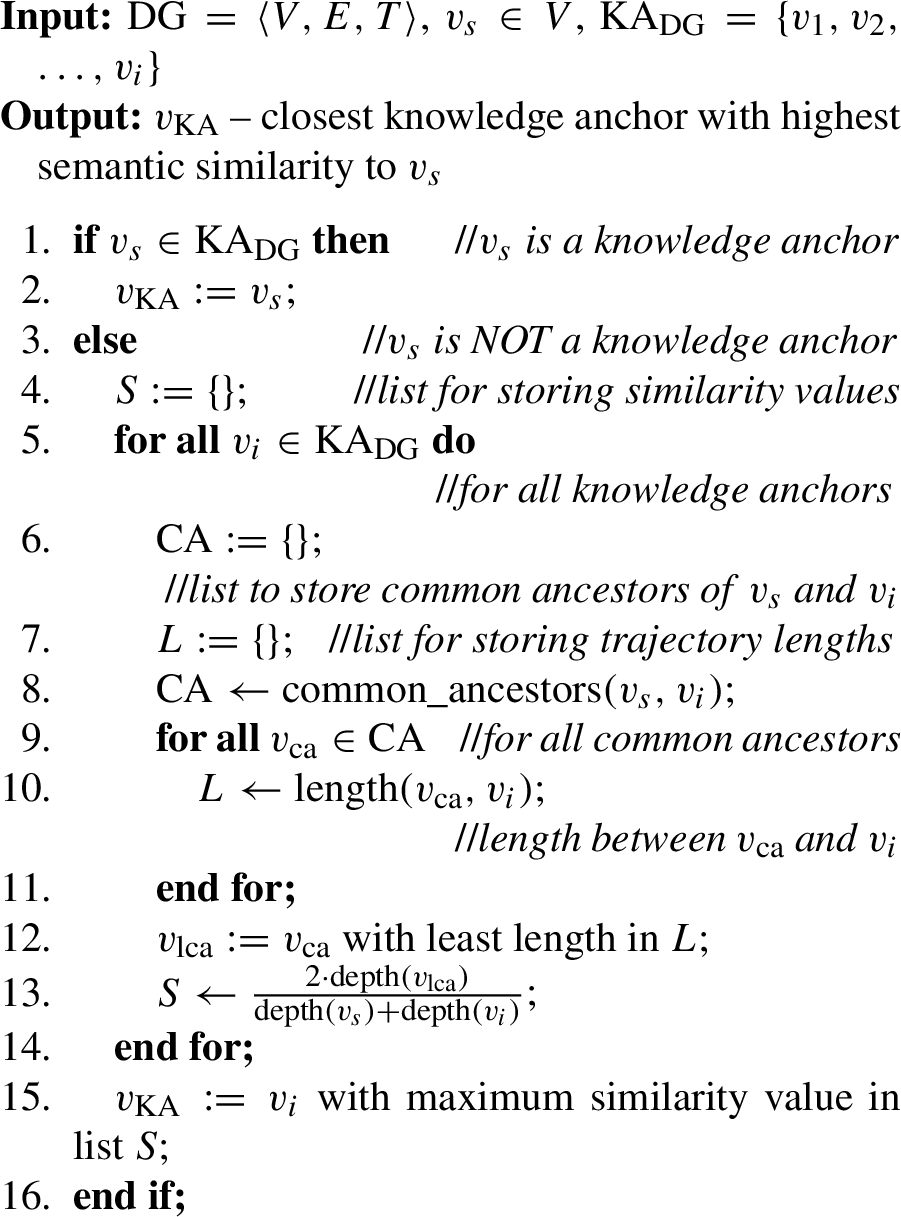
Algorithm 1 describes how the semantic similarity metric is applied to identify . The algorithm takes a data graph, the first entity of an exploration path and a set of knowledge anchors as an input, and identifies the closest knowledge anchor with highest semantic similarity value to .
Identifying closest
If the first entity belongs to the set of knowledge anchors (line 1), then the first entity is identified as the closest knowledge anchor (line 2). However, if the first entity does not belong to the set of knowledge anchors (line 3), then the following steps are conducted:
The algorithm initialises a list S to store semantic similarity values between and every knowledge anchor (line 4).
For every knowledge anchor (line 5), the algorithm initiates two lists: list for storing the common ancestors (i.e. common superclasses) of and (line 6), and list L for storing the trajectory lengths between the common ancestors in list and the knowledge anchor (line 7).
The algorithm in (line 8) uses a function common_ancestors(, ) which retrieves all common ancestors of and in the class hierarchy via the following SPARQL, and stores them in list :
For every common ancestor in list (line 9), the algorithm identifies the length of the data graph trajectories between and each of the common ancestors in list , via the following SPARQL:
The common ancestor with least trajectory length to in list L is identifies as the least common ancestor (line 12).
Then, the semantic similarity metric (Formula (5)) is applied (line 13). The metric includes identifying depths of , , and . The depth of an entity v is identified using the following SPARQL:
where r is the root entity in the data graph.
The semantic similarity value is then inserted into the list S (line 13), and the knowledge anchor with the highest similarity value to the first entity will be identified as closest knowledge anchor (line 15).
Subsumption using closest knowledge anchor
The closest knowledge anchor is used to subsume new class entities and to generate transition narratives in the exploration path. Table 3, describes the different narrative types used between entities while generating an exploration path.
Narrative types of transitions between entities in an exploration path
“You may find it useful to know thatbelongs to a familiar and well-known class –. Let’s explore.”
is superclass of
“You may find it useful to know that there is a well-known class –that belongs to. Let’s explore.”
and are siblings
“You may find it useful to know thatis similar to a well-known class –. Let’s explore.”
is subclass of and superclass of
“You may find it useful to know thatbelongs to, andbelongs to. Let’s explore.”
is subclass of and not superclass of
“You may find it useful to know thatbelongs to. Let’s explore.”
Algorithm 2 describes our approach for generating exploration paths using the subsumption theory for meaningful learning.
Subsumption using closest
The algorithm takes a data graph , the first entity , the closest knowledge anchor , the length of an exploration path (m), and the edge label as an input, and generates an exploration path P of length m. The algorithm starts by initialising an empty exploration path P (line 1) used to store m transition narratives. Then the algorithm starts identifying the relationship type between and . If is a subclass of (line 2), then the following steps are conducted:
The transition narrative from to is inserted into P (line 3) where the function script() retrieves the script output for narrative type from Table 3. The length of exploration path m is decreased by one (line 4).
The algorithm in (line 5) identifies the set of intermediate class entities () between and , using the following SPARQL query:
A list is created in (line 6), and the function sortDepth() sorts the class entities based on their depths starting from the least depth class entity (i.e. direct subclass of ) to highest depth in ascending order, and inserts the sorted class entities into list (line 7). The function sortDepth() identifies the depth of a class entity via the following SPARQL query:
where r is the root entity in the data graph.
The algorithm in (lines 8–11) uses the closest to subsume the class entities in . The transition narrative from to (i.e. ) is inserted into P (line 9) where the function script() retrieves the script output for narrative type from Table 3. The length of the path m is decreased by one (line 10).
If is superclass of (lines 12), then the transition narrative from to is inserted into P (line 13) where the function script() retrieves the script output for narrative type from Table 3. Length m of P is decreased by one (line 14). If and are siblings (line 15), then the transition narrative from to is inserted into P (line 16) where the function script() retrieves the script output for narrative type from Table 3. Length m pf P is decreased by one (line 17).
After identifying the relationship between and , the following steps are conducted:
Identify the set of subclass entities () of which do not belong to (line 19). A list is created in (line 20), and the function sorts the class entities based on two their depths and density, as the following steps:
Identify the depth of the class entities (similar to function described above).
Identify the density (using degree centrality) of the class entities based on number of subclasses.
Sort the class entity starting from the least depth (i.e. direct subclasses of ) to highest depth in ascending order, and from highest density to least density (i.e. first sort using depth, if two or more entities are at the same depth, then sort these entities based on their density from highest to lowest). The sorted class entities are inserted into list (line 21).
The algorithm in (lines 22–25) uses to subsume the class entities in . The transition narrative from to (i.e. ) is inserted into P (line 23) where the function retrieves the script output for narrative type from Table 3. The length of exploration path m is decreased by one (line 24).
Evaluation of the subsumption algorithm
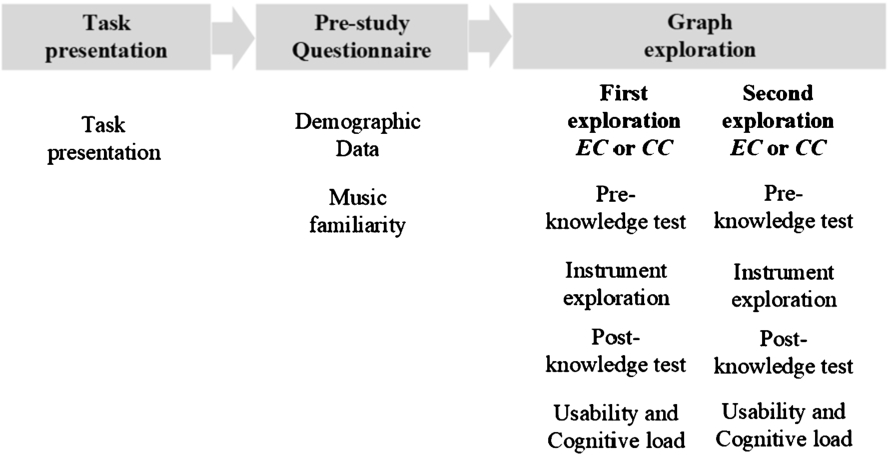
To evaluate the subsumption algorithm, we conducted an experimental study to examine the knowledge utility and usability of the generated exploration paths. We will compare two conditions:
Experimental condition (EC): where users follow exploration paths automatically generated using the subsumption algorithm presented in Section 7;
Control condition (CC): where users perform free exploration and are free to select entities to explore.
A controlled task-driven user study is conducted to examine the following hypotheses:
H1.
Users who follow EC expand their domain knowledge.
H2.
The expansion in the users’ knowledge when following EC is higher than when following CC.
H3.
The usability when EC is followed is higher than when CC is followed.
Data graph exploration task
Designing exploration tasks for users is considered an important requirement for evaluating data exploration approaches [53]. A typical exploration task has to be generic (i.e. the scope of the task is broad and the user don’t have specific information needs), realistic (i.e. real-life task that set in a familiar situation), discovery-oriented (i.e. users travel beyond what they know), open-ended (i.e. requires a significant amount of exploration, where open-endedness relates to uncertainty over the information available, or incomplete information on the nature of the search task), and set in an unfamiliar domain for the user [53,65,94]. In this work, we follow a two-step approach (similar to [53]) to design a data exploration task for the study participants. The approach involves: (i) Designing a task template that places the participant in a familiar situation which involves exploring multiple entities in an unfamiliar domain or topic (e.g. a researcher at a university that wants to write a research paper about a new topic), and (ii) Identifying unfamiliar candidate entities (e.g. find new research topic) in the domain that could be plugged into the task template.
Our aim was to design a generic task template that encourages layman users to seek knowledge in a domain unfamiliar to them. Therefore, we designed the task template in the context of a general knowledge quiz show where layman users need to acquire as much knowledge as they can. Inspired by the task templates in [53], our task template in Table 4 was designed to suit the musical instrument domain.
Task template used in the experimental user study
Task template
“Imagine that you are a member of a team which will take part in a general knowledge quiz show. You have been asked to exploretwomusicalinstrumentsfor20minutes in order to prepare a short presentation to describe to your team what you have learned about theseinstruments”.
The second step in designing data exploration task was to identify unfamiliar entities in the domain of this user study. For this we ran a questionnaire with users to identify the unfamiliar entities in the String Instrument and Wind Instrument class hierarchies in the MusicPinta data graph. These two class hierarchies have the richest class representation in terms of the number of classes and the hierarchy depth as discussed in Section 3.1, and have the highest number of knowledge anchors (9 anchors in the String Instrument class hierarchy and 10 anchors in the Wind Instrument class hierarchy – out of 24 anchors in MusicPinta data graph). We have extracted class entities at the bottom quartile of the two class hierarchies (note that the depth of the two class hierarchies is 7 – see Table 1, and entities of depth 6 or 7 are considered to be at the bottom quartile of the data graph). This is based on earlier Cognitive science studies acknowledging that layman users are not familiar with specific objects in a domain [85]. Overall 61 class entities from the String Instrument and Wind Instrument class hierarchies were used in the survey. The selected classes were randomised and distributed among twelve participants who are not experts in the musical instruments (the participants have limited knowledge about musical instruments and may have seen the instrument, and none of the participants had played any musical instruments.
The most unfamiliar instrument from each class hierarchy was Biwa (class hierarchy: String Instrument, origin: Japanese) and Bansuri (class hierarchy: Wind Instrument, origin: Indian).
Experimental setup
Participants. 32 participants, including university students and professionals (24 students and 8 professionals15
Academics and private Sector employees (Banking and Airlines).
), were recruited on a voluntary basis (a compensation of £5 Amazon voucher was offered). Participants varied in age 18–45 (mean age is 30), and cultural background (1 Austrian, 9 British, 1 Chinese, 3 Greek, 1 Italian, 5 Jordanian, 1 Libyan, 2 Malaysian, 6 Nigerian, 1 Polish, 1 Romanian and 1 Saudi).
each survey had 8 participants and each participant was allocated one survey. Figure 9 shows the overall structure of the user study. Each participant explored both musical instruments (i.e. Biwa, Bansuri), where each instrument is allocated to an exploration strategy (EC or CC).
Structure of user study to examine EC against CC in terms of knowledge utility, usability and cognitive load.
In both the strategies, the participants explored the same information including categories from a semantic data browser (i.e. participants’ explored ‘Description’, ‘Features’ and ‘Relevant information’ of musical instruments – see Figs 2, and 3). The order of and was randomised to counter balance the impact on the results. Every participant session was conducted separately and observed by the authors. All participants were asked to provide feedback before, during, and after the interaction with MusicPinta.
The different stages of the study are explained below.
Task presentation [1 min] – utilise the task template (described in Section 8.1) to present the data exploration task for the users at the beginning of their exploration session. We used the task template in Table 4.
Pre-study questionnaire [2 min] – collected information about the participants’ profiles, and their familiarity with the music domain, focusing on the two musical instrument class hierarchies which would be explored – String Instrument and Wind Instrument. The participants’ familiarity with the two class hierarchies varied from low to medium (the figures were 63% and 78% for low familiarity with String Instrument and Wind Instrument, respectively).
Graph exploration [20 min] – each user explored the two strategies where each strategy corresponds to one of the two unfamiliar instruments (Biwa or Bansuri). Figure 10 shows an example for generating an exploration path under for the instrument Biwa (the first entity of the exploration path) using the closest knowledge anchor Lute.
The first transition narrative in the exploration path is between the Biwa and the closest knowledge anchor Lute (using in Table 3). After that, the closest knowledge anchor Lute is used to subsume new class entities and generate transition narratives in the exploration path using the narrative types (subsume intermediate class entities between Lute and Biwa – line 9 in Algorithm 2) and (subsume subclasses of Lute other than class entities that have been subsumed using – line 23 in Algorithm 2).
Extract from the String Instrument class hierarchy in MusicPinta showing exploration path of Biwa. This path was followed in the experimental condition .
Table 5 lists the transition narratives that were followed in generating the exploration path for Biwa.
Transition narratives used for generating the exploration path for Biwa
Transition narratives for path of Biwa
Narrative Script
You may find it useful to know that ‘Biwa’ belongs to a familiar and well-known instrument called ‘Lute’. Let’s explore ‘Lute’.
You may also find it useful to know that ‘Oud’ belongs to ‘Lute’, and ‘Biwa’ belongs to ‘Oud’. Let’s explore ‘Oud’.
You may also find it useful to know that ‘Tambura’ belongs to ‘Lute’. Let’s explore ‘Tambura’
You may also find it useful to know that ‘Pipa’ belongs to ‘Lute’. Let’s explore ‘Pipa’
Table 6 shows examples of the entities that were freely visited in the control condition for Biwa.
Examples of entities the participants have visited during their free exploration of Biwa
Example 1
Example 2
Example 3
Biwa
Biwa
Biwa
Bouzouki
String Instruments
Japanese Musical Instruments
Xalam
‘Guitar’
Lute
Banjitar
Acoustic Guitar
Moon Lute
Plucked String instruments
Classical Guitar
Bouzouki
Figure 11 shows an example for generating the exploration path under for the instruments Bansuri (the first entity in the exploration path) using the closest knowledge anchor Flute.
Extract from the Wind Instrument class hierarchy in MusicPinta showing exploration path of Bansuri. This path was followed in experimental condition .
The exploration path for Bansuri was generated using the closest knowledge anchor Flute and narrative types , given in Table 3. The first transition narrative is between the first entity Bansuri and the closest knowledge anchor Flute (using in Table 3). After that, the closest knowledge anchor Flute is used to subsume new class entities and to generate transition narratives in the exploration path using narrative type (subsume intermediate class entities between Flute and Bansuri). Transition narratives that were followed in generating the exploration path for Bansuri are listed in Table 7.
Narrative scripts used for generating the experimental condition (i.e. exploration path) for instrument Bansuri
Transition Narratives for path of Bansuri
Narrative Script
You may find it useful to know that ‘Bansuri’ belongs to a familiar and well-known instrument called ‘Flute’. Let’s explore ‘Flute’.
You may also find it useful to know that ‘Fipple Flute’ belongs to ‘Flute’, and ‘Bansuri’ belongs to ‘Fipple Flute’. Let’s explore ‘Fipple Flute’.
You may also find it useful to know that ‘Transverse Flute’ belongs to ‘Flute’, and ‘Bansuri’ belongs to ‘Transverse Flute’. Let’s explore ‘Transverse Flute’.
You may also find it useful to know that ‘Indian Bamboo Flutes’ belongs to ‘Flute’, and ‘Bansuri’ belongs to ‘Indian Bamboo Flutes’. Let’s explore ‘Indian Bamboo Flutes’.
Table 8 shows examples of the entities that were freely visited in control condition for Bansuri
Examples of entities the participants have visited during their free exploration of Bansuri
Example 1
Example 2
Example 3
Bansuri
Bansuri
Bansuri
Transverse Flute
Fipple Flute
Bamboo Musical Instruments
Saw Truck
Contrabass Recorder
Side-blown Flute
Fipple Flute
Recorder
Concert Flute
Flute D’amour
Great bass recorder
Fipple Flute
Both, and the had the same length ( had four transition narratives, and had four edges).17
The length of four edges (5 entities) is based on Miller’s Law [63], which indicates the number of objects that an average human can hold in working memory is .
We analysed knowledge utility and user exploration experience using usability aspects, associated with the user’s exploration settings under the experimental and control conditions.
Results
Approximating Knowledge Utility. The participants’ knowledge was measured before and after each exploration using the three questions of the schema activation test related to the entities Biwa and Bansuri (see Section 3.2). Before exploration, none of the users were able to articulate any item linked to the two musical instruments (Biwa and Bansuri) using the three cognitive processes. The knowledge utility for the three cognitive process before and after exploration of and is shown in Fig. 12.
Knowledge utility of the two strategies ( and ) of the user cognitive processes (median of the knowledge utility of exploration for all users).
The knowledge utility of the exploration under in the three cognitive processes was higher than the ; and this difference is significant (see Table 9). The results showed that all participants were able to remember and categorise entities with (only 5 participants couldn’t compare new entities). Whereas not all participant could remember, categorise or compare new entities after they have finished their exploration with (there were 2 participants that could not remember or categorise new entities; 13 participants that could not compare between entities).
Statistically significant differences of the values in Fig. 12 (Mann–Whitney, 1-tail, )
Difference in knowledge utility between P and F
Cognitive process
Z-value
P
Remember
3.6
Categorise
5.1
Compare
2.7
Notably, for the cognitive process categorise the bigger effect on exploration of the subsumption exploration strategy over the free exploration strategy is highly significant (). The difference between the median values for categorise under and was higher than remember and compare. Furthermore, we examined the knowledge utility for the three cognitive processes for each instrument in its corresponding class hierarchies, as shown in Fig. 13.
Knowledge utility of the two strategies ( and ) of the user cognitive processes (median of the knowledge utility of exploration for all users).
The knowledge utility of the exploration under in the three cognitive processes was higher than the effect of free exploration under for Biwa and was higher in the cognitive processes compare and categorise for Bansuri (see Fig. 13). This difference in and is significant except for the cognitive process compare for instrument Bansuri (see Table 10).
To further inspect what caused the low knowledge utility for the cognitive process compare for instrument Bansuri, we looked into the participants’ familiarity with the Wind Instrument class hierarchy (the class hierarchy that Bansuri belongs to) and noticed that 78% of the participants had low familiarity (i.e. participants have limited knowledge and they may have seen some instruments) with Wind Instrument, whereas 65% of the participants had low familiarity with the String Instrument class hierarchy. Being more familiar with the String Instrument class hierarchy than the Wind Instrument class hierarchy, participants may have found it easier to name entities for comparison. Also, entities in the String Instrument class hierarchy are associated with more DBpedia categories compared to entities in the Wind Instrument class hierarchy (String Instrument has 255 and Wind Instrument has 161 DBpedia categories).
Statistically significant differences of the values in Fig. 13 (Mann–Whitney, 1-tail, )
Difference in knowledge utility between and
Instrument (class Hierarchy)
Cognitive Process
Z-value
P
Biwa (String)
Remember
1.658
Categorise
3.373
Compare
2.449
Bansuri (Wind)
Remember
3.467
Categorise
3.900
Compare
1.280
User Exploration Experience. After each exploration strategy, the participants’ feedback on the exploration experience was collected including exploration usability and exploration complexity, adapted from NASA-TLX [42] (Table 11). Furthermore, the participants were asked to think aloud and notes of all comments were kept.
Questions to gather feedback on user exploration experience, adapted from NASA-TLX (mental demand, effort, performance)
Subjective process
Question text
Knowledge expansion
How much the exploration expanded your knowledge?
Content diversity
How diverse was the content you have explored?
Mental demand
How mentally demanding was this exploration?
Effort
How hard did you have to work in this exploration?
Performance
How successful do you think you were in this exploration?
Figures 14 and 15 summarise the users’ feedback. As shown in Fig. 14, the exploration experience with was the most informative (all 32 participants identified their exploration experience with the exploration paths under as informative, whereas 20 participants indicated their exploration with as informative). The participants also found their exploration under to be slightly more interesting and enjoyable than . Furthermore, the participants found the exploration paths under to be the least boring and least confusing – only 3% (one participant) and 16% (four participants) of the participants founded their exploration with to be boring or confusing, respectively. For instance, one participant indicated “Narratives in paths allows me to explore entities in a hierarchical fashion, and I would like to freely explore other types of relationships”. Another participant indicated his exploration experience with as confusing: “I saw the same instruments several times during my exploration”.
Users’ exploration experience of the two exploration strategies ( and ). Values show number of user paths rated with the corresponding characteristics.
Users’ subjective perception of the two exploration strategies ( and ), based on an adapted NASA-TLX questionnaire [42] (median values for all users in the range 1–10).
The effect of the exploration path under EC on the subjective processes knowledge expansion and performance was higher than the effect of the free exploration strategy; and this difference was significant (see Table 12 and Fig. 15).
Statistically significant differences of users’ subjective perception of cognitive process (Mann–Whitney, 1-tail, )
Difference in the users’ experience
Subjective process
Z value
p
Knowledge expansion
3.98
Content diversity
0.32
Mental demand
0.14
Effort
0.14
Performance
2.15
Notably, for the subjective process knowledge expansion the bigger effect on exploration of over is highly significant ().
Discussion
The paper presented a novel computational approach to facilitate users’ exploration of data graphs leading to knowledge expansion. In this section, we will summarise the benefits of the approach, will revisit its main parts to discuss key features of the algorithms, and will point at the generality and future applications for semantic data exploration.
Benefit of the exploration approach
Overall, the evaluation results have supported our hypotheses, which were set out in Section 8.
H1:When following the subsumption exploration paths, the users expanded their domain knowledge. When users followed the experimental condition, i.e. the paths generated by the subsumption algorithm using knowledge anchors, all of them expanded their domain knowledge. All participants indicated that their exploration in the experimental condition was informative (in other words, they felt that while following the path they were able to find useful information); in contrast, only 62% of the participants founded their free exploration trajectories to be informative.
H2:The expansion in the users’ knowledge when following the subsumption exploration paths was higher than knowledge expansion when following free exploration. The participants were able to remember, categorise and compare significantly more entities. The results also showed that the cognitive process categorise had most effect on expanding the participants’ knowledge. This was caused because: (i) the subsumption hierarchical relationship (rdfs:subclassOf) was used to create the narrative scripts between entities of the generated exploration paths, which helped the users to categorise new entities at different levels of abstraction at their cognitive structures; and (ii) the subsumption process uses knowledge anchors to subsume and learn new sub-categories similarly to the way humans learn new concepts.
H3:The usability when the subsumption exploration paths were followed was higher than the free exploration cases. The results showed that participants found the generated exploration paths to be more enjoyable and less confusing than free exploration, and their assessment of performance was higher. One participant thought that the experience with hierarchical narrative scrips was boring; and suggested that the system should diversify the types of narratives used between entities in the exploration path.
Identifying knowledge anchors in data graphs
To identify knowledge anchors in a data graph, we have utilised Rosch’s definitions of basic level objects. This required operationalising cue validity, using two groups of metrics: distinctiveness (to identify the most differentiated categories whose attributes are shared amongst the category members but not with members of other categories), and homogeneity (to identify categories whose members share many attributes).
We have adapted existing methods in FCA to define metrics for , following Rosch’s definitions of BLO. The algorithms have been applied over two data graphs – in music (presented here) and in careers (presented in [4]); both data graphs had different size and hierarchy structure. Although this paper focuses only on the music domain (so that we can show a holistic approach illustrated with a concrete application), in the discussion below we identify key features of the algorithms which have been confirmed in broader evaluation (see [4] for further detail).
Hybridisation. The analysis indicated that hybridisation of the metrics notably improved performance. The same was observed in the careers domain ([4]). Appropriate hybridisation heuristics for the upper level of the data graph is to combine the metrics using majority voting. The hybridisation heuristics for the bottom level of the hierarchy are dependent on the domain-specific relationships in the data graph. Hence, to derive appropriate hybridisation heuristics that give good performance for categories at the bottom level, further experimentation will be required. This will include comparing the derived using the various domain-specific relationships against human .
Cut-off point in the evaluation. An important step in the evaluation is to identify a suitable cut-off point for the metrics. In the current implementation, this was done through experimentation – the best performance was achieved when using the 60th percentile. The same percentile was identified as best for the career domain (see [4]). We expect that when applied to a range of data graphs, the 60th percentile will give reasonable performance. However, the best cut-off point for a specific data graph would require experimentation comparing different percentiles.
Sensitivity to data graph structure. The output of the algorithms is sensitive to the data graph structure in terms of the richness of the class entities and the hierarchy depth. Specifically, the algorithms tend to pick more anchoring entities when a data graph has many classes and high depth. For instance, the algorithms identified 9 anchors in the String Instrument class hierarchy and 10 anchors in the Wind Instrument class hierarchy – out of 24 anchors (String Instrument and Wind Instrument are the richest class hierarchies in MusicPinta – see Table 1). The algorithms did not produce any anchor in the Electronic Instrument class hierarchy (only 15 classes with a depth of one). The same was observed in the career domain [4]. It should be noted that metrics may not produce in shallow class hierarchies (depth 1 or 2).
Possible high number of. Applying the algorithms over large data graphs may produce high number of . Further filtering would be required to reduce the number of . One possible way to address this is to use crowdsourcing – showing all derived knowledge anchors and asking a large number of users (crowd) to identify the most familiar entities, which will then form the refined list.
Generating exploration paths
We have developed a novel computational approach to generate exploration paths, which is the first attempt to address users’ domain knowledge expansion during exploration. We have provided an original way to link learning and exploration by operationalising Ausubel’s subsumption theory for meaningful learning. Two algorithms have been formally defined: (i) identifying the closest knowledge anchor; and (ii) generating exploration paths and transition narratives.
Several possible knowledge anchors. It is possible that several knowledge anchors in a data graph have the same semantic similarity value with the first entity (the entity selected as a starting point for the path). For example, there were two knowledge anchors (Flute and Reeds) with the same semantic similarity value with the first entity Bansuri. One way to address this is to consider the density of each knowledge anchor entities (e.g. using degree centrality in the graph). Then, select knowledge anchor with the highest density, as it will include many subclass members to subsume while generating the exploration path.
Transition to the closest knowledge anchor. In some cases, the semantic similarity metric can identify closest knowledge anchors which are not superclass (i.e. in Table 3), subclass (i.e. in Table 3) nor sibling (i.e. in Table 3) to the first entity, which means that the closest knowledge anchor cannot be reached directly from the first entity using one of the suggested narrative transitions. For instance, although the anchors Flute and Reeds have the same semantic similarity value with the first entity Bansuri, Flute is a superclass of Bansuri that can be reached directly using the narrative type ( in Table 3), whereas Reeds can’t be reached directly from Bansuri. Our solution to address this issue was to apply the semantic similarity measure proposed in [97] to find knowledge anchors which could be reached directly from the first entity. Future work can consider other semantic similarity algorithms, such as the measure proposed in [55] where calculating semantic similarity between two entities is based on the shortest path and maximum depth of the class hierarchy, or the semantic similarity model presented in [57] where each class entity is given a probability value used to calculate the semantic similarity between two entities. Another solution for reaching the closes knowledge anchor is to add a narrative type in Table 3 that indicates that the first entity and the closest knowledge anchor simply belong to the same domain but there is no direct trajectory between them.
Exploration path length. The path generation algorithm uses a knowledge anchor to subsume subordinate entities (i.e. subclasses of the closest knowledge anchor) while generating transition narratives of a pre-defined length m (given as input to the algorithm). The algorithm is dependent on the subclasses of the selected knowledge anchor, and it may not always be possible to generate m transition narratives in the exploration path. Our implementation uses only the knowledge anchor, and can result in paths whose length of less than m. Another way to address this would be to continue the path by selecting other knowledge anchors. It is also possible to use superordinate categories to the knowledge anchor to extend an exploration path. This will be suitable for cases when the user has gained knowledge at the subordinate level and is ready to generalise to a more abstract level. In such cases, a user model will be required.
Generality and further applications
The proposed exploration approach includes formal definitions for the algorithms used in both parts – identifying and generating a path and transition narratives. Both parts are generic and can be applied over different data graphs and adopted in any domain represented with a data graph. The algorithms will perform well when the taxonomy of the data graph has depth higher than 2.
Applications of knowledge anchors. The formal description of the provides a generic solution for identifying familiar entities over data graphs, which make such entities useful in different ways. We have shown here how enable operationalising the subsumption theory for meaningful learning to generate exploration paths for knowledge expansion. There are other possible applications beyond data graph exploration. For example, our approach for identifying can be applied to ontology summarisation where allow capturing layman users’ view of the domain. Furthermore, can be applied to solve the key problem of ‘cold start’ in personalisation and adaptation. One of the popular choices for addressing the cold start problem is a dialogue system with the user. The data graphs can provide a large knowledge pool to implement such probing dialogue, however, one needs to select entities from the vast amount of possibilities for probing to avoid too long interactions with the user. can be such entities, e.g. we have proposed an approach to detect user domain familiarity by exploiting for probing interactions over data graph concepts [2].
Applications of exploration paths. The subsumption algorithms for generating an exploration path are generic and can be applied in different domains that are represented as data graphs. This opens a broad spectrum of applications where users not familiar with the domain explore semantic data, such as: (i) researching a new domain (e.g. digital libraries); (ii) exploring information content in a domain where the user is not an expert (e.g. cultural heritage or news); (iii) browsing through large graphs with many options which the user may not be familiar with (e.g. job opportunities, health information, travel information); (iv) exploring content for learning (e.g. videos or presentations).
Conclusion
Exploration of data to carry out an open-ended task is becoming a key daily life activity. It usually involves a journey through large datasets or search systems that starts with an entry point, often an initial query, and then exploring a large amount of data while constantly making decisions about which data to explore next. Users who are unfamiliar with the domain they are exploring can face high cognitive load and usability challenges when exploring such large amount of data. Our work investigates how to support such users’ exploration through a data graph in a way that leads to expansion of the user’s domain knowledge.
We introduced a novel exploration support mechanism underpinned by the subsumption theory of meaningful learning, which postulates that new knowledge is grasped by starting from familiar concepts in the graph which serve as knowledge anchors from where links to new knowledge are made. A task-driven experimental user study was conducted to evaluate the exploration paths generated from the subsumption algorithm as compared to free exploration. The findings from the evaluation showed that the generated exploration paths using the subsumption algorithm lead to significantly higher increase in the users’ knowledge compared to free exploration, which enables its adoption over different domains and contexts.
A possible further extension would be to maintain a user model and personalise the path to the user’s domain knowledge. This can be extended further with a diversification strategy to suggest interesting concepts that are more likely to attract people to engage in exploration, and hence learn more about the domain.
Footnotes
Acknowledgements
We would like to thank the University of Leeds for leading and conducting most of the work in this paper. The work was partly funded by the University of Jordan. The MusicPinta semantic data browser was developed as part of the EU/FP7 project Dicode. We are grateful to the participants in the experimental studies.
References
1.
M.Al-Tawil, Intelligent support for exploration of data graphs, University of Leeds, 2017.
2.
M.Al-tawil, V.Dimitrova and D.Thakker, Using basic level concepts in a linked data graph to detect user’s domain familiarity, in: UMAP, Dublin, Ireland, 2015.
3.
M.Al-Tawil, V.Dimitrova, D.Thakker and B.Bennett, Identifying knowledge anchors in a data graph, in: HT 2016 – Proc. 27th ACM Conf. Hypertext Soc. Media, 2016. doi:10.1145/2914586.2914637.
4.
M.Al-Tawil, V.Dimitrova, D.Thakker and A.Poulovassilis, Evaluating knowledge anchors in data graphs against basic level objects, in: ICWE’17 Int. Conf. Web Eng., 2017.
5.
M.Al-tawil, D.Thakker and V.Dimitrova, Nudging to expand user’ s domain knowledge while exploring linked data, in: IESD@ISWC, 2014.
6.
K.Anyanwu and A.Sheth, ρ-Queries enabling querying for semantic associations on the semantic web, in: Proc. 12th Int. Conf. World Wide Web, 2003, pp. 690–699. doi:10.1145/775152.775249.
7.
S.Araújo, D.Schwabe and S.D.J.Barbosa, Experimenting with Explorator: A direct manipulation generic RDF browser and querying tool, in: VISSW, 2009.
8.
D.P.Ausubel, The use of advance organizers in the learning and retention of meaningful verbal material, J. Educ. Psychol.51 (1960), 267–272. doi:10.1037/h0046669.
9.
D.P.Ausubel, A subsumption theory of meaningful verbal learning and retention, J. Gen. Psychol.66 (1962), 213–224. doi:10.1080/00221309.1962.9711837.
10.
D.P.Ausubel, Cognitive structure and the facilitation of meaningful verbal learning, J. Teach. Educ.14 (1963), 217–222. doi:10.1177/002248716301400220.
11.
D.P.Ausubel, In defense of advance organizers: A reply to the critics, Rev. Educ. Res., 48 (1978), 251–257. doi:10.3102/00346543048002251.
12.
D.P.Ausubel and D.Fitzgerald, Antecedent learning variables in sequential verbal learning, 1962.
13.
D.P.Ausubel, J.D.Novak and H.Hanesian, Education psychology: A cognitive view, 1968.
14.
N.Belkin, Anomalous states of knowledge as the basis of information retrieval, Can. J. Inf. Sci.5 (1980), 133–143.
15.
R.Belohlavek and M.Trnecka, Basic level of concepts in formal concept analysis, in: ICFCA’10. 7278 LNAI, 2012, pp. 28–44. doi:10.1007/978-3-642-29892-9_9.
16.
R.Belohlavek and M.Trnecka, Basic level in formal concept analysis: Interesting concepts and psychological ramif ications, in: IJCAI Int. Jt. Conf. Artif. Intell., 2013, pp. 1233–1239.
17.
T.Berners-lee, Y.Chen, L.Chilton, D.Connolly, R.Dhanaraj, J.Hollenbach, A.Lerer and D.Sheets, Tabulator: Exploring and analyzing linked data on the semantic web, in: 3rd Int. Semant. Web User Interact. Work, L.Rutledge, M.C.Schraefel, A.Bernstein and D.Degler, eds, 2006, Citeseer.
18.
F.Bianchi, M.Palmonari, M.Cremaschi and E.Fersini, Actively learning to rank semantic associations for personalized contextual exploration of knowledge graphs, in: Proc. 14th Int. Conf. ESWC 2017, 2017, pp. 120–135.
19.
N.Bikakis, G.Papastefanatos, M.Skourla and T.Sellis, A hierarchical framework for efficient multilevel visual exploration and analysis, SWJ8 (2017), 139–179. doi:10.3233/SW-160226.
20.
C.Bizer, T.Heath and T.Berners-Lee, Linked data-the story so far, Int. J. Semant. Web Inf. Syst. (2009). doi:10.4018/jswis.2009081901.
21.
C.Bizer, J.Lehmann, G.Kobilarov, S.Auer, C.Becker, R.Cyganiak and S.Hellamnn, DBpedia – A cystallization point for the web of data, J. Web Semant.7 (2009), 154–165. doi:10.1016/j.websem.2009.07.002.
22.
A.Bonifati, R.Ciucanu and A.Lemay, Learning path queries on graph databases, in: Proc. 18th Int. Conf. Extending Database Technol., 2015. doi:10.5441/002/edbt.2015.11.
23.
J.M.Brunetti, R.García and S.Auer, From overview to facets and pivoting for interactive exploration of semantic web data, Int. J. Semant. Web Inf. Syst.9 (2013), 1–20. doi:10.4018/jswis.2013010101.
24.
S.Brunk and P.Heim, Tfacet: Hierarchical faceted exploration of semantic data using well-known interaction concepts, in: DCI@ INTERACT, 2011, pp. 31–36.
25.
Y.Cai, W.H.Chen, H.F.Leung, Q.Li, H.Xie, R.Y.K.Lau, H.Min and F.L.Wang, Context-aware ontologies generation with basic level concepts from collaborative tags, Neurocomputing.208 (2016), 25–38. doi:10.1016/j.neucom.2016.02.070.
26.
S.C.Carr and B.Thompson, The effects of prior knowledge and schema activation strategies on the inferential reading comprehension of children with and without learning disabilities, Learn. Disabil. Q.19 (1996), 48–61. doi:10.2307/1511053.
27.
G.Cheng and Y.Qu, Searching linked objects with falcons: Approach, implementation and evaluation, Int. J. Semant. Web Inf. Syst.5 (2009), 49–70.
28.
G.Cheng, Y.Zhang and Y.Qu, Explass: Exploring associations between entities via top-k ontological patterns and facets, in: ISWC’13, 2014, pp. 422–437. doi:10.1007/978-3-319-11915-1_27.
29.
W.C.Cho and D.Richards, Improvement of precision and recall for information retrieval in a narrow domain: Reuse of concepts by formal concept analysis, in: Proc. – IEEE/WIC/ACM Int. Conf. Web Intell. WI 2004, 2004, pp. 370–376. doi:10.1109/WI.2004.10082.
30.
P.Cimiano, A.Hotho and S.Staab, Learning concept hierarchies from text corpora using formal concept analysis, J. Artif. Int. Res.24 (2005), 305–339.
31.
M.A.Corter and E.James, Gluck, explaining basic categories: Feature predictability and information, 1992.
32.
A.S.Dadzie and E.Pietriga, Visualisation of linked data – Reprise, Semant. Web.8 (2017), 1–21. doi:10.3233/SW-160249.
33.
A.S.Dadzie and M.Rowe, Approaches to visualising linked data: A survey, Semant. Web.2 (2011), 89–124. doi:10.3233/SW-2011-0037.
34.
L.De Vocht, A.Dimou, J.Breuer, M.Van Compernolle, R.Verborgh, E.Mannens, P.Mechant and R.Van De Walle, A visual exploration workflow as enabler for the exploitation of linked open data, in: IESD@ISWC, 2014.
35.
S.Dietze and E.Kaldoudi, Socio-semantic integration of educational resources – The case of the mEducator project, Univers. Comput. Sci.19 (2013), 1543–1569.
36.
V.Dimitrova, L.Lau, D.Thakker, F.Yang-Turner and D.Despotakis, Exploring exploratory search: A user study with linked semantic data, in: Proc. 2nd Int. Work. Intell. Explor. Semant. Data – IESD’13, 2013, pp. 1–8. ISBN: 978-1-4503-2006-1.
37.
M.Dojchinovski and T.Vitvar, Personalised access to linked data, in: Knowl. Eng. Knowl. Manag., 2014, pp. 121–136. doi:10.1007/978-3-319-13704-9_10.
38.
L.Freund, S.Dodson and R.Kopak, On measuring learning in search: A position paper, in: Search as Learn. Work, 2016, pp. 1–2.
39.
B.Fu, N.F.Noy and M.Storey, Eye tracking the user experience – An evaluation of ontology visualization techniques, Semant. Web J.8 (2017), 23–41. doi:10.3233/SW-140163.
40.
R.García, R.Gil, J.M.Gimeno, E.Bakke and D.R.Karger, BESDUI: A benchmark for end-user structured data user interfaces, in: ISWC’16th, 2016, pp. 65–79. doi:10.1007/978-3-319-46547-0_8.
41.
J.Gwizdka, P.Hansen, C.Hauff, J.He and N.Kando, Search as learning (SAL) workshop 2016, in: Proc. 39th Int. ACM SIGIR Conf. Res. Dev. Inf. Retr., ACM, New York, NY, USA, 2016, pp. 1249–1250. doi:10.1145/2911451.2917766.
42.
S.G.Hart and L.E.Staveland, Development of NASA-TLX (task load index): Results of empirical and theoretical research, Adv. Psychol.52 (1988), 139–183. doi:10.1016/S0166-4115(08)62386-9.
43.
A.Harth, Visinav: Visual web data search and navigation, in: DEXA, 2009, pp. 214–228.
44.
P.Heim, T.Ertl and J.Ziegler, Facet graphs: Complex semantic querying made easy, in: ESWC’7, L.Aroyo, G.Antoniou, E.Hyvönen, A.Teije, H.Stuckenschmidt, L.Cabral and T.Tudorache, eds, Springer, Berlin Heidelberg, Berlin, Heidelberg, 2010, pp. 288–302.
45.
P.Heim, S.Hellmann, J.Lehmann and S.Lohmann, RelFinder: Revealing relationships in RDF knowledge bases, (n.d.).
46.
P.Heim, J.Ziegler and S.Lohmann, GFacet: A browser for the web of data, in: IMC-SSW’08, 2008, pp. 49–58.
47.
D.Huynh and D.Karger, Parallax and companion: Set-based browsing for the data web, in: WWW Conf.2009, pp. 2005–2008.
48.
M.Javed, S.Payette, J.Blake and T.Worrall, VIZ – VIVO: Towards visualizations-driven linked data navigation, in: VOILA@ISWC, A.L. et al., ed., 2016.
49.
W.Javed, S.Ghani and N.Elmqvist, PolyZoom: Multiscale and multifocus exploration in 2D visual spaces, in: CHI’12, ACM, 2012.
L.Koesten, E.Kacprzak and J.Tennison, Learning when searching for web data, in: Sal@SigirSearch as Learn., 2016, pp. 2–3.
52.
D.R.Krathwohl, A revision of bloom’s taxonomy: An overview, Theory Pract.41 (2002).
53.
B.Kules, R.Capra, M.Banta and T.Sierra, What do exploratory searchers look at in a faceted search interface? in: JCDL’09 Proc. 9th ACM/IEEE-CS Jt. Conf. Digit. Libr., 2009, pp. 313–322. doi:10.1145/1555400.1555452.
54.
D.Lamprecht, M.Strohmaier, D.Helic, C.Nyulas, T.Tudorache, N.F.Noy and M.A.Musen, Using ontologies to model human navigation behavior in information networks: A study based on Wikipedia, Semant. Web.6 (2015), 403–422. doi:10.3233/SW-140143.
55.
C.Leacock and M.Chodorow, Combining local context and WordNet similarity for word sense identification, WordNet An Electron. Lex. Database49 (1998), 265–283.
56.
N.Li and E.Motta, Evaluations of user-driven ontology summarization, in: Lect. Notes Comput. Sci. (Including Subser. Lect. Notes Artif. Intell. Lect. Notes Bioinformatics) Vol. 6317, 2010, pp. 544–553. doi:10.1007/978-3-642-16438-5.
57.
D.Lin, An information-theoretic definition of similarity, in: Icml, 981998, pp. 296–304.
58.
V.Maccatrozzo, Burst the filter bubble: Using semantic web to enable serendipity, in: ISWC’11, Springer, Berlin Heidelberg, 2012, pp. 391–398. doi:10.1007/978-3-642-35173-0_28.
59.
V.Maccatrozzo, M.Terstall, L.Aroyo and G.Schreiber, SIRUP: Serendipity in recommendations via user perceptions, in: IUI’22, 2017.
60.
G.Marchionini, Exploratory search: From finding to understanding, Commun. ACM.49 (2006), 41–46. doi:10.1145/1121949.1121979.
61.
N.Marie, F.Gandon, R.Myriam and F.Rodio, Discovery Hub: On-the-fly linked data exploratory search. HAL Id: hal-01057056, 2014.
62.
S.Mazumdar, D.Petrelli, K.Elbedweihy, V.Lanfranchi and F.Ciravegna, Affective graphs: The visual appeal of linked data, Semant. Web.6 (2015), 277–312. doi:10.3233/SW-140162.
63.
G.A.Miller, The magical number seven, plus or minus two: Some limits on our capacity for processing information, Psychol. Rev.63 (1956). doi:10.1037/h0043158.
64.
C.Musto, P.Lops, P.Basile, M.de Gemmis and G.Semeraro, Semantics-aware graph-based recommender systems exploiting linked open data, in: UMAP’16, 2016, pp. 229–237. doi:10.1145/2930238.2930249.
65.
T.Nunes and D.Schwabe, Frameworks of information exploration – Towards the evaluation of exploration systems conceptual view of an exploration framework, in: IESD@ISWC, 2016.
66.
A.G.Nuzzolese, V.Presutti, A.Gangemi, S.Peroni and P.Ciancarini, Aemoo: Linked data exploration based on knowledge patterns, Semant. Web.8 (2017), 87–112. doi:10.3233/SW-160222.
67.
E.Palagi, F.Gandon, A.Giboin, R.Troncy, I.S.Antipolis, F.Gandon, I.S.Antipolis, A.Giboin and I.S.Antipolis, A survey of definitions and models of exploratory search, in: Proc. 2017 ACM Work. Explor. Search Interact. Data Anal., 2017, pp. 3–8. doi:10.1145/3038462.3038465.
68.
P.Papadakos and Y.Tzitzikas, Hippalus: Preference-enriched faceted exploration, in: EDBT@ICDT, 2014.
69.
S.Peroni, E.Motta and M.Aquin, Identifying key concepts in an ontology, through the integration of cognitive principles with statistical and topological measures, in: ASWC’08, 2008.
70.
R.Pienta, G.Tech, J.Vreeken, G.Tech and J.Abello, FACETS: Adaptive local exploration of large graphs, in: IEEE SDM’17, 2017.
71.
J.Poelmans, D.I.Ignatov, S.O.Kuznetsov and G.Dedene, Formal concept analysis in knowledge processing: A survey on applications, Expert Syst. Appl.40 (2013), 6538–6560. doi:10.1016/j.eswa.2013.05.009.
72.
I.O.Popov, M.C.Schraefel, W.Hall and N.Shadbolt, Connecting the dots: A multi-pivot approach to data exploration, in: ISWC’10, 2011, pp. 553–568. doi:10.1007/978-3-642-25073-6_35.
73.
V.Presutti, L.Aroyo, A.Adamou, A.Gangemi and G.Schreiber, Extracting core knowledge from linked data, in: COLD, 2011.
74.
D.Richards, Ad-hoc and personal ontologies: A prototyping approach to ontology engineering, in: PKAW, 2006, pp. 13–24.
75.
E.Rosch and B.B.Lloyd, Cognition and categorization, in: Lloydia Cincinnati, 1978, pp. 27–48.
76.
E.Rosch, C.B.Mervis, W.D.Gray, D.M.Johnson and P.Boyes-Braem, Basic objects in neutral categories, Cogn. Psychol.8 (1976), 382–439. doi:10.1016/0010-0285(76)90013-X.
77.
O.Rossel, Implemention of a “search and browse” scenario for the LinkedData, in: IESD@ISWC, 2014.
78.
M.Sah and V.Wade, Personalized concept-based search and exploration on the web of data using results categorization, in: Proc. Ext. Semant. Web Conf, 2013, pp. 532–547.
79.
M.Sah and V.Wade, Personalized concept-based search on the linked open data, J. Web Semant.36 (2016), 32–57. doi:10.1016/j.websem.2015.11.004.
80.
S.Scheider, A.Degbelo, R.Lemmens, C.Van Elzakker, P.Zimmerhof, N.Kostic, J.Jones and G.Banhatti, Exploratory querying of SPARQL endpoints in space and time, Semant. Web.8 (2017), 65–86. doi:10.3233/SW-150211.
81.
B.Sertkaya, OntoComP: A Protégé plugin for completing OWL ontologies, in: Semant. Web Res. Appl. 6th Eur. Semant. Web Conf. ESWC 2009 Heraklion, Crete, Greece, May 31–June 4, 2009 Proc., L.Aroyo, P.Traverso, F.Ciravegna, P.Cimiano, T.Heath, E.Hyvönen, R.Mizoguchi, E.Oren, M.Sabou and E.Simperl, eds, Springer, Berlin Heidelberg, Berlin, Heidelberg, 2009, pp. 898–902. doi:10.1007/978-3-642-02121-3_78.
82.
B.Shneiderman, The eyes have it: A task by data type taxonomy for information visualizations, in: Proc. 1996 IEEE Symp. Vis. Lang., IEEE, 1996, pp. 336–343.
83.
P.R.Smart, A.Russell, D.Braines, Y.Kalfoglou, J.Bao and N.Shadbolt, A visual approach to semantic query design using a web-based graphical query designer, in: Proc. 16th Int. Conf. Knowl. Eng. Knowl. Manag., 2008, pp. 275–291. doi:10.1007/978-3-540-87696-0_25.
84.
C.Stadler, M.Martin and S.Auer, Exploring the web of spatial data with facete, in: Proc. 23rd Int. Conf. World Wide Web – WWW’14 Companion, 2014, pp. 175–178. doi:10.1145/2567948.2577022.
85.
J.W.Tanaka and M.Taylor, Object categories and expertise: Is the basic-level in the eye of the beholder?, Cogn. Psychol.23 (1991), 457–482. doi:10.1016/0010-0285(91)90016-H.
86.
D.Thakker, V.Dimitrova, L.Lau, F.Yang-Turner and D.Despotakis, Assisting user browsing over linked data: Requirements elicitation with a user study, in: ICWE’13 Int. Conf. Web Eng., 2013, pp. 376–383. doi:10.1007/978-3-642-39200-9_31.
87.
G.Troullinou, H.Kondylakis, E.Daskalaki and D.Plexousakis, RDF digest: Efficient summarization of RDF / S KBs, in: Semant. Web. Latest Adv. New Domains. ESWC 2015, F.Gandon, M.Sabou, H.Sack, C.d’Amato, P.Cudré-Mauroux, A.Zimmermann, eds, Lect. Notes Comput. Sci., Vol. 9088, Springer, Cham, 2015. doi:10.1007/978-3-319-18818-8.
88.
G.Troullinou, H.Kondylakis, E.Daskalaki, D.Plexousakis, F.Gandon, M.Sabou and H.Sack, Ontology understanding without tears: The-summarization approach, Semant. Web.8 (2017), 797–815. doi:10.3233/SW-170264.
89.
P.Vakkari, Searching as learning: A systematization based on literature, J. Inf. Sci.42 (2016), 7–18. doi:10.1177/0165551515615833.
90.
A.Valsecchi, M.Abrate, C.Bacciu, M.Tesconi and A.Marchetti, Linked data maps: Providing a visual entry point for the exploration of datasets, in: IESD@ISWC, Vol. 1472, 2015.
91.
G.Vega-Gorgojo, M.Giese, S.Heggestøyl, A.Soylu and A.Waaler, PepeSearch: Semantic data for the masses, PLoS One11 (2016).
92.
J.Waitelonis and H.Sack, Towards exploratory video search using linked data, Multimed. Tools Appl.59 (2012), 645–672. doi:10.1007/s11042-011-0733-1.
93.
K.Wang, Z.Wang, R.Topor, J.Z.Pan and G.Antoniou, Eliminating concepts and roles from ontologies in expressive descriptive logics, Comput. Intell.30 (2014), 205–232. doi:10.1111/j.1467-8640.2012.00442.x.
94.
R.W.White and R.A.Roth, Exploratory Search Beyond the Query–Response Paradigm, Morgan & Claypool, 2009.
95.
R.Wille, Formal concept analysis as mathematical theory of concepts and concept hierarchies, Form. Concept Anal. (2005), 1–33. doi:10.1007/11528784_1.
96.
K.Wongsuphasawat, D.Moritz, A.Anand, J.Mackinlay, B.Howe and J.Heer, Voyager: Exploratory analysis via faceted browsing of visualization recommendations, IEEE Trans. Vis. Comput. Graph.22 (2016), 649–658. doi:10.1109/TVCG.2015.2467191.
97.
Z.Wu and M.Palmer, Verbs semantics and lexical selection, in: Proc. 32nd Annu. Meet. Assoc. Comput. Linguist., 1994, pp. 133–138. doi:10.3115/981732.981751.
98.
X.Zhang, G.Cheng and Y.Qu, Ontology summarization based on rdf sentence graph, in: Proc. 16th Int. Conf. World Wide Web WWW 07, ACM Press, 2007.
99.
L.Zheng, Y.Qu and G.Cheng, Leveraging link pattern for entity-centric exploration over linked data, World Wide Web21 (2017), 421–453. doi:10.1007/s11280-017-0464-y.
100.
L.Zheng, Y.Qu, J.Jiang and G.Cheng, Facilitating entity navigation through top-K link patterns, in: Proc. Int. Semant. Web Conf., 2015, pp. 163–179. doi:10.1007/978-3-319-25007-6_10.
101.
L.Zheng, J.Xu, J.Jiang, Y.Qu and G.Cheng, Iterative entity navigation via co-clustering semantic links and entity classes, in: 13th Int. Conf. ESWC, 2016.
102.
M.Zviedris and G.Barzdins, Viziquer: A tool to explore and query SPARQL endpoints, in: Proc. 8th ESWC, 2011, pp. 441–445. doi:10.1007/978-3-642-21064-8.