
Abstract
Given the explosive growth in both data size and schema complexity, data sources are becoming increasingly difficult to use and comprehend. Summarization aspires to produce an abridged version of the original data source highlighting its most representative concepts. In this paper, we present an advanced version of the RDF Digest, a novel platform that automatically produces and visualizes high quality summaries of RDF/S Knowledge Bases (KBs). A summary is a valid RDFS graph that includes the most representative concepts of the schema, adapted to the corresponding instances. To construct this graph we designed and implemented two algorithms that exploit both the structure of the corresponding graph and the semantics of the KB. Initially we identify the most important nodes using the notion of relevance. Then we explore how to select the edges connecting these nodes by maximizing either locally or globally the importance of the selected edges. The extensive evaluation performed compares our system with two other systems and shows the benefits of our approach and the considerable advantages gained.
Introduction
The vision of Semantic Web is the creation of a common framework that allows data to be shared and reused across application, enterprise, and community boundaries. Ontologies are playing an important role in the development and deployment of the Semantic Web since they model the structure of knowledge and try to organize information for enhancing the understanding of the contextual meaning of data [14]. Ontologies have been used in database integration [3], obtaining promising results, for example in the fields of biomedicine and bioinformatics [16], but also as means for publishing large volumes of interlinked data from which we can retrieve abundant knowledge. The Linked Open Data cloud for example contains more than 62 billion triples (as of January 2014) [27].
Given these sizes, in nowadays, data sources are becoming increasingly difficult to understand and use. They often have extremely complex schemas which are difficult to comprehend, limiting the exploration and the exploitation potential of the information they contain. Moreover, regarding ontology engineering, ontology understanding is a key element for further development and reuse. For example, a user/ontology engineer, in order to formulate queries [15], has to examine carefully the entire schema in order to identify the interesting elements. Besides schema, the data contained in sources should also help to identify the most important or relevant items. Currently, an efficient and effective way to understand the content of each source without examining all data is still a blind spot.
As a result, there is now, more than ever, an increasing need to develop methods and tools in order to facilitate the understanding and exploration of various data sources. Approaches for ontology modularization [30] and partitioning [29] try to minimize and partition ontologies for better understanding but without preserving the important information. Other works focus on providing overviews on the aforementioned ontologies [9,26,29,35,36] maintaining however the more important ontology elements. Such an overview can also be provided by means of an ontology summary. Ontology summarization [36] is defined as the process of distilling knowledge from an ontology in order to produce an abridged version. While summaries are useful, creating a “good” summary is a non-trivial task. A summary should be concise, yet it needs to convey enough information to enable a decent understanding of the original schema. Moreover, the summarization should be coherent and provide an extensive coverage of the entire ontology. So far, although a reasonable number of research works tried to address the problem of summarization from different angles, a solution that simultaneously exploits both the structure and the semantics provided by the schemas and the data instances is still missing.
In this paper, we focus on RDF/S ontologies and demonstrate an efficient and effective method to automatically create high-quality summaries. We view an RDF/S KB as two distinct and interconnected graphs, i.e. the schema and the instance graph. As such, a summary constitutes a “valid” sub-schema graph providing an overview of the original schema considering also the available data. Specifically our contributions are the following:
A novel platform that automatically produces RDF schema summaries highlighting the most representative concepts of the schema adapted to the corresponding data instances.
In order to construct these graph summaries our system exploits the structure and the semantics of the KB. It differentiates schema and instance nodes and assigns different weights according to the types of properties (user-defined and standard RDF/S properties) in order to identify and select the most important and relevant elements of the ontology.
To identify the most important nodes we define the notion of relevance based on the relative cardinality and the in/out degree centrality of a node.
Since the summary we would like to construct is a sub-graph out of the original schema graph containing the most important (relevant) nodes we try next to identify the proper paths connecting those nodes. We achieve this by implementing two diverse algorithms trying to maximize in essence locally or globally the importance of the selected edges.
We present the corresponding algorithms and elaborate on their implementation details and their complexity.
Our detailed experimental evaluation shows the benefits of our approach. Initially, we compare our algorithms with other works that select only the most important nodes as a summary showing the added value of our system. Next, we identify that sub-graph selection through global importance maximization has better results in almost all cases.
To our knowledge, this is a unique approach that, in the context of ontology, combines both schema and data instance information to enable KBs exploration through high-quality summary schema graphs.
An initial version of our work has already been presented [32] and demonstrated [33]. This paper extends our previous work in several ways. Our previous work could not handle blank nodes. However, as identified during our evaluation, blank nodes are apparent in many ontologies and KBs and we cannot keep ignoring them. Besides the variation handling blank nodes of the first algorithm, in this paper we present a new algorithm for selecting the edges to be included in the constructed summary, moving out from local maximization to global maximization of the importance of the selected edges. The implementation details and the complexities are presented, whereas the updated system provides more meta-data to enhance ontology understanding. Our expectations for improvement on the results are confirmed and presented in a new section. Besides benchmarking, the two algorithms and comparing them with two existing solutions that only select the most important classes as a summary, we conduct a completely new user evaluation study with ontologies with instances, and we evaluate the quality of the entire summary graph. In addition, we measure the execution times of our algorithms and we compare them with one of the existing solutions we could get access to.
The rest of the paper is organized as follows. Section 2 introduces the formal framework of our solution and Section 3 describes the metrics used in our algorithms to determine the nodes and paths to be included in the summary. Section 4 presents the two algorithms for selecting edges in order to construct the summary graph and Section 5 our implemented system. Section 6 describes the evaluation conducted whereas Section 7 presents related work. Finally, Section 8 concludes the paper and presents directions for future work.
Preliminaries
Schema summarization aims to highlight the most representative concepts of a schema, preserving “important” information and reducing the size and the complexity of the schema [26]. Despite the significance of the problem, there is still no universally accepted measurement on the importance of nodes in an RDF/S graph. In our approach, we try to elicit this information from the structure of the graph and the semantics of the KB. Our goal is to produce a simple and expressive graph that presents an overview of the schema and also provides an intuition about the corresponding stored data. Specifically, in this paper we focus on RDF/S KBs, as RDF/S is among the widely used standards for publishing and representing data on the web [27]. We have to note that our approach handles OWL ontologies as well, considering however only the RDF/S fragment of these ontologies.
The representation of knowledge in RDF is based on triples of the form of (subject predicate object). RDF datasets have attached semantics through RDFS [2], a vocabulary description language. Representation of RDF data is based on three disjoint and infinite sets of resources, namely: URIs (U), literals (L) and blank nodes (B). We impose typing on resources, so we consider three disjoint sets of resources: classes (
Here, we will follow an approach similar to [12], which imposes a convenient graph-theoretic view of RDF data that is closer to the way the users perceive their datasets. As such, in this work, we separate between the schema and the instances of an RDF/S KB, represented in separate graphs (
(RDF/S KB).
An RDF/S KB is a tuple A labelling function A function
For simplicity, we forego extra requirements related to RDFS inference (subsumption, instantiation), because these are not relevant for our results below and would significantly complicate our definitions. In the following, we will write

An example schema graph and the corresponding schema summary (in blue).
Now, as an example, consider the CRMdig1
In this section, we present the properties that a sub-graph of a schema is required to have in order to be considered a high quality summary. Specifically, we are interested in important/relevant schema nodes that can describe efficiently the whole schema and reflect the distribution of the data instances at the same time. To capture these properties, we use the notion of relevance trying to identify the most important nodes.
Assessing schema nodes importance
Importance has a broad range of meanings and this has led to many different algorithms that try to identify it. Originating from the analysis of social graphs, in the domain of Semantic Web, algorithms adapting the well-known PageRank [35] have been proposed to determine the importance of elements in an XML document. For RDF/S, other approaches use measures such as the degree centrality, the between-ness and the eigenvector centrality (weighted PageRank and HITS) [36], adjusting them to the specific features of RDF/S or they try to adapt the degree centrality and the closeness [26] to calculate the relevance of a node.
In our case, we believe that the importance of a node should be estimated by the nodes that are directly connected to it and also by the reachability of this node, i.e. the connection of this node with the entire graph, being able to represent effectively its neighbors. Intuitively, nodes with many connections in a schema graph will have a high importance. However, since RDF/S KBs might contain huge amounts of data, that data should also be involved when trying to estimate the importance of the nodes.
Consider for example the node “E37 Mark” and the node “E38 Image” in the schema graph of Fig. 1. The two nodes have the same number of connections and they are connected to the same node “E36 Visual Item”. Now assume that the node “E38 Image” has the double number of instances. Due to the same number of connections, the two nodes may be considered equal but essentially the “E38 Image” is more important for the specific RDF/S KB, due to the higher number of instances it contains. Obviously, the number of instances of the class – that a node corresponds to – is a valuable piece of information for identifying its importance.
In our approach, initially, we determine how central/important a node is, judging from the instances it contains (relative cardinality). After that, we estimate the centrality of a node in the entire KB (in/out centrality), combining the relative cardinality with the number and type of the incoming and outgoing edges in the schema. Finally, the relevance of a schema node is defined by comparing its centrality with the centrality of its neighbors.
Relative cardinality
The cardinality of a schema node is the number of instances it contains in the current RDF/S KB. If there are many instances of a specific class, then that class is more likely to be more important than another with very few instances. Similarly, the cardinality of an edge between two nodes in a schema graph is the number of the corresponding instances of the nodes connected with that specific edge. Using these ideas, we can formally define the relative cardinality of an edge. Let (Relative cardinality of an edge).
In/out centrality
In order to combine the notion of centrality in the schema and the distribution of the corresponding dataset, we define the in/out centrality, exploiting also the relative cardinality of the various nodes and edges. The in/out centrality is an adaptation of the degree centrality [36]. In an undirected graph, the degree centrality is defined as the number of links incident upon a node. In a directed graph however, as in our case, the degree centrality is distinguished to the in-degree centrality and the out-degree centrality.
(Node centrality).
Assume a node
The weights, that are used, are experimentally defined and depend on the type of the properties. We differentiate in our algorithm among two types of properties, the standard RDF types (for example “rdfs:subClassOf”, “rdfs:label”, “rdfs:comment”) and the user-defined properties (for example the “P45 consists of”, “P128 carries” shown in Fig. 1). We consider the user-defined ones as more important since they have been explicitly defined by users instead of reusing already existing ones commonly used. In our experiments we used
Consider now the “E38 Image” class shown in Fig. 1. Assume also that there are no instances in the corresponding dataset. According to Definition 3,
Relevance
The notion of centrality, as defined previously, is a measure that can provide an intuition about how central a schema node in an RDF/S KB is. However, its importance should be determined considering also the centrality of the other nodes as well. Consider for example, the nodes “E55 Type” and “E56 Language” shown in Fig. 1. They have the same number of incoming and outgoing edges. Assume now that they have the same number of instances as well. The “E55 Type” is connected to more important elements compared to the “E56 Language”. For example, the node “E18 Physical Thing” is directly connected to the “E55 Type” and has many other connections and instances. Since the “E18 Physical Thing” is obviously a very important node, the “E55 Type” is a less appropriate node to represent this area in a summary. On the other hand, the “E56 Language” is more relevant than the “E55 Type” to represent the specific part of the graph since its neighbors do not have such a high relevance.
To select the most important nodes, we define the notion of the relevance of a node, affected by its surrounding neighbors and more specifically by the number and the connections of its adjacent nodes. To be more precise, the formula estimates the (number of) connections of a node and this number is compared to the connections of its neighbors.
(Relevance of a node).
Assume a node
Obviously, the relevance of a schema node in an RDF/S KB is determined by both its connectivity in the schema and the cardinality of the instances. Thus, the number of instances of a node is of vital importance in the assessment procedure. When the data distribution significantly changes, the focus of the entire data source is shifted as well, and as a result, the relevance of the nodes changes. In addition, the importance of each node is compared to the other nodes in the specific area/neighborhood in order to identify the most relevant nodes that can represent all the concepts of a graph. As such, the notion of relevance depicts in essence the capability of a node to represent other nodes.
However, we are not interested only in extracting and presenting the nodes with the highest relevance to the users, but our target is to produce a valid sub-graph out of the original one. Next, we focus on selecting the proper edges between the nodes.
Construction of RDF/S Summary Schema Graph
Having selected the most important schema nodes, it is now time to focus on the paths that exist in a schema graph. The idea behind this is that we are not interested in extracting isolated nodes, but most importantly, we want to produce valid sub-schema graphs. The chosen paths should be selected having in mind to collect the more relevant nodes by minimizing the overlaps.
Two different algorithms have been created to this direction with different targets: one trying to optimize locally and one globally the importance of the selected paths. Both algorithms exploit blank nodes by allowing them to participate in the calculations, used to establish connections between the nodes. As such, useful information and connections are now maintained and exploited for the construction of the final schema graph summary. Nevertheless, many researchers argue [1] that blank nodes do not offer useful information for understanding an RDF/S graph.
Sub-graph selection through coverage maximization
In our running example of Fig. 1, the nodes “E53 Place” and “E55 Type” are directly connected to the node “E18 Physical Thing” and have similar connectivity in the graph. The node “E18 Physical Thing” has a high relevance in the graph and as a consequence a great probability to be included in the summary. However, although the “E18 Physical Thing” can be located only in one place, it might have many types. As a consequence, the relative cardinality of the path from the “E18 Physical Thing” to the “E55 Type” will be higher than the relative cardinality of the path form “E18 Physical Thing” to “E53 Place”. This means that the path from “E18 Physical Thing” to “E55 Type” is more appropriate to be included in the summary than the path from “E18 Physical Thing” to “E53 Place”. This is because the “E18 Physical Thing” already covers the “E53 Place” – a physical thing is located only in one place.
In the above example, we dealt with paths of length one. However, the paths included in the summary should contain the most relevant schema nodes that represent the remaining nodes, achieving the digest of the entire content of the RDF/S KB. Therefore, the main criteria to estimate the level of coverage of a specific path are: (a) the relevance of each node contained in the path, (b) its relevant instances in the dataset and (c) the length of the path. As a result, similar to the approach of Yu et al. [35], we define the notion of coverage as follows:
(Coverage of a path).
The coverage of a path
We can see that we divide by the length of the path in order to penalize the longer paths. The above formula assesses a path and provides a metric to identify the degree of the contained relevant nodes and how this path can represent (a part of) the original graph without overlapping issues. Our goal is to select the schema nodes that are more relevant while avoiding having nodes (or paths) in the summary which cover one another. The highest the coverage of a path, the more relevant this path is considered in representing the original graph or part of it.
(CM Summary Schema Graph of size n).
Let
Now that we have explained all formulas required in order to calculate the relevance and the coverage of the elements of an RDF/S KB, we can describe an algorithm for constructing an RDF/S schema summary that is based on coverage. The algorithm is shown in Fig. 2 whereas the main steps of the execution are shown in Fig. 3. Below we explain in more detail the steps of the corresponding algorithm.

The algorithm for computing the RDF/S Schema Summary based on coverage.

An example execution of the algorithm for computing the RDF Schema Summary based on coverage.
In the beginning, (line 1) we calculate all inferred triples for the schema part of our KB and we construct the corresponding schema graph. As such the summary of an RDF/S KB
Now we would like to identify the paths that maximize coverage (lines 8–14). In other words, we select the paths that contain the most relevant nodes according to the coverage measure as described in the previous section. As such, for each node in TOP we calculate the coverage (Definition 5) of the paths connecting that node with the other nodes in TOP selecting the one with the highest value. Note that the selection of the nodes to complete the subgraph is done out of the initial RDF/S schema graph, since the summary should be coherent with the original schema. Moreover, in this selection, other nodes might be also included in the summary in order to connect the most important ones. If there are multiple paths with the same coverage value then the one minimizing the additional nodes introduces is selected. If all paths have the same number of nodes to be introduced then the first returned by the path_with_max_cov function is used. Note that in our example of Fig. 3 one additional schema node is selected to formulate the final summary.
When the algorithm finishes its execution, the selected sub-graph, according to the previous steps, will be a CM Summary Schema Graph. If the data distribution changes, the summary is also changed in order to provide an updated view on the corresponding schema and the updated data instances. The correctness of the algorithm can be easily proved by construction.
The Algorithm ComputeSimilarityCM produces a CM Summary Schema Graph.
In order to prove that the result of the execution of Algorithm 1 is a CM Summary Schema Graph we should prove that the three properties from Definition 6 are satisfied. Since we first calculate the relevance of each node (lines 1–3), we select the n most important nodes (line 4) and include them in
To identify the complexity of the algorithm we should first identify the complexity of its various components. Assume
Besides trying to locally optimize the importance of the selected nodes to be included in the summary using coverage, another idea would be to try to optimize the total importance of the edges of the summary graph. To do that we should first define the relevance of an edge as follows:
(Relevance of an edge).
Let
Obviously, the relevance of a path is given by adding the relevance of all edges in the selected path.
As such, we can now formally define what a summary schema graph would be, targeting the maximization of the total relevance of the selected schema summary.

An example execution of the algorithm for computing the RDF/S Schema Summary based on relevance maximization.
Let
Next, we present the algorithm for constructing an RM summary schema graph of a KB. The algorithm is shown in Fig. 4 and similarly to Algorithm 1 gets as input an RDF/S KB V and the number of requested nodes n and returns a corresponding RM summary schema graph. Below we explain in detail the steps of the algorithm execution whereas an example is shown in Fig. 5.

The algorithm for computing the RDF/S Schema Summary.
In the beginning (line 1) we calculate all inferred triples for the schema part of our KB and we construct the corresponding schema graph for ensuring that the result will be the same independent of the number of inferences applied to the schema graph
Then the algorithm tries to identify the paths connecting those nodes by maximizing the total relevance (line 5). In graph theory, a spanning tree T of an undirected weighted graph G is a subgraph that includes all of the vertices of G that is a tree. In general, a graph may have several spanning trees, but the maximum cost-spanning tree (MCST) would be one with the greater total weight. More precisely, a maximum spanning tree for a graph would be a tree connecting all nodes with the maximum total weighting for its edges (where the total weight of the edges in the tree is maximized). In our case, the weight of an edge is defined by its relevance (Definition 7) and as such, the maximum cost-spanning tree would include the more representative path(s). Several algorithms have been proposed for finding the MCST. Kruskal’s greedy algorithm [28] is among the fastest ones and we are using it in our implementation. Note that there might be multiple MCSTs in a graph so we use the first one returned by Kruskal’s greedy algorithm. In the second step of our example, shown in Fig. 5, the MCST is identified connecting all schema nodes.
Then the algorithm proceeds by isolating the nodes with the highest relevance and connecting them using the paths identified by the MCST thus maximizing the total relevance of the selected sub-graph (lines 6–9). In other words, after the initial identification of the nodes with the highest relevance we connect those nodes by selecting the paths which have the maximum relevance. Similarly, to the previous algorithm, other nodes might be also included in the summary in order to connect the most important ones. In our example of Fig. 5. two additional nodes are included in the schema summary and the final output is returned to the user.
The Algorithm ComputeSummaryRM computes an RM Summary Schema Graph.
In order to prove that the result of the execution of Algorithm 2 is an RM Summary Schema graph we should prove that the three properties from Definition 8 are satisfied. Since we first calculate the relevance of each node (lines 1–3), we select the n most important nodes (line 4) and include them in
The algorithm depends on the data distribution and if it is changed, the summary is also changed in order to provide an updated view on the corresponding schema and the updated data instances.
To identify the complexity of the algorithm, we analyze similarly to Algorithm 1 the complexity of its components. Again for calculating the closure we need
The algorithms described in the previous section were implemented in the advanced version of the RDF Digest prototype. The system is developed using JAVA and it is currently available online2

The architecture of RDF Digest.

A screenshot of the RDF Digest prototype.
The RDF Digest is composed of two major components, the Summarizer and the Visualizer. Using the graphical use interface, a user can select or provide the URL of an online RDF/S document, she would like to be summarized. Optionally she is able to define also the percentage of the most important nodes that she would like to be included in the summary. The Summarizer gets the input RDF/S document and preprocesses it (using the RDF Preprocessor module) by computing the closure of the corresponding schema graph. The result is stored in a Virtuoso instance to enable efficient data access. Then, the RDF Assessor module calculates the relevance of each node. The RDF Summary Builder generates the final summary of the schema, based on the rankings produced by the RDF Assessor and the requested size of the summary. The result and additional meta-data are returned to the Visualizer, which visualizes the returned summary. Besides visualizing the summary schema graph, the user is able to identify several metrics for each node such as the relevance, the in-centrality, the out-centrality, the relative cardinality, the number of properties etc.
To evaluate our system, we used in total six ontologies:
The accumulated characteristics of those ontologies are shown in Table 1. The variety on the size, the domain and the structure of these ontologies offers an interesting test case for our evaluation. We have to note that most of these ontologies are actually OWL ontologies (BIOSPHERE, Financial, Aktors Portal, LUBM, eTMO) however we consider only their RDF/S fragment – ignoring also the distinction between TBox and ABox blank nodes.
Characteristics of the used ontologies
We performed an extensive three-stage evaluation to assess the effectiveness of our algorithms:
Finally, we evaluate the efficiency of our algorithms in terms of execution time, comparing them also with the system proposed by Peroni et al. Below we describe in detail the performed evaluation.
All ontologies used and the reference summaries created by the experts are available online.10
Stage 1 reference summaries
The reference summaries used in this evaluation stage were generated by Peroni et al. [24] and were also used by Queiroz-Sousa et al. [26] in their evaluation. The reference summaries were generated by eight human experts. These human experts had a good experience in ontology engineering and were familiar with the aforementioned ontologies. The experts were requested to select up to 20 concepts, which were considered as the most representative of each ontology. The level of agreement among experts for the three ontologies had a mean value of 74% [24] meaning that the experts did not entirely agree on their selections.

Stage 1 similarity results.
Measures like precision, recall and F-measure, used by the previous works [10,17,26,36] are limited in exhibiting the added value of a summarization system because of the “disagreement due to synonymy” [6] meaning that they fail to identify closeness with the ideal result when the results are not exactly the same with the reference ones. On the other hand, content-based metrics compute the similarity between two summaries in a more reliable way [36]. In the same spirit, Maedche et al. [19] argue that ontologies can be compared at two different levels: lexical and conceptual. At the lexical level, the classes and the properties of the ontology are compared lexicographically, whereas at the conceptual level the taxonomic structures and the relations in the ontology are compared. To this direction, we use the following similarity measure, denoted by
In the above definition α and β are constants assessing the existence of sub-classes and super-classes of
Consequently, the effectiveness of a summarization system is calculated by the average number of the similarity values between the summaries produced by the system and the set of the corresponding experts’ summaries.
Stage 1 comparison
To evaluate the effectiveness of our system we compared the similarity – as defined previously – between the summaries produced by our algorithms and the corresponding reference summaries. The results are shown in Fig. 8.
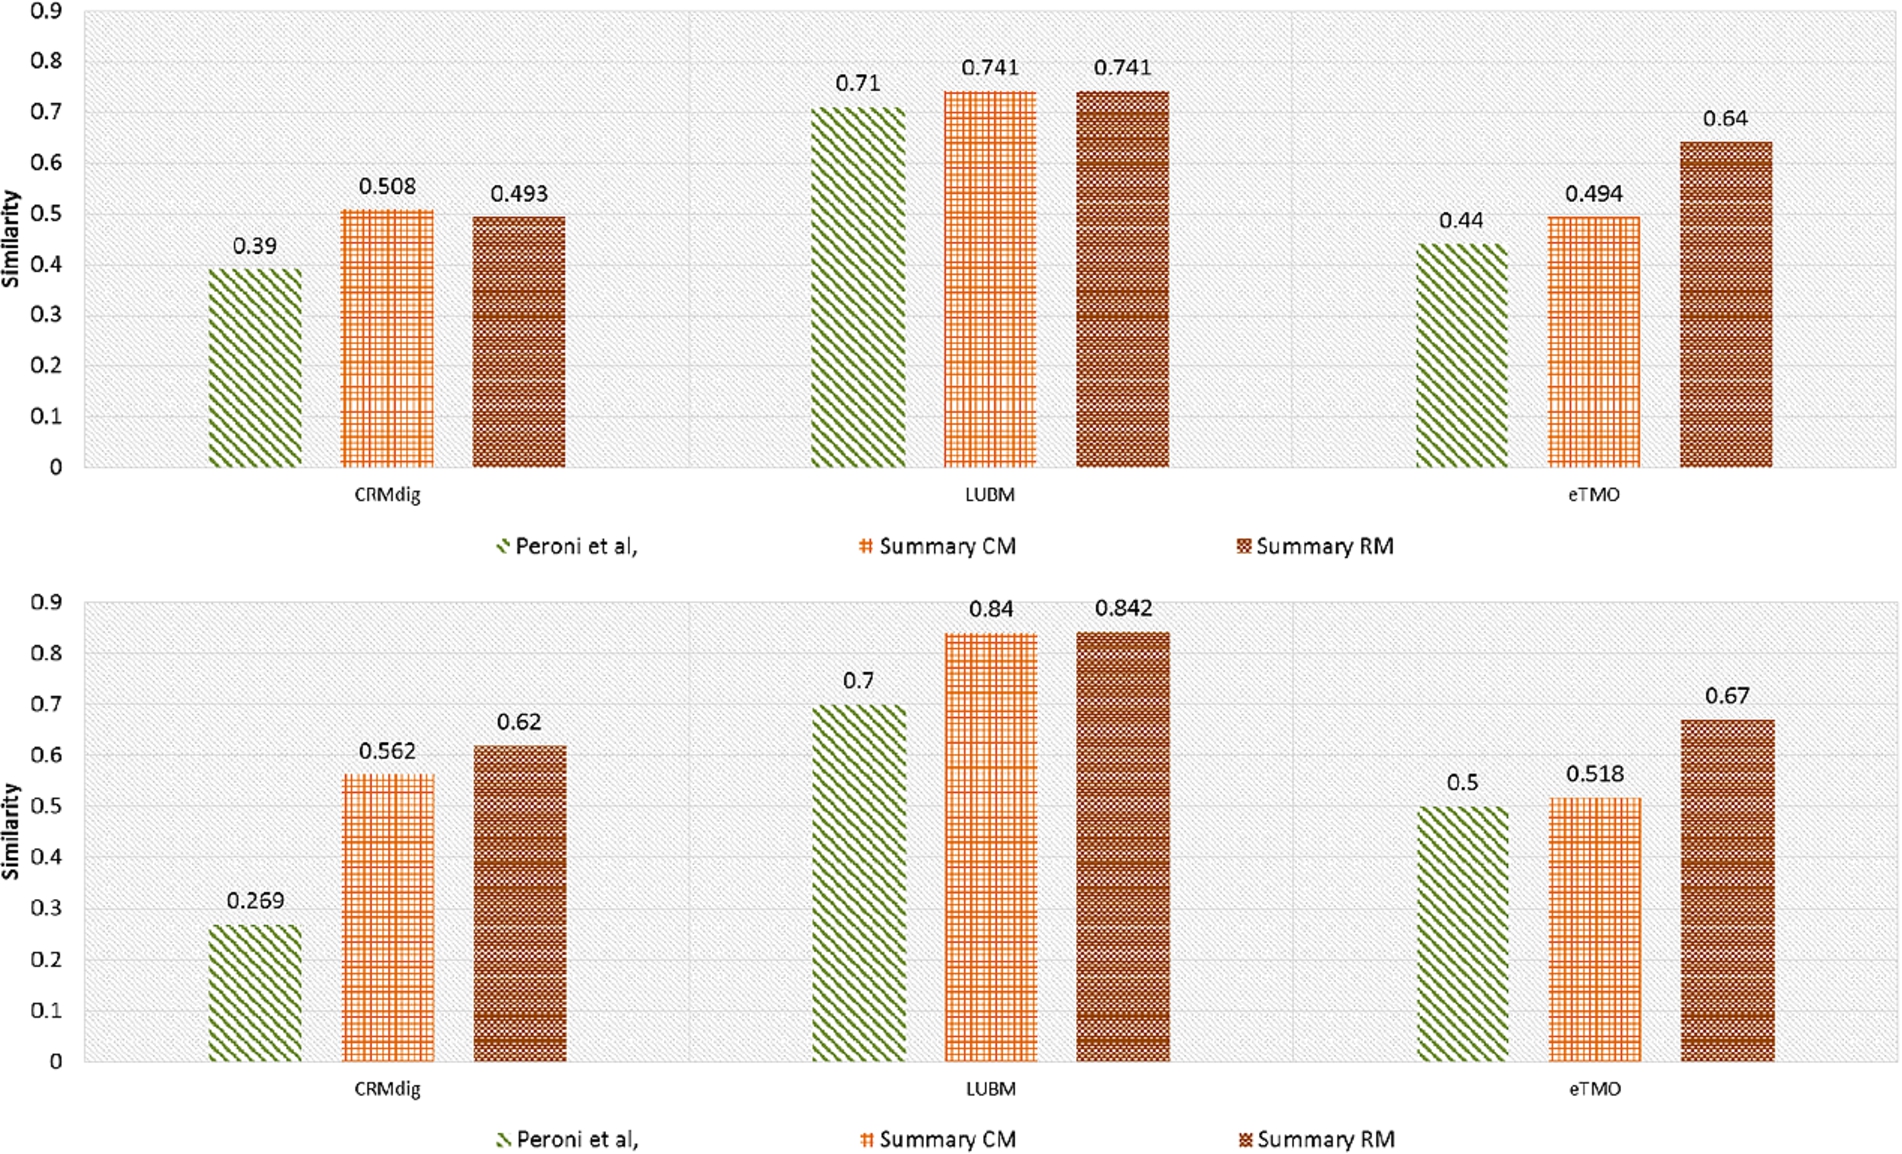
Stage 2 similarity results without (top) and with (bottom) instances.
As we can observe, the summaries generated by our algorithms appear to be quite similar to what experts have produced, in most of the cases, showing better results than other similar systems. Comparing further our two implemented algorithms, we can observe that Summary RM outperforms Summary CM in all cases exploiting the global maximization of the selected edges. The only case that our algorithms are worse than the other two algorithms is in the case of the Aktors Portal ontology. By trying to understand the reasons behind this, we identified that the Aktors Portal ontology contains a huge amount of blank nodes and this has a direct effect to the quality of our constructed summary, despite the fact that both our algorithms consider them when calculating the summary schema graphs. Since the Aktors Portal ontology is an OWL ontology and we only exploit the RDF/S part of the ontology, an interesting experiment would be to consider in addition, the various OWL constructs and to differentiate among ABox and TBox blank nodes. However, we leave this for future work.
Stage 2 reference summaries and evaluation measures
The reference summaries used in this evaluation stage were generated by a new user-study. For each one of the CRMdig, the LUBM and the eTMO ontologies three external human experts from the ontology engineering group of Institute of Computer Science at FORTH provided the corresponding reference summaries. These human experts had an extensive experience in ontology engineering and were familiar with the aforementioned ontologies. We have to note that in the second stage of the evaluation the number of experts involved was lower (three) than those used in [24] (eight). The experts were requested to select the most representative schema graph summary containing the 10% of the classes for each ontology considering two cases: (a) the case that only the schema graph of the ontology is available and (b) the case that instances are available as well. As such, for each ontology a human expert had to provide two reference schema graph summaries. The level of agreement among experts for the nodes of the three ontologies had a mean value of 73% for LUBM, 33% for eTMO and 34% for CRMdig meaning that the experts did not completely agree on their selections. As such, we calculated the similarity for each expert separately and then we calculated the mean values.
In the second evaluation stage, we use the nodes selected by the experts in the reference graph summary and we compare our algorithms with the Peroni et al. using again the similarity measure.
Stage 2 comparison
The results of comparing the similarities between the reference summaries and the summaries generated by Peroni et al. and our algorithms are shown in Fig. 9.
We can observe that in all cases both our algorithms outperform Peroni et al. In addition, in most of the cases the Summary RM algorithm outperforms the Summary CM algorithm exploiting the global maximization of the selected paths.
Furthermore, we can notice that when the ontologies contain instances the quality of the selected summaries for both our algorithms increases significantly showing that they effectively exploit instances to understand the important nodes of the schema graph. This is not the case for Peroni et al.
Additionally, our algorithms show better results for ontologies where experts have a better agreement on the generated reference summaries. This is the case for LUBM for example with a mean value of agreement between the experts of 73%.

The average percentage (AP) of triples that should be added to/deleted from our summary to reach the reference summaries.
Since our system is the only one generating a complete ontology with nodes and properties as a summary, in this section we evaluate as a whole the result of our two algorithms comparing them to the reference summaries generated by experts. We use the ontologies participating in the second stage of our evaluation since the ontology experts were requested to select as a summary an entire schema graph. Peroni et al. returns only nodes as a summary and as such, it is not included in this evaluation stage.
Stage 3 evaluation measures
In [23] the authors argue that low-level deltas can be used to describe the set of triples which were added (
Stage 3 comparison
The results of our comparison are shown in Fig. 10. As we can observe for summaries generated by our algorithms, at most the 48% of the triples should be changed (this is the case for CRMdig for Summary RM and LUMB with instances for Summary CM). In addition, the average percentage of changes that should be implemented is 37% for Summary CM and 40% for Summary RM showing that the two algorithms generate results of almost the same quality with respect to the triples that should be added or deleted on the generated summary in order to get the reference ones.
Although the generated summaries do not contain the same triples with the reference ones we have to keep in mind that the graphs the experts have in their mind are really close to the ones that our summaries correspond to. This is shown also by the similarity measure in the previous section.
In addition, we have to keep in mind that even the experts do not agree on the selected references summaries. In fact, many of our experts declared that in many cases it was too difficult to select the paths connecting the most important nodes without being able to argue on which path should be preferred.
Efficiency
Finally, to test the efficiency of our system, we measured the average time of 50 executions in order to produce summaries of 10% of the nodes using the aforementioned ontologies. We evaluated Peroni et al. and our two algorithms. The experiments run on a 64 bit Windows 7 Enterprise system with 8 GB of main memory and an Intel Core 2 Quad CPU running at 2.39 GHz.
The results are shown in Table 2. As we can observe Peroni et al. runs faster than our algorithms. However, this is reasonable since Peroni et al. returns only nodes as a summary whereas in our case the two implemented algorithms have to consider paths as well, returning an entire graph as a summary. In addition, Peroni et al. loads everything in memory whereas our system uses an external triple store to be able to handle mass amounts of data.
Execution times for the three algorithms (sec)
Execution times for the three algorithms (sec)
All algorithms require more time as the size and the density of the ontology increase and in all cases we need even more time when instances are considered as well.
In addition, we can observe that in all but one cases Summary RM is faster than Summary CM. This is because Summary CM has to assess the coverage for each node independently of his neighbors whereas the Summary RM constructs only once the MCST. The only case that Summary RM is slower that Summary CM is the case of eTMO. By carefully examining the aforementioned ontology we can identify that there are properties where the domain and/or the range is not defined. Our algorithm tries to consider those nodes many times in order to construct an MCST. This leads to a significant overhead in execution time. On the other hand, Summary CM simply ignores them. The execution time is increased even more when instances are considered for the same reason (Summary RM requires 23.19 sec for eTMO + Instances whereas Summary CM requires 8.05 sec).
Finally, we can observe that dense ontologies with many properties such as CRMdig require significantly more time than the ones with a small number of properties. This is reasonable since trying to calculate the selected paths is one of the most expensive functions in terms of execution time.
As already stated, various techniques have been developed for the identification of summaries over different types of schemas and data. The first works on schema summarization focused on conceptual [5] and XML schemas [2]. Yu et al. [35] affirm that, while schema structure is of vital importance in summarization, data distribution often provides important knowledge that improves the summary quality. Another work [20] on XML Schemas derives a summary of the schema and then transforms the instances through summary functions. Other works focus on summarizing meta-data and large graphs. For example, Hasan [10] proposes a method to summarize the explanation of the related metadata over a set of Linked Data, based on user specified filtering criteria and producing rankings of explanation statements.
One of the latest approaches that deals with graph summaries [18] examines only the structure of an undirected graph, neglecting any additional information (such as semantics). The goal of this work is to generate a summary graph that minimizes the loss of information out of the original graph. Furthermore, a wide variety of research works have been focused on producing and visualizing summaries of the datasets, or in other words dataset statistics, without taking into consideration any semantic aspects of the schemata. To this direction Dudas et al. [7], Khatchadourian et al. [7,13], and Palmonari et al. [22] produce node-link visualization graphs, showing combination of links that reportedly exist in the datasets. However, our system differs from the above in terms of both goals and techniques. Other approaches try to create mainly instance summaries, by exploiting the instances’ semantic associations, by proposing different algorithms that do not take into consideration the schemata of the graphs. To this end, Campinas et al. [4] present several different summary graphs with different instance equivalence criteria for each algorithm. Jiang et al. [11], Navlakha et al. [21], and Tian et al. [31] propose to construct instance-focused graph summaries of unweighted graphs by grouping similar nodes and edges to super-nodes and super-edges. Although we reuse interesting ideas from these works, our approach is focused towards RDF/S KBs expressing richer semantics than conceptual schemas and XML and single instances.
More closely related works to our data model and approach are [9,26,31,36]. Zhang et al. [36] propose a method for ontology summarization based on the RDF Sentence Graph. The notion of RDF Sentence is the basic unit for the summarization and corresponds to a combination of a set of RDF statements. The creation of a sentence graph is customized by the domain experts who provide as input the size of the summary and their navigation preferences to create the RDF Sentence graph. The importance of each RDF sentence is assessed by determining its centrality in the graph. In addition, the authors compare five different centrality measures (degree, between-ness, PageRank, HITS), showing that weighted in-degree centrality and some eigenvector-based centralities are better. However, in this approach, the overall importance of the entire graph is not considered and many important nodes may be left out.
On the other hand, Peroni et al. [24] try to identify automatically the key concepts in an ontology, combining cognitive principles, lexical and topological measurements such as density and the coverage. The goal is to return a number of concepts that match as much as possible those produced by human experts. However, this work focuses only on returning the most important nodes and not on returning an entire graph summary. In the same direction, Queiroz-Sousa et al. [26] propose an algorithm which produces an ontology summary in two ways: automatically, using relevance measures and, semi-automatically, using additionally the users’ opinion (user-defined parameters), producing a personalized ontology summary. However, this work produces summaries which include nodes that are already represented by other nodes.
Pires et al. [25], propose an automatic method to summarize ontologies that represent schemas of peers participating in a peer-to-peer system. In order to determine the relevance of a concept, a combination two measures, centrality and frequency is used. Wu et al. [34] on the other hand use similar algorithms, named Concept-And-Relation-Ranking, to identify the most important concepts and relations in an iterative manner however, without considering instances.
Although in most of these works the importance of each node is calculated considering each node in isolation, in our work, we assess its importance in comparison with its neighbors, producing a better result. Moreover, many of these works (such as [26] and [10]) do not try to identify how one node represents others and end up collecting nodes already represented by other nodes. In addition, some of these works (e.g. [24]) provide a list of the more important nodes, whereas others [9,10,31,36] and our approach, create a valid summary schema. Our work is the only one that automatically produces a summary graph, exploiting the data instances and essentially provides an overview of the entire KB (both schema and instances).
Conclusions and future work
In this paper, we present a novel method that automatically produces summaries of RDF/S KBs. To achieve that, our method exploits the semantics of the KB and the structure of the corresponding graph. Based on the notion of relevance, first the most relevant nodes are selected. Then, two algorithms have been implemented trying to identify the edges connecting those nodes trying to maximize edges importance either locally or globally. The performed evaluation verifies the feasibility of our solution and demonstrates the advantages gained by producing high quality summaries. In addition, our approach outperforms in most of the cases other similar systems. Moreover, although most of the systems just select nodes or paths, our result is a valid RDF/S document out of the initial schema graph and can be used for query answering as well.
Currently we are experimenting with extensible summaries. In an ideal scenario, the user should not be limited only to exploring the most important nodes. A user should be able to further explore the components of the summary in order to get more detailed information for a particular part of the original graph. For example, if a user is interested in a specific node she should be able to selectively extend that summary class getting more detailed information for that particular part of the graph, without being exposed to other unrelated details. This idea can be combined with zooming operations allowing users to request more details on a specific region showing gradually more neighbor connections.
A new direction we intend to explore is how our implementation can be extended in order to produce the schema summary of large schemas in the Linked Data Cloud. Instead of relying on reference summaries for the evaluation of the automatically produced summaries, an interesting idea is to check if these summaries are able to answer the most common queries formulated by the users. Finally, another interesting topic would be to extend our approach to handle more constructs from OWL ontologies such as class restrictions, disjointness and equivalence dropping also the unique name assumption.
As the size and the complexity of schemas and data increase, ontology summarization is becoming more and more important and several challenges arise.
Footnotes
Acknowledgements
The authors would like to thank Maria Theodoridou, Christos Georgis, George Bruseker, Yannis Marketakis and Nikolaos Minadakis for providing the reference summaries, Yannis Roussakis for calculating the changes in Stage 3 evaluation and Ioannis G. Tollis for the useful discussions on graph algorithms.
This work was partially supported by the EU projects DIACHRON (FP7-601043), iManageCancer (H2020-643529) and MyHealthAvatar (FP7-600929).