
Abstract
This paper introduces DataGraft (
Introduction and motivation
For the past five years, government and non-government institutions in the EU and around the globe have increasingly made data accessible under open licenses and often in reusable formats [3]. Recent statistics clearly display the achievements of these efforts. According to the EU-funded project OpenDataMonitor, 28 European countries have published more than 237,500 datasets through more than 160 catalogues [7]. Compared to the Zettabytes of data that the Internet is estimated to host, 1.25 Terabyte of open data spread across Europe may still appear like a modest result. But given the limitations and difficulties which data publishers and consumers face so far, it is not. A large portion of the data openly available online consists of unstructured or semi-structured information [8], which often makes data consumption difficult and expensive [16]. Furthermore, removing barriers from open data publication and consumption processes remains a primary concern.
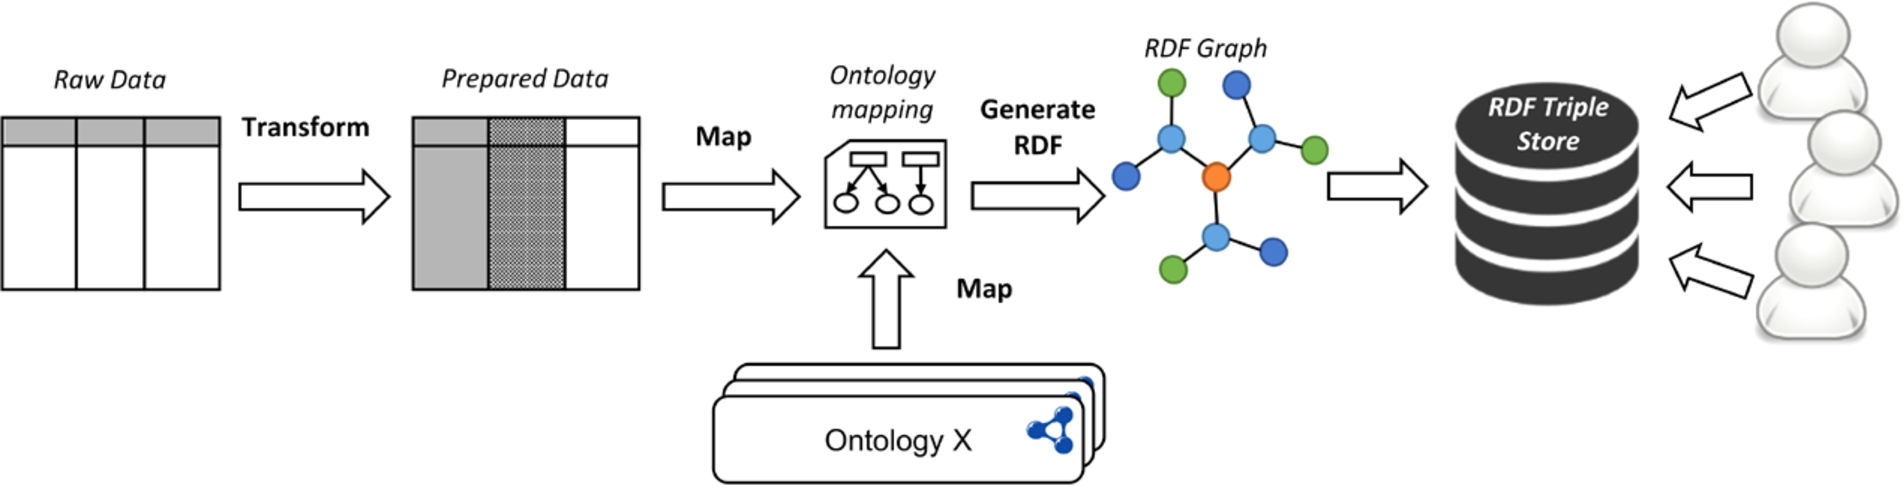
Typical data transformation/publication and access process: from tabular data to a queriable semantic graph.
DataGraft started with the mission to alleviate some of these obstacles through new tools and approaches that support a faster and lower-cost publication and reuse of open data.
Open data is increasingly showing effects in solving problems for the public and private sectors, as well as addressing issues related to the environment and society. Figure 1 displays a typical process for the creation and provisioning of linked open data. Raw data, most often tabular data [22], need to be cleaned, prepared, and transformed to RDF. The data cleaning phase of the process consists of steps related to removing data anomalies. Steps during the cleaning phase may relate to normalising the data (e.g., splitting data values, transposing the dataset, extracting information from the headers, etc.), correcting the data (e.g., filling missing fields, correcting word spelling, replacing special characters, etc.), removing duplicate values, or any other dataset-specific cleaning operations. The preparation phase consists of any additional operations that are specifically needed for the process of RDF transformation (e.g., annotation of data with URIs). Once data are prepared, they are transformed through a mapping, into an RDF graph conforming to the user’s chosen ontology and data model. The resulting RDF is then stored in a semantic graph database, or triple store, where data users can easily access and query the data. Conceptually, this process is rather straightforward, however, to date, such an integrated workflow is not commonly implemented. Instead, publishing and consuming (linked) open data remains an intricate, tedious task due to a combination of the following three reasons:
The technical complexity of cleaning and preparing open data for publication is high. The technical complexity typically includes a steep learning curve, the need for a lot of configuration and customisation, the lack of scalability with increasing volumes of data, and poor support for developers or end users. Furthermore, toolkits are typically poorly integrated and require expert knowledge. Such expertise includes knowledge of linked data technologies and tools, database and system administration (for maintaining the necessary infrastructure for the proprietary tooling). This is especially true when it comes to more advanced publications of linked data that require consistent, manually curated metadata.
Even when the data cleaning and preparation process is supported, organisations still face considerable costs to expose their data and provide reliable and scalable access to them. Especially in the absence of direct monetisation or other cost recovery incentives, the relative investment costs can easily become excessively high for many organisations. This might result in open data publishing initiatives being postponed, or executed in a way that makes data access and reuse difficult.
A poorly maintained and fragmented supply of open data also causes problems for those who want to reuse this resource. Firstly, in many cases, datasets are provided through a number of disconnected outlets. Additionally, even sequential releases of the same dataset are often formatted and structured in different ways. For example, column orders might have changed from one release to the next. Such basic errors make even very simple projects hard to sustain, e.g., running a web application, which relies on a single, continuously updated dataset.
Furthermore, there are a number of interesting problems that require smart solutions in order to assist data publishers and developers in the process depicted in Fig. 1:
Interactive design of data transformations: Designing transformations that provide instant feedback to users on how data changes can speed-up the process and provide users with mechanisms to ensure that the individual clean-up and preparation steps result in the desired outcome.
Repeatable data transformations: Very often a data transformation/publication process needs to be repeated as new data arrives (e.g., monthly budget reports are published through the exact same process each month). Executable and repeatable transformations are a key requirement for a scalable and lower-cost data publication process.
Reusable and shareable data transformations: Capabilities to reuse and extend existing data transformations created and shared by other developers further improve the speed and lowers the cost of the data publication process.
Distributed deployment of data transformations: Transforming data necessitates a varying resource utilization due to the varied load requirements with different inputs. Thus, having mechanisms to dynamically deploy and execute transformations in a distributed environment results in a more reliable, scalable and faster data publication process.
Reliable data access: Once data are generated following a data transformation process, provisioning it reliably is another key aspect to ensure access to the data from third party applications and services.
What is therefore needed is an integrated solution that enables a self-serviced effective and efficient data transformation/publication and access process. At the very core, this means automating the open data publication process to a significant extent – in order to increase the speed and lower its cost. What this will eventually lead to is that both data publishers and data consumers can focus on their goals:
Data consumers can focus on utilising open data for data-driven decision making, or for creating new applications and services (rather than being data “hunters” and “gatherers”);
Data publishers can focus on providing high quality data in a timely manner, and finding monetization channels for their data (rather than spending time and resources on developing their own data publication & hosting platforms).
DataGraft was developed as a cloud-based platform for data workers to manage their data in a simple, effective, and efficient way, supporting the data transformation/publication and access process discussed above, through powerful data transformation and reliable data access capabilities.
The remainder of this paper provides an overview of DataGraft’s key features and core components (Section 2), evaluation (Section 3), discussion on related systems (Section 4), ending with a summary and outlook (Section 5).
DataGraft was designed and developed to support two core capabilities: data transformations and reliable data access.
For data transformations, DataGraft provides the following features:
Interactively build data transformations;
Deploy executable transformations to repeatedly clean, prepare, and transform spreadsheet data;
Share transformations publicly;
Fork, reuse and extend transformations built by third parties from DataGraft’s transformations catalogue;
Programmatically access transformations and the transformation catalogue.
Related to reliable data access, DataGraft provides the following features:
Data hosting on DataGraft’s reliable, cloud-based semantic graph database;
Query data through generated SPARQL endpoints or access data via linked data APIs;
Share data publically;
Programmatically access the data catalogue;
Operations and maintenance performed on behalf of users.
DataGraft realizes these capabilities through four core technical components, as shown in Fig. 2.

Core components of DataGraft.
Grafter2
It is implemented using Clojure, a functional programming language that runs on the Java Virtual Machine (JVM). A functional approach is well suited to the idea of a transformation pipeline and by using a JVM-based implementation it becomes straightforward to exploit the large collection of useful libraries already available for the ecosystem of JVM-based programming languages.
Grafter benefits additionally include:
Clean-up, preparations and transformations to RDF are free from side effects and implemented as pure functions on immutable data. This is important in supporting transformation previews as data is not changed in place, and transformations can be run without causing potentially destructive effects. Additionally reasoning about pure functions is simpler than reasoning in imperative model, as functions only take values and return them, whereas procedures can do this and cause unrestrained side effects. Grafter supports large data transformations efficiently. Unlike other tools it takes a streaming approach to processing data, which means the maximum size of the dataset that can be processed is not limited by the available memory. The streaming approach leverages Clojure’s lazy sequences to represent the sequence of rows in the data. Clojure’s lazy sequence abstraction allows to treat unrealized data as if they were realized, which is achieved through in-memory sequences. As values are required from the sequence, they are realized and cached in memory within the sequence abstraction. It supports an easy way to convert tabular data into linked data, via graph templates, which specify how a row of tabular data maps to a set of RDF triples. In Grafter, graph templates are defined as part of the functions, which can be called when the tabular data needs to be transformed to RDF. It has an efficient streaming implementation of a normalising melt [23] operation (going from a ‘wide’ table format to a ‘long’ table format), that lets you easily change cross-tabulations featuring arbitrary numbers of categories (frequently used to summarise data), back into a normalised representation suited for machine processing. A common use case is in converting pivot tables [24]. It provides APIs for serialising linked data in almost all of its standard serialisations. It provides integration with semantic graph databases (triple stores) via standard interfaces. It has a highly modular and extensible design.

Grafter architecture stack.
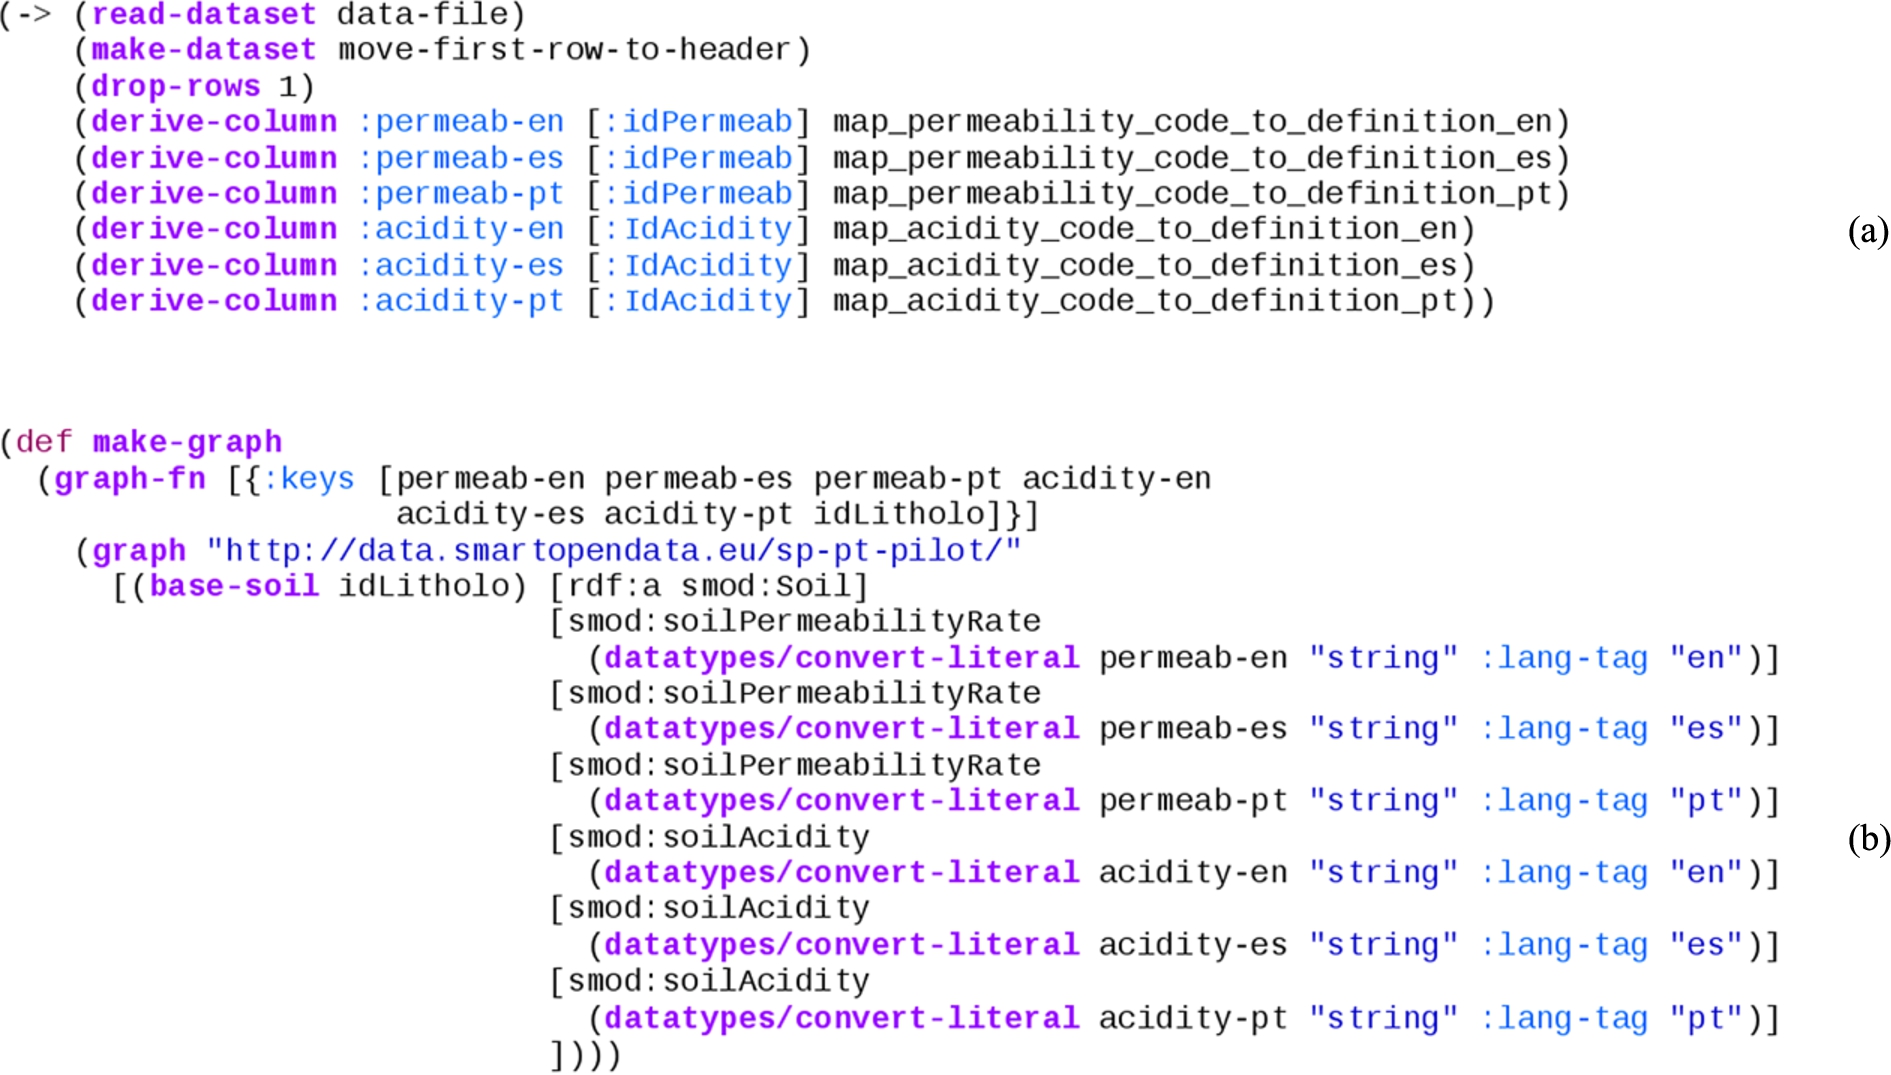
Grafter sample code of data transformation (a) and creation of RDF triples (b).
Grafter is composed of a number of modules to cleanly demarcate functionality, as illustrated in Fig. 3. These modules broadly fall into two categories identified by the namespaces
The cleaning and preparation of tabular data.
The transformation and loading of that data into linked data (RDF).
The
Functionality is also being added to help materialise errors and ensure they can be displayed in the appropriate cell or context where they occur.
Tabular Grafter transformations are typically expressed as a sequence of step-wise operations on whole tables of data. All tabular operations are simply pure functions that take a dataset (a table) as input, and produce a dataset as output.
This can be seen in the example Grafter code in Fig. 4(a). This tabular dataset transformation processes a spreadsheet where each line represents a function call that receives a dataset (table) and returns a new one that has been changed. Sequences of tabular operations such as those, where a table is received as input and returned as output, are called pipes.
Pipes are simply a set of pure functions, composed together with the restriction that they receive a dataset as their first argument, and must return a dataset as their return value. The interesting property about pipes is that they can be composed together arbitrarily, and always result in a valid pipe. Additionally because the inputs, outputs and intermediate steps to pipes are always tables, they are very intuitive for users to manipulate and use.
In order to publish linked data, a final step must take place to transform the input data and produce the graph structure used by RDF. This final step is referred to as a graft. A graft maps each row of the source data into a graph. That graph is made up of a sequence of ‘quads’ as used in the RDF approach, each consisting of a subject, predicate, object and context.
Because a graft takes as input a table and returns a lazy sequence of quads representing the linked data graph as its output, it doesn’t have the composition property that pipes do. However, additional filtering steps can be added to the stream of quads if necessary.
Typically the bulk of clean-up and preparations are best performed whilst the data is in the table, though post processing can be performed by filters.
Grafter supports a simple graph template to express the conversion of each row of an input tabular dataset into a graph. That template makes use of a simple sub-DSL to specify commonly-used RDF generation, combined with selections from the input data and literal values.
The code in Fig. 4(b) is used to express the mapping of columns in a tabular dataset into its position in a linked data graph.
Generating RDF from tabular data with the help of Grafter is compliant with the W3C recommendation defined in [21], although doesn’t follow it precisely. The conversion procedure described in the W3C recommendation operates on an annotated tabular data model and provides an exact algorithm for data conversion. In contrast, Grafter provides more flexibility by allowing users to add necessary annotations to the table just before the conversion to RDF and to define proprietary algorithms for generating it.
In DataGraft, Grafter comes together with
The ability to execute a given Grafter transformation on the entirety of a supplied tabular dataset. The results of the whole transformation are returned.
The ability to specify a page of data in the tabular data to apply the supplied Grafter transformation to, and to return a preview of the results of the transformation on that subset.
The first of these features ensures that transformations hosted on DataGraft can be applied to arbitrary datasets, generating results for download or hosting. The second feature for generating live previews of the transformation is critical to providing a high quality interactive user experience via the interface. Graftwerk supports both of these features on both kinds of transformations: pipes and grafts.
Further information about Grafter and Graftwerk can be found in [12] and [11].

Grafterizer transformation pipeline and preview (a) and RDF mapping (b).
Grafterizer [20] is the web-based framework for data cleaning, preparation and transformation based on Grafter. It provides an interactive user interface with end-to-end support for data cleaning, preparation (Fig. 5(a)) and RDF transformation (Fig. 5(b)):
Live preview – Grafterizer interactively displays the results of the tabular clean-up or preparation steps in a side-panel. It also retains a view of the original version of the uploaded tabular dataset. Additionally, in case errors in the transformation or RDF mapping are present, it is equipped with an integrated error reporting capability.
Forking of existing transformations – the user interface allows users to create copies of transformations by a single click of a button.
Specifying and editing data cleaning (pipeline) steps – the clean-up and preparations performed on tabular data can be added, edited, reordered or deleted. All functions are parameterised and editing allows users to change each of these parameters within the function with immediate feedback.
Data page generation – based on the specified RDF mappings, users are able to directly produce and publish data pages where their data will be available for access through an endpoint.
Direct download of resulting data – the cleaned-up/transformed data from Grafterizer (both CSV and mapped RDF) can be directly accessed and downloaded locally.
Customisation – data clean-up and preparation are fully customisable through embedding custom code, both as individual clean-up/preparation steps, or part of certain steps. Developers can directly edit the resulting Clojure code and see the result in interactive mode.
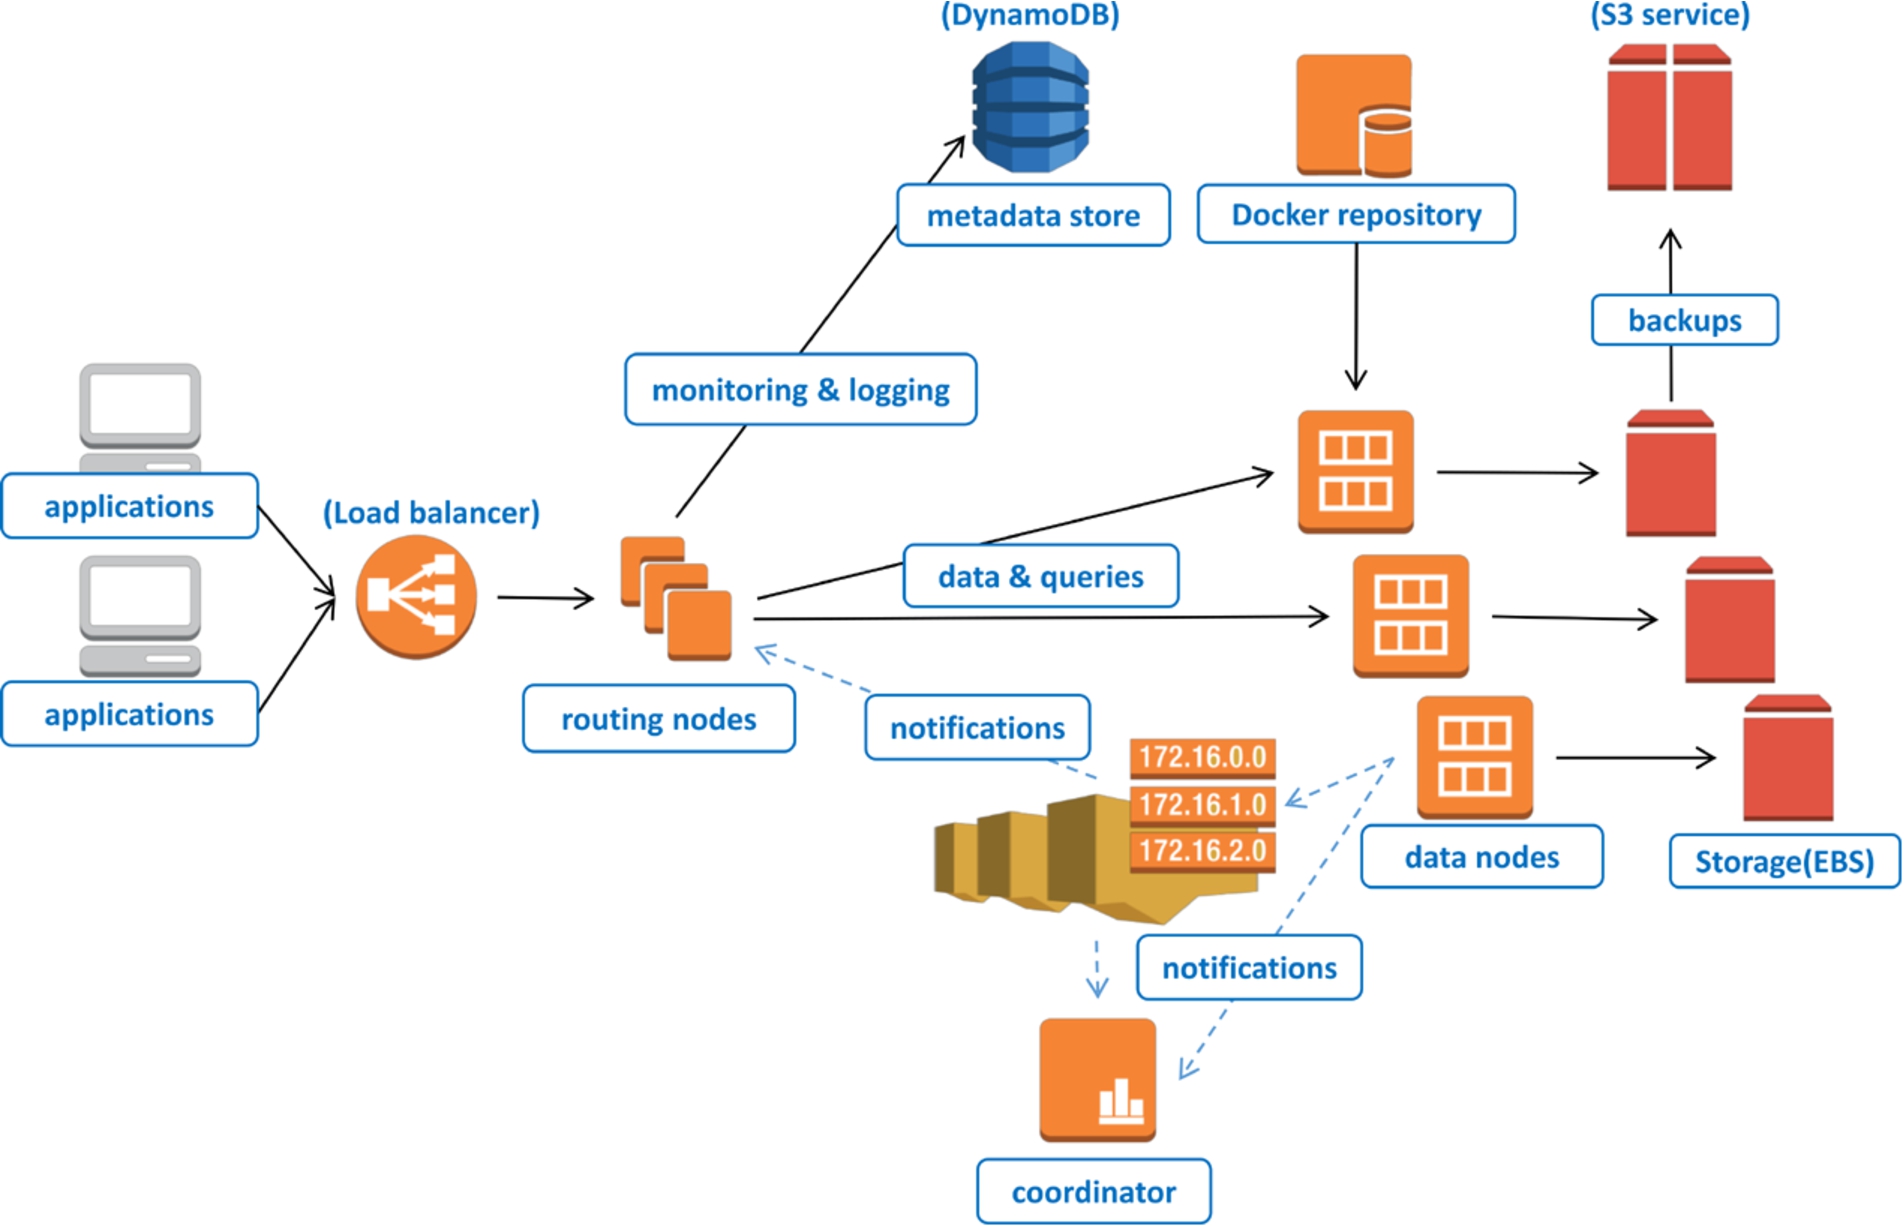
Architecture of the RDF DBaaS.
Grafterizer implements a web-based wrapper over the Grafter library and Graftwerk service. The interface allows users to specify Grafter transformations in a much easier and more intuitive manner, compared to directly coding in Clojure. It also provides instant feedback alongside the other features described in the previous section.
The Grafterizer interface works by submitting the transformation that is being specified to the Graftwerk service along with the data that needs to be cleaned, prepared and/or transformed. Depending on the type of the request, Graftwerk will then either generate a preview of the data that the UI can display, or return the output data (linked or tabular).
In order to produce linked data, RDF mappings are (typically) executed over well-formed CSV files, whereby each row contains one entity and each column represents an attribute of the entity. Nevertheless, Grafterizer is meant to operate with any form of CSV input, whereby any malformed CSV can be normalised into a well-formed one-record-per-row/one-field-per-column structure using the data transformation functions provided in the UI. The result of a transformation can be either a set of RDF triples that can be hosted on DataGraft in its semantic graph (RDF) store (described in the next subsection), or a tabular dataset that can be downloaded or accessed from the platform’s file storage.
Further information about Grafterizer and its integration with DataGraft can be found in [19].
DataGraft’s database-as-a-service is a fully managed, cloud-based version of GraphDB™ semantic graph database (triple store), which provides an enterprise-grade RDF database as-a-service. Users therefore do not have to deal with typical administrative tasks such as installation and upgrades, provisioning and deployment of hardware, back-up and restore procedures, etc. The utilization of cloud resources by the DBaaS depends on the load of the system itself, whereby they can be elastically provisioned and released to match the current usage load.
From a user standpoint, the DBaaS supports an API for linked data access, querying, and management. These functionalities are based on a complex architecture, which ensures components scalability, extensibility and availability on large scale (see Fig. 6).
The DBaaS implementation follows the principles of micro-service architectures, i.e., it is composed of a number of relatively small and independent components. The data management architecture is based on the Amazon Web Services (AWS) cloud platform and consists of the following components:
Load balancer – the entry point to the database services is the load balancer provided by the AWS platform, which routes incoming data requests to one of the available routing nodes. It can distribute requests even between instances in different datacentres.
Routing nodes host various micro-services such as: user authentication, access control, usage, metering, and quota enforcement for the RDF database-as-service layer. The front-end layer is automatically scaled up or down (new instances added or removed) based on the current system load.
Data nodes – this layer contains nodes running multiple instances of the GraphDB™ database (packaged as Docker3
Integration services (denoted by dashed arrows in Fig. 6) – a distributed queue and push messaging service enable loose coupling between the various front-end and database nodes on the platform. All components use a publish-subscribe communication model to be aware of the current state of the system. This allows the front-end and the backend layers to be scaled up or down independently as they are not aware of their size and topology.
Distributed storage – all user data are stored on the reliable and redundant network-attached storage (EBS), whereas static backups and exports remain on the S3 distributed storage. Logging data, user data as well as various configuration metadata are stored in a distributed NoSQL database (DynamoDB).
Monitoring services – the AWS cloud provides various metrics for monitoring the service performance. The DBaaS utilises these metrics in order to provide optimal performance and scalability of the platform. The different layers of the platform can be automatically scaled up (to increase system performance) or down (to decrease operational costs) in response to the current system load and utilisation.
Further information about semantic graph database used in DataGraft can be found in [4].
The DataGraft portal integrates the previously discussed components together in a modern, user-friendly web-based interface designed to ensure a natural flow of the supported data processing and publication workflow. Accordingly, four main aspects have been considered and addressed throughout the development of DataGraft’s portal front-end:
Design and implement a highly intuitive UI, which facilitates user interaction with large, complex sets of linked open data.
Simplify the data publishing process by implementing a fast-track for publishing data, e.g., using simple drag and drop operations.
Create basic data exploration tools, which help users with limited technical skills to explore data hosted on the DataGraft platform.
Deploy data visualization components that can be easily used by non-specialists to build data driven portals.

Configuring widgets (a) and visualizing data (b) in DataGraft.
Two complementary modules have been implemented to create the DataGraft portal. The first module enables users to easily publish and annotate data using a drag-and-drop interface. The entire process of publishing data is thus reduced to a simple wizard-like interface, where publishers can simply drop their data and enter some basic metadata. All data that are published on the platform are accessible via data pages. Users who publish on DataGraft can specify whether the data is made publically available or not (i.e., if the data page is public or private) and the license under which the data is made available. Finally, the DataGraft portal provides a module that helps visualize data from the semantic graph database (triple store). Publishing data on the web usually implies specific programming skills in order to create web pages or portals. Thereby, the programming process has been all but eliminated through the deployment of visualization widgets that can serve as reusable components for data publishing. These widgets can access and use data in the repository and expose it through a data page. Currently, the platform provides a number of visualization widgets, including tables, line charts, bar charts, pie charts, scatter charts, bubble charts and maps (using the Google Maps widget). All widgets are populated with data through the use of specific SPARQL queries on RDF databases.

Data pages catalogue (left) and data transformations catalogue (right).
Figure 7(a) depicts the configuration of a line chart widget using SPARQL for comparing statistical data on employment in two municipalities in Norway, and the result of the visualization on a data page is shown in Fig. 7(b).
Further information about the DataGraft portal can be found in [26].
In addition to the core components described above, DataGraft comes with a set of services (that can be accessed through RESTful APIs) for managing data and transformations, user management, security and authentication.
DataGraft provides capabilities to search the data pages and data transformation catalogues. Figure 8 depicts the data transformations and data pages catalogues as seen by a DataGraft user.
Examples of back-end services for data transformations include CRUD operations on transformations catalogue (create, retrieve, update, or remove data transformations), as well as distribution of transformations code and services supporting the interactive preview of transformations.
Examples of back-end services for data include: CRUD operations on data pages catalogue (create, retrieve, update, or remove data pages); distribution of data (DCAT5
Further information about the DataGraft backend services can be found in [19] and [4].
Table 1 summarizes the technical components of DataGraft and Fig. 9 provides an architectural overview and how components are interdependent.
Summary of DataGraft components and their capabilities
The DataGraft platform was launched in public beta in September 2015. Early usage figures show that the platform, by beginning of December 2015, has:
495 (91 public) registered data transformations
1520 uploaded files
181 registered users
183 public data pages
DataGraft has been used in various domains to transform and publish data. In general, the following positive aspects resulted from the use of DataGraft in practice:
Simplified data publishing process;
Time-efficient data transformation and publishing process;
Repeatable and sharable data transformation process;
Data hosting and querying support, with possibility to visualize data;
Support for integration of transformed RDF data with external data sources using established web standards.
In the following we provide examples of how DataGraft was used in practice, the positive aspects and limitations identified in those examples.

DataGraft high level components interactions.
Saltlux,6
Aside from building an attractive and engaging end-user interface, the main challenges associated with PLUQI were to integrate and/or merge data from various sources, e.g., open data portals, social sensor systems, etc. This index model takes into account data from various domains such as daily life satisfaction (weather, transportation, community, etc.), healthcare level (number of doctors, hospitals, suicide statistics, etc.), safety and security (number of police stations, fire stations, crimes per capita, etc.), financial satisfaction (prices, income, housing, savings, debt, insurance, pension, etc.), level of opportunity (jobs, unemployment, education, re-education, economic dynamics, etc.), and environmental needs and efficiency (green space, air quality, etc.).
PLUQI was implemented in two iterative versions. The first implementation used Korean data, providing a semantic integration of heterogeneous open data from the Korean Statistical Information Service (KOSIS). This included nine files processed in DataGraft with the help of five reusable transformations. Four of them were created via the forking (copying) capabilities of DataGraft. The transformations for the Korean data processing included 15 special utility functions with custom code, 10 of which were reused across different transformations. The second implementation has been developed based on similar data about Scotland (from the statistics office of the Scottish Government, and other open data), and it compares the PLUQI index between Edinburgh and other council areas.
A typical process for implementing an application such as PLUQI requires four main steps: (1) data gathering (identifying relevant data sources); (2) data transformation (cleaning, preparation, harmonization, integration); (3) data provisioning (making integrated data reliably available); and finally (4) implementing the application (e.g., web application, visualizing and accessing the provisioned data). DataGraft was used for steps (2) and (3) for transforming/integrating data, and reliably provisioning the data. Saltlux reported reduction of cost for implementing these steps of approximately 23% compared to traditional approaches (i.e., use of spreadsheets for data transformation and data publication, proprietary tooling, or technologies, such as relational databases and manual coding/scripting) for integrating and provisioning data. This enabled Saltlux to focus on steps (1) and (4) while outsourcing the other two steps to DataGraft.
DataGraft was perceived as a convenient platform to integrate various datasets into one repository based on the linked data approach. It supports transformation features for raw datasets, which are not written in RDF format so that they can be retrieved using SPARQL queries, linking them to other datasets. This functionality was recognised as very powerful for services such as PLUQI that need to use various datasets. Data are also expected to be retrievable from one repository, enabling a reasonable response time against the user’s requests. PLUQI illustrates the capability of DataGraft to support a wide variety of data integration and analysis applications.
The capability of DataGraft to allow users to share data transformations was considered as a really useful feature when transforming datasets with related structure. For example, when transforming air quality data for different cities – one transformation pipeline for one city was reused with small modifications to transform air quality data from other cities. In addition, most of the input files for PLUQI contained the same quality issues (e.g., not normalized headers, malformed column header labels, etc.) and required similar transformation operations for transposing data, reformulating column header labels and bringing data into a normalized form. However, these operations were not exactly the same for every input file because of their structure. DataGraft allowed formulating complex transformation operations as parameterized utility functions and forking the entire transformation with all the utility functions within the transformation. Creating the transformations via the forking capability of DataGraft made it possible to avoid the tasks related to creating normalization functions from scratch. Instead, it allowed reusing them with different parameters, which significantly reduced the time and effort needed to transform the data.
When it comes to limitations, PLUQI revealed the need for DataGraft to export or share visualization widgets that can be used by third party services or applications: currently, the data pages in DataGraft provide capabilities to visualize datasets in various widgets, but it was pointed out by PLUQI developers that it would be useful to implement exporting and sharing features for widgets, in order to raise the usability of the portal. In addition, DataGraft did not provide capabilities for ontology editing, and therefore the PLUQI developers had to use third party ontology editing tools such as Protégé to create the ontologies against which that data was annotated in the RDF publication process.
Further information about the PLUQI application can be found in [2] and [9].
As part of the SmartOpenData project,7
The ability to ‘fork’ (copy, then adapt) existing transformations allowed users to easily reuse existing transformations and thus save time in the process of creating a new transformation.
The ability to edit the parameters of each transformation step interactively, and to change the order of steps, helped them to: create transformations in general, detect and correct mistakes, experiment with different parameters for clean-up and preparation steps, specify proprietary transformation designs (through the ability to add utility functions with custom code) and reuse proprietary functions across different transformations.
The users identified some features not currently available in Grafterizer that would have made the tools more useful for them, notably the ability to join more than one input dataset and the ability to sort datasets. To overcome these limitations, it was necessary to carry out some pre-processing of the input files (e.g., for one transformation, 27 of the 43 files tested required some pre-processing). It is possible to perform joins and to sort inside a Grafter pipeline, but at the time of the writing of this paper, the Graftwerk back-end did not yet provide explicit support for these operations.
Statsbygg8
Noted benefits for use of DataGraft in this context included the possibility to create a “live” services (vs. storing and managing information about public buildings using spreadsheets) that can be easily updated as new data becomes available, efficient sharing of data, and simplified integration with external datasets. On the other hand, lack of selective data sharing in DataGraft was pointed out – it is often the case that some buildings such as prisons or King’s properties are not to be shared in an open fashion. This is not necessarily a technical deficiency of DataGraft but it is rather expensive to enforce it in practice. Group- or role-based access control of DataGraft assets (which as of the writing of the paper is not supported in DataGraft), could be a potential solution to share data selectively.
Another example where DataGraft has been applied is in publishing statistical data as RDF, querying and visualization. For instance, DataGraft was applied for cleaning, preparation, and transformation statistical data from StatBank Norway.9
DataGraft has been used in other contexts for transforming and publishing data, such as air quality sensor data from the CITI-SENSE project,11
Currently DataGraft is offered as a free service with some imposed limitations per account as follows:
Data upload: Users can upload CSV files of up to 10 MB each, and RDF files of up to 100 MB each;
Data pages: Users can have up to 10 RDF data pages;
Persistent storage: Users can host up to 2 GB of CSV data, and 10 Million RDF triples for RDF data.
The number of databases that are hosted on a single virtual machine (data node) varies depending on the amount of available hardware resources. The currently deployed (the default free offering) data nodes on DataGraft host eight RDF databases per node with up to 10 repos per database of up to 10 million triples. Each RDF database has around 2 GB of reserved memory for performing queries. The amount of reserved memory can be re-configured on request (or based on the needs of the platform) – it can be set to 1, 2, 4, 8 or 16 GB based on the size of the database and performance requirements. As of now, the limitations for data upload, number of data pages and persistent storage are enforced in order to maintain DataGraft as a free offering to its users. Nevertheless, DataGraft does allow for the hosting and transformation of much larger quantities of data. The largest deployed database in DataGraft (not supported as a free offering) can host up to 1 billion triples in up to 50 repositories. Transforming large quantities of data is implemented through taking advantage of the Clojure (Grafter) compatibility with the JVM. This means that all transformations specified in DataGraft can be bundled into executable Java Archives (JAR files). These JARs are available through a DataGraft service and can be downloaded and executed locally to process arbitrarily large inputs.
DataGraft offers an integrated, flexible, and reliable cloud-based service, whereby maintenance of resources and infrastructure are transparent to the user. This frees data experts from having to deal with systems engineering aspects and enables them to focus on their domains of expertise related to the actual data tasks. Furthermore, its unique combination of features provides out-of-the-box and integrated tools, which reduces the effort to quickly implement a process of data transformation and publication. The combination includes features such as interactivity in data transformations, the provided DSL to implement them, reliability, seamless data provisioning, scalable cloud-based triple store, and other user-oriented features (e.g., the catalogues, data visualizations, and programmatic APIs to its capabilities) – all provisioned out-of-the-box for the user. This combination of features and functionalities sets DataGraft apart from other approaches, which, although in some cases can be hosted on the cloud, typically lay the burden of provisioning of resources and maintenance on the users.
Related systems fall under the types of systems for linked data and open data publication/hosting and ETL tools. In the following we outline the most relevant systems and discuss the differences.
The Linked Data Stack [1] is a software stack consisting of a number of loosely coupled tools, each capable of performing certain sets of operations on linked data, such as data extraction, storage, querying, linking, classification, search, etc. The various tools are bundled in a Debian package and a web application can be deployed to offer central access to all the tools via a web interface.15
OpenRefine,20
Datalift [17] is a software framework for linked data publishing. It consists of a set of modules such as vocabulary management, data conversion, and interlinking. Besides being a framework that needs to be installed, configured, provisioned, and maintained by the user, Datalift’s approach to conversion of tabular data to linked data is rather lightweight in comparison to DataGraft. Furthermore, Datalift is considered as an “expert tool” [17]. For example, it comes with no GUI to support data publishers in the data publication process. A similar framework to Datalift is the Linked Data Integration Framework (LDIF) [18], focused on data integration using linked data. ClioPatria [25] is a more recent system, extending the SWI-Prolog RDF store with capabilities such as a SPARQL and LOD server, and mechanisms to browse and query data. DataGraft’s triplestore goes beyond the capabilities of the SWI-Prolog RDF store in the sense that it’s designed for cloud-based systems. DataGraft is a more comprehensive framework addressing wider aspects of data publishing such as being a public infrastructure for data and data transformations sharing and including capabilities for data cleaning and transformation, which appear to be outside of the scope of ClioPatria
PublishMyData23
The Linked Data AppStore [14] is a Software-as-a-Service platform prototype for data integration on the web. It integrates a set of linked data related tools for tasks such as data cleaning, transformation, entity extraction, data visualization, crawling in a in a loosely coupled service infrastructure and served as inspiration for the development of DataGraft.
Related systems that are not focused on the linked data paradigm include solutions for open data catalogues and more traditional ETL tools. Open data catalogues typically list open datasets, together with the metadata and references (e.g., URLs) to where the data are made available. In some cases the actual datasets are also hosted with the data catalogue. However, in most cases data catalogues provide only download links without any sophisticated infrastructure for querying data to support other aspects of the ETL process. Popular data catalogue solutions include CKAN24
Commercial examples of relevant ETL tools include Pentaho Data Integration26
To summarize, none of the existing solutions in linked data tools, open data publishing platforms or ETL tools meet the requirements addressed by DataGraft. Firstly, all of the examined linked data tools outsource the technical complexity of provisioning and managing the infrastructure to their users. This means that they require expert knowledge to operate, which makes them costly to use and difficult to sustain. Furthermore, they are not well-suited for a cloud service environment (they are not designed to be scalable and reliable in a cloud-based environment) and most of them do not have an interactive user interface. In some cases linked data tools do have a user interface, but operate inefficiently and are not suitable for robust linked data publication. On the other hand, open data publication and hosting tools provide a serviced solution to their users. However, such tools lack support for data transformation and in some case leave the data provisioning and management tasks to their users. This causes data to be fragmented across many sources and thus difficult to use and integrate. Finally, ETL tools provide powerful capabilities for producing workflows diagrammatically. However, they are not well-suited for a cloud-based environment/hosting of data, do not provide support for linked data, and typically lack interactive previews of the state of the data at each step of the ETL process.
DataGraft addresses all these issues by providing a reliable cloud service for transforming and hosting data, whereby all upfront and operational costs for acquiring and maintaining technical infrastructure for provisioning the data are outsourced to the platform, additionally reducing the technical complexity for data publishers.
DataGraft [13] is an emerging solution (as-a-Service) for making linked open data more accessible. It comes with a platform, portal, methodology, and APIs – all packaged in an online service, functional and documented.28
DataGraft’s features include: interactive cleaning, preparation and transformation of data, repeatable and reusable data transformations, flexible deployment of transformations, RDF data publication and querying, support for integrating and visualising data from different sources. Additionally, DataGraft can be used with third party tools as it has been built with easy integration in mind using standard web technology. For example, users can browse data hosted on DataGraft with tools such as GraphRover29
Graftwerk and RDF DBaaS are closed source, while Grafter,31
DataGraft is currently under development and operated by the proDataMarket project.34
Footnotes
Acknowledgements
The development of DataGraft was co-funded through grants from the European Commission (EC). DataGraft was developed and operated by the DaPaaS project (GA no. 610988) until November 2015. Further development, maintenance, and operations continue under the proDataMarket project (GA no. 644497). The projects SmartOpenData (603824) and InfraRisk (603960) also contributed to DataGraft.