
Abstract
This paper presents a novel approach to Linked Data exploration that uses Encyclopedic Knowledge Patterns (EKPs) as relevance criteria for selecting, organising, and visualising knowledge. EKP are discovered by mining the linking structure of Wikipedia and evaluated by means of a user-based study, which shows that they are cognitively sound as models for building entity summarisations. We implemented a tool named Aemoo that supports EKP-driven knowledge exploration and integrates data coming from heterogeneous resources, namely static and dynamic knowledge as well as text and Linked Data. Aemoo is evaluated by means of controlled, task-driven user experiments in order to assess its usability, and ability to provide relevant and serendipitous information as compared to two existing tools: Google and RelFinder.
Keywords
Introduction
In the Semantic Web vision [6] agents were supposed to leverage the Web knowledge in order to help humans in solving knowledge-intensive tasks. Nowadays, Linked Data is feeding the Semantic Web by publishing datasets that rely on URIs and RDF. However, it is still difficult to enable homogeneous and contextualised access to Web knowledge, for both humans and machines, because of the heterogeneity of Linked Data and the lack of relevance criteria (a.k.a. knowledge boundary problem [22]) for providing tailored data.
The heterogeneity problem is due to different data semantics, ontologies, and vocabularies used in linked datasets. In fact, Linked Data is composed of datasets from different domains (e.g., life science, geography, government). Moreover, some of them classify data according to a reference ontology (e.g., DBpedia) and others just provide access to raw RDF data. For example, if we consider the case of aggregating data from different linked datasets, we need a shared intensional meaning over the things described in these datasets in order to properly mash up facts about those things. The scenario is even more complex if we also take into account dynamic data coming from a variety of sources like social streams (e.g., Twitter) and news (e.g., Google News).
On the other hand, the knowledge boundary problem consists in the difficulty of identifying what configuration of data is really meaningful with respect to specific application tasks. Identifying meaningful data involves the need of establishing clear relevance criteria to be applied as a filter on data. As an example, we can consider an application that leverages Linked Data to provide a summary on some topic. If the topic of the summary is the philosopher Immanuel Kant, this application should provide users with tailored information concerning facts about Kant’s major works and ideas, but should skip facts that are too peculiar or curious, such as the nationality of his grandfather.
Elsewhere [22] we introduced a vision for the Semantic Web based on Knowledge Patterns (KP) as basic units of meaning for addressing both the heterogeneity and the knowledge boundary problems. More recently, we introduced Encyclopedic Knowledge Patterns [37] (EKP) as a particular kind of KP that are empirically discovered by mining the linking structure of Wikipedia pages. EKPs provide knowledge units that can answer the following competency question: What are the most relevant entity types
In this paper we exploit EKPs for designing a system that helps humans to address summarisation and discovery tasks. These tasks can be classified as exploratory search tasks as they involve different phases, i.e., look-up, learning and investigation [30], that characterise the strategies that humans adopt while exploring the Web. For example, consider a student who is asked to build a concept map about a topic for her homework. She starts by looking-up specific terms in a keyword-based search engine (e.g., Google), then she moves through search results and hyperlinks in order to investigate the available information about the topic, for finally learning new knowledge she can use to address her task.
a detailed description of the
an original evaluation of Aemoo by means of controlled, task-driven user experiments in order to assess its usability and ability to provide relevant and serendipitous information.
It is worth mentioning that there are state of the art systems that provide semantic mash-up and browsing capabilities, such as [26,27,54]. However, they mostly focus on presenting Linked Data coming from different sources, and visualising it in interfaces that mirror the Linked Data structure. Instead, Aemoo organises and filters the retrieved knowledge in order to show only relevant information to users, and providing the motivation of why a certain piece of information is included. The rest of the paper is organised as follows: Section 2 presents a method for extracting EKPs from Wikipedia; Section 3 presents Aemoo, a system based on EKPs for knowledge exploration; Section 4 describes the experiments we conducted for evaluating the EKPs and the system; Section 5 discusses evaluation results, limits and possible solutions to improve the system; Section 6 presents the related work; finally, Section 7 summarises the contribution and illustrates future work.
A general formal theory for Knowledge Patterns (KPs) does not exist yet. Different independent theories have been developed so far and KPs have been proposed with different names and flavours across different research areas, such as linguistics [19], artificial intelligence [3,32], cognitive sciences [4,21] and more recently in the Semantic Web [22]. As discussed in [22], it is possible to identify a shared meaning for KPs across those different theories, as “a structure that is used to organise our knowledge, as well as for interpreting, processing or anticipating information”.
In linguistics, frames are a form of KPs that were introduced by Fillmore in 1968 [19], in his work about case grammar. In a case grammar, each verb selects a number of deep cases which form its case frame. A case frame describes important aspects of semantic valency, verbs, adjectives and nouns. Fillmore elaborated further the theory of case frames, and in 1976 he introduced frame semantics [20]. According to Fillmore a frame is
“…any system of concepts related in such a way that to understand any one of them you have to understand the whole structure in which it fits; when one of the things in such a structure is introduced into a text, or into a conversation, all of the others are automatically made available.” [
20
]
In computer science, frames were introduced by Minsky [32], who recognised that frames convey both cognitive and computational value in representing and organising knowledge. His definition was:
“…a remembered framework to be adapted to fit reality by changing details as necessary. A frame is a data-structure for representing a stereotyped situation, like being in a certain kind of living room, or going to a child’s birthday party.” [
32
]
In knowledge engineering, the term Knowledge Pattern was used by Clark [11]. The notion of KP introduced by Clark is slightly different from frames as introduced by both Fillmore and Minsky. In fact, according to Clark, KPs are first order theories which provide a general schema able to provide terminological grounding, and morphisms for enabling mappings among knowledge bases that use different terms for representing the same theory. Clark recognises KPs as general templates denoting recurring theory schemata, and his approach is similar to the use of theories and morphisms in the formal specification of software.
More recently, Knowledge Patterns have been revamped in the context of the Semantic Web by Gangemi and Presutti [22]. Their notion of KPs encompasses those proposed by Fillmore, Minsky, and Clark, and goes further envisioning KPs as research objects of knowledge engineering and the Semantic Web from the viewpoint of empirical science.
In [37] we introduced the Encyclopedic Knowledge Patterns (EKPs). EKPs were discovered by mining the structure of Wikipedia articles. They are a special kind of Knowledge Patterns: they express the core elements that are used for describing entities of a certain type with an encyclopedic task in mind. The cognitive soundness of EKPs is bound to an important working hypothesis about the process of knowledge construction realised by the Wikipedia crowds: each article is linked to other articles when defining or describing the entity referenced by the article. DBpedia, accordingly with this hypothesis, has RDF-ised a) the entities referenced by articles as resources, b) the wikilinks as relations between those resources, and c) the types of the resources as OWL classes. EKPs are grounded in the assumption that wikilink relations in DBpedia, i.e. instances of the
Prefixes

The UML class diagram for the EKP
An EKP is a small ontology that defines a class S, and the typical relations
gathering the knowledge architecture of a dataset. The goal of this step is to create a model able to provide an overview over the structure of wikilinks by exploiting the dataset of Wikipedia page links available in DBpedia.3
The dataset is named
EKP discovery. This step is focused on the discovery of EKPs emerging from data in a bottom-up fashion. For this purpose we used a function, called
OWL2 formalisation of EKPs. In this step we apply a refactoring procedure to the dataset resulting from the previous steps in order to formalise EKPs as OWL2 ontologies.
Figure 1 shows the EKP
The prefix
As at DBpedia version 3.7.
Aemoo is a tool that exploits relevance strategies based on EKPs for supporting exploratory search tasks. It uses EKPs as a unifying view for aggregating knowledge from static (i.e., DBpedia and Wikipedia) as well as dynamic (i.e., Twitter and Google News) sources. We presented a preliminary version of Aemoo in [38].
We assume that the human action of linking entities on the Web reflects the way humans organise their knowledge. EKPs reflect the most frequent links between entity types, hence our hypothesis is that EKPs can be used for selecting the most relevant entities to be included in an entity-centric summary that can support users in knowledge exploration. In fact, Aemoo novelty is its ability to build entity-centric summaries by applying EKPs as lenses over data. In this way, Aemoo performs both enrichment and filtering of information. Enrichment and filtering are the two actions performed in order to address the knowledge heterogeneity and boundary problems. Users are guided through their navigation by both reducing and focusing the amount of available data: given an entity, instead of being presented with a bunch of triples, or a big unfocused graph, users navigate through units of knowledge, and move between them without losing the overview of the entity. In practice, an EKP determines a topic context according to its entity type. All relations between resources that emerge from the selected EKP are used as the basis for (i) selecting the information to be aggregated and (ii) visualising it in a concept map fashion. We discuss the first point in next section and the visualisation in Section 3.2.
Knowledge enrichment and filtering
Knowledge enrichment and filtering is obtained by performing the following steps:
identity resolution of a subject (provided by a user query) against Linked Data entities;
selection of the EKP corresponding to the subject type;
filtering and enrichment of static data about the subject, according to the model provided by the selected EKP;
filtering and enrichment of dynamic data about the subject, according to the model provided by the selected EKP;
aggregation of peculiar knowledge about the subject.
In next paragraphs we detail these steps.
a semi-automatic approach that leverages a DBpedia index based on the Entityhub8
The Entityhub is a component of the Apache Stanbol project, which relies on Apache Solr9 for building a customised entity-centric index of a linked dataset.
a completely automatic approach based on Entity Linking.11
Entity linking is the ability to resolve the referent of a term in a text, against an entity from a known knowledge base.
The subject of a user query.
identification of the most specific DBPO type t for a subject entity. This allows to avoid multi-typing and to be compliant with the method used for generating type paths (cf. Section 2);
retrieving the EKP associated with t from the index. If no association is available, Aemoo traverses the DBPO taxonomy of superclasses iteratively until an association is found. If no association is found again the EKP for
Here,
the subject entity is associated with its page links at lines 10 and 11;
each linked entity is bound to its type at line 14;
linked entities are filtered based on their types, according to the EKP. Based on the definition of type paths [37], we have:
where,
These queries generate entity-centric RDF models, used by Aemoo for building a summary description for a specific subject entity. For example, considering
Aemoo further enriches the resulting model, by identifying possible semantic relations that provide a label to wikilinks. It associates each wikilink type with a list of popular DBpedia semantic relations holding between the types involved in that wikilink type. For example, considering a wikilink type
This information is limited by the coverage of DBpedia.
A wikilink is a hyperlink in a Wikipedia page that is (almost17
An exception is represented, for example, by the infoboxes having wikilinks in table cells without any surrounding text.
Here the triple is annotated with the property
The prefix
The prefix
The prefix
The prefix
The prefix
“Lots of people love to read
where the triple is annotated with the property
The tweet_id has to be replaced with an actual tweed identifier available from Twitter.
The prefix
It is worth clarifying that not all co-occurrences are selected, but only those whose types are compliant with the intensional schema provided by the reference EKP for the subject entity. In fact, let us consider the tweet “Just bought another
In this section we motivate our design choices concerning the visualisation and the presentation of data in Aemoo.
Dadzie and Rowe [14], starting from the conclusion of Shneiderman [47], debate about the requirements that visualisation systems should fulfil for enabling the consumption of Linked Data depending on the target user, i.e., a tech-user (a user with a good knowledge of Linked Data and Semantic Web technologies) or a lay-user (a user with little knowledge of Linked Data and Semantic Web technologies). We focused on the design of Aemoo user interface (UI) for providing a visual presentation of data in order to enable its usage to lay-users. Hence, we took into account the following requirements:
data extraction and aggregation in order to provide overviews of the underlying data;
intuitive navigation;
support for filtering to users with no knowledge of formal query syntax, data structure and specific vocabularies used in the dataset;
exploratory knowledge discovery;
history mechanism for enabling undo or retracing of navigation steps;
support to detail data on demand.
The method described in Section 3.1 was designed to address requirements R1 and R3. Then, the main issue is to provide an intuitive visualisation (R2) that benefits from the way Aemoo extracts, aggregates and filters data for enabling exploratory search (R4). Designing an UI for supporting humans in exploratory search means to reduce the cognitive load required for activities like look-up, learning and investigation [30]. Novak and Gowin [36] demonstrated that concept maps are an effective means for representing and communicating knowledge for supporting humans in undertaking, understanding and learning tasks. Concept maps, introduced by [34], are diagrams that are typically used to depict relationships between concepts and they can be easily adopted in our case for visualising knowledge organised by means of EKPs. In fact, EKPs, similarly to concept maps, include concepts (i.e., DBPO classes) and relations among them. Thus, we claim that visualising knowledge in a concept map is a fair solution to help humans to construct their mental models [13] for addressing exploratory search tasks with Aemoo.
In fact, the concept map related to a subject entity is visualised by Aemoo using a radial graph with one-degree connections having:
the subject entity in the centre represented as squared node;
circular nodes around the subject entity that represent sets of resources of a certain type. Namely, they are the types of the resources linked to the subject entity that Aemoo aggregated and enriched from the various sources (cf. requirement R1). We refer to them as node sets. As previously described, such types are the ones that a user would intuitively expect to see in a summary description of an entity according to its type, as we described in Section 2.

Aemoo user interface.
The radial graph, referred as a bona fide metaphor for presenting data by some authors [17], was preferred to other visualisation solutions (e.g., tabular, tree, etc.) because it directly mirrors the structure of an EKP (cf. Fig. 1) and provides a “compass” deriving from the radial layout that is meant to be intuitive for the user navigation (cf. requirement R2). The compass allows to summarise and organise knowledge and can be used by the users (i) to enable exploratory features and (ii) to provide a mechanism to detail data on demand (cf. requirement R6). In fact, the user can hover with the pointer on the circular nodes of the graph in order to expand its knowledge and gather more and more detailed information. Additionally, the radial graph is interactive: all its elements can be clicked, including the new interface objects that are trigger by navigating it, causing the user to change and enrich the focus of the exploration. The interaction aspect is designed to address requirement R4, i.e. exploratory knowledge discovery. It is worth noting that, in case of much information, radial graphs can easily display messy and overcrowded layouts. However, in Aemoo the radial graph with one-degree connections prevents such situations as the graph goes to only one level below the root and the relationships are unweighted. Additionally, EKPs capture only 10 type paths on average (cf. our paper on EKPs [37]). Thus, in the most frequent case, Aemoo presents a radial graph having a subject entity surrounded by 10 node sets at most. Moreover, radial layouts allow more easily to keep the focus on the central area of the graph [9] that, in the case of Aemoo, includes both the subject entity and the node sets. Hence, the radial graph of Aemoo25
Based on a graph with one-degree connections.
Figure 2(a) shows an example of a concept map having Immanuel Kant as subject entity. Aemoo splits the interface into two parts: (i) on the centre-right side it visualises the concept map and (ii) on the left side it visualises a widget named entity abstract. An entity abstract provides a high-level overview on selected entities fulfilling requirement R1, along with the concept map. This overview consists of an entity label with its thumbnail, DBPO type and abstract. A user can click on an entity label or on its DBPO type in order to be redirected to their corresponding pages in DBpedia. Similarly, a user can open the Wikipedia page associated with the subject entity by clicking on the link “(go to Wikipedia page)” that Aemoo shows at the end of the abstract (cf. Fig. 2(a)).
The concept map is interactive and serves, as previously argued, as an entity-centric navigation tool for gathering more detailed information and browsing among DBpedia entities. More in detail, the following elements of the interactive interface are designed to address requirements R3, R4 and R6:
a square box (cf. the arrow with id 1 in Fig. 2(b)) is visualised by hovering the pointer on any node set. Such a box contains the list of the entities belonging to a node set. The list is paginated in order to present 10 entities per page. We refer to these boxes as entity boxes. Each entity in an entity box is depicted along with an icon that indicates the provenance (i.e., Wikipedia, Twitter or Google News). These icons are also shown for node sets in order to summarise the provenance about their contained entities. In an early prototype of Aemoo, the content of the entity boxes was visualised by exploding the node sets as new circular nodes. We ran a first set of preliminary tests by asking volunteer users to play with Aemoo and provide open feedback on its early interface prototype. Most of the feedback suggested minor changes (e.g., on the positioning of the abstract and explanations), which we implemented. Nevertheless, a major request emerged from most users to keep the graph visualising only one-degree relations, and to move elsewhere the content of the sets, in order to keep the interface content readable and easier to navigate. In addition to this empirical observation we claim that this choice is also motivated by the inherent difference between the relation between the subject entity and the node sets, and the relation between the node sets and the entities that they contain. This is why Aemoo now separates entity boxes from the concept map, which keeps the interface easier to navigate and reflects the different semantics of the visualised relations;
the relations between the subject entities and the surrounding node sets are always displayed by using an unlabelled edge representing a set of wikilink relations. Aemoo also shows a list of semantic relations extracted from DBpedia that might express the intension of the unlabelled relation. This list is displayed in a tooltip appearing by mouse hovering the pointer on any edge (cf. Section 3.1). Such relations are (i) represented as
The prefix
a list of explanations appears in a widget on the left-bottom of the interface (cf. the arrow with id 2 in Fig. 2(b)) by hovering on any entity in an entity box. These explanations provide details-on-demand (cf. requirement R6) and come from the Wikipedia text surrounding the wikilink, as described in Section 3.1. The explanations can be used by humans for understanding the semantics of the relations between the entities visualised by the concept map. For example, the arrow with id 2 in Fig. 2(b), points to the explanations of the relations between Immanuel Kant and Königsberg. A user can easily get that the link represents two relations: Immanuel Kant was born in Königsberg, and there is a statue of Kant in that city. Explanations have also associated icons, which indicate their provenance;
any entity in an entity box is clickable. This enables navigation and detail-on-demand capabilities (cf. requirements R2 and R6). In fact, a user can change the focus (i.e., the subject entity) of the concept map at any time by selecting with a click any possible entity in an entity box. When the focus changes, the concept map is rearranged according to the new subject entity and its type by applying the appropriate EKP. Figure 3 shows the situation after some exploration steps that changed the focus to Prussia as subject entity. At the centre-bottom of the interface there is the exploratory history (cf. the arrow with id 4 in Fig. 3), named breadcrumb. The breadcrumb fulfils both requirements R4 and R5 as it allows a user to retrace his exploratory steps at any time and provides her with updated information about her exploratory path.

Aemoo: breadcrumb.

Aemoo displaying curiosities about Alan Turing and Prussia.
The sources to be used for populating the concept map can be chosen by users through a set of checkboxes that appear at the top-right corner of the interface (cf. Fig. 2(b)).
UI components with respect to design requirements
A link located in top-centre of the interface under the search bar (cf. the arrow with id 3 in Fig. 2(b)) allows users to switch to the “curiosities” about a subject entity. When clicking on this link the knowledge is again arranged in a concept map fashion, and enriched with news and tweets just as it happens for the previous summary, but this time the node sets are selected with a different criterion: they are types of resources that are unusual to be included in the description of a country, hence possibly providing insights of what distinguishes, e.g., Prussia, from other countries (cf. Section 3.1). We use the same visualisation metaphor as for the presentation of the core knowledge about a subject entity in order to keep the interface coherent, and to ensure a smooth interaction between the two views. Figures 4(a) and 4(b) show the radial graphs containing the curiosities about Alan Turing and Prussia respectively. It is possible to note how these graphs report unusual or less common relations between the subject entities and the entity types identified by the node sets, e.g., the relation between Alan Turing and Optic nerve (cf. 4(a)) and that between Prussia and Baltic See (cf. 4(b)).
Table 1 provides a summary of Aemoo UI components indicating the requirements they are designed to address.

Overview of the architecture of Aemoo and the EKP extractor.
Aemoo is released as a RESTful architecture: it consists of a server side component implemented as a Java-based REST service, and a client side component based on HTML and JavaScript.
The overview of the architecture at the server side, including also the components for EKP extraction, is depicted in Fig. 5.
The architecture is designed by using the Component-based [23] and the REST [18] architectural styles.
The Knowledge Pattern (KP) extractor is composed of the following components:
KP extraction coordinator which takes care of the coordination of the overall extraction process;
Property path identifier that is responsible for the identification of type paths;
Property path storage that manages the storage of identified paths;
Property path analyser that draws boundaries around paths in order to formalise KPs;
KP repository manager which is responsible for the storage, indexing and fetching of KPs.
Aemoo is composed of the following components:
Aemoo coordinator which coordinates all the activities;
Identity resolver which is in charge of resolving an user query with respect to entity in Linked Data;
KP selector that selects an appropriate KP according to the entity identified;
Knowledge filter which takes care of applying a KP on raw RDF data;
Knowledge aggregator that aggregates knowledge form other sources with respect to the KP selected.
All components are implemented as Java OSGi [53] bundles, components and services, and some of them can be accessed through the RESTful interfaces exposed by the Aemoo REST provider (i.e., Aemoo coordinator and KP selector) and the KP extractor REST provider (i.e., KP extraction coordinator, KP repository manager).
The client side interacts with the other components via REST interfaces through AJAX. Additionally, it handles the visualisation of Aemoo through the JavaScript InfoVis Toolkit,27
In Section 1 we hypothesised that EKPs provide intuitive entity-centric summaries. We also hypothesised that EKPs can be exploited for visualising Linked Data in order to help humans in exploratory search tasks. In Section 4.1 we summarise the experimental setup we defined in [37] and used for assessing the cognitive soundness of EKPs. While, in Section 4.2 we describe the experimental setup used for assessing our working hypothesis.
Cognitive soundness of EKPs
In [37] we carried out a user-based study to assess the cognitive soundness of EKPs. We intended to make EKPs emerge from human consensus, and to compare them to those extracted automatically from Wikipedia. In that study, we asked 17 participants to indicate the core relevant types of things (object types) that could be used to describe a certain type of things (subject types). For example, for the subject “Country” (such as Germany), core object types can be “Language” (e.g. German), “Country”, i.e., other countries with which it borders (e.g. Denmark, Poland, Austria, Czech Republic, Switzerland, France, Luxembourg, Belgium, and Netherlands), etc. The participants had different nationalities (Italy, Germany, France, Japan, Serbia, Sweden, Tunisia, and Netherlands), and different mother tongues, although they were all fluent in English. Having participants from different nationalities and native languages allowed us to observe whether EKPs are perceived as sound units of meaning independently from one specific language or culture, at least for those represented in our study. Although the multi-cultural and multi-language character of EKPs cannot be assessed with proof,28
It has to be remarked that we had a small number of participants and they were all highly educated, fluent in English and mainly from European countries. We assume that participants from European countries have many cultural and linguistic aspects (as speakers of Indo-European languages) in common.
In order to compare the EKPs annotated by humans to the EKPs empirically extracted from Wikipedia, we computed the correlation between the scores assigned by participants, and a ranking function named
In order to assess the validity of our hypothesis (i.e., EKPs provide intuitive entity-centric summaries that can support humans during exploratory search tasks) we carried out a user-based study, whose aim is twofold:
evaluating the system usability of Aemoo;
analysing users’ feedback about their interaction with the UI of Aemoo.
For this purpose, we defined three tasks involving look-up, learning and investigation [30], phases that characterise the strategies that humans adopt while exploring the Web. Each task could be undertaken by using one of three tools: Google, RelFinder, and Aemoo. The tool to be used was automatically selected by a system built for the evaluation, hence it was not a choice of the participants but constraint by the experimental setting. Using three tools allowed us to conduct the evaluation of Aemoo as a comparative analysis. Google and RelFinder provided us two viable and suitable choices to compare with: (i) although Google does not provide an interface specially designed for exploratory search, it is currently the most used exploratory tool on the Web. Users have developed their own methods for exploring and discovering knowledge by using Google, and they are very familiar with its interface. We expected that comparing with Google would give us insights on how Aemoo is perceived as compared to a popular and well known (exploratory) search interface. For this reason, Google provides a reference baseline; (ii) RelFinder [14] is a tool supporting visual exploratory search on Linked Data, it is very popular among Semantic Web experts, less known to the general users. It uses a graph visualisation metaphor and gives users the possibility to filter data according to a number of fixed criteria. Comparing with RelFinder allows us to assess both the usability of our visualisation interface with respect to RelFinder’s, and the effectiveness of the EKP-based relevance criterion for automatic summarisation as compared to manual filtering.
It has to be noted that the three tools rely on different background data sources (i.e. Google on potentially the whole Web, RelFinder on a number of linked datasets, and Aemoo on DBpedia, Twitter and Google News). This would cause an issue during the analysis of results as the data gathered by users from the different tools would not be straightforwardly comparable: one may not be able to judge whether a difference in the task solutions is due to a more effective exploration support or to a larger/smaller set of available data sources. In order to make the results comparable, we constrained the tools background knowledge to Wikipedia (for Google) and to DBpedia (for RelFinder), which constitute the data intersection of the three tools.
The three tasks of the controlled experiment are the following:
subject = Alan Turing
object = University of Manchester
description = Alan Turing worked at the University of Manchester
Here the subject and the object identify the two elements of the relation found, and the description provides an explanation about the nature of such a relation, as it is understood by the participants (e.g., by reading the explanations provided by Aemoo).
For each identified triple, the user has to separately rank its relevance and unexpectedness with respect to the subject, using a 5-point scale ranging from 1 (Irrelevant/banal) to 5 (Relevant/unexpected). Participants were free to start their exploration from any concept, but they were assigned a specific tool to use for exploring information with a maximum time of 10 minutes for each task. They have been instructed to include all possible triples they could get from the tool results, being them interesting, wrong, relevant, obvious, etc., and to rank them accordingly. They were invited to act so that the finalisation of the summary would happen at a later stage, based on their ratings.
Open questions for grounded theory-based analysis
Open questions for grounded theory-based analysis
Each group performed the three tasks (on the same subjects) twice using two different tools,29
The first iteration consisting of the three tasks performed with one tool, and the second iteration consisting of the same three tasks performed with a second tool.
At the end of each iteration, the participants were asked to rate ten statements using a five-point Likert scale (from 1: Strongly Disagree to 5: Strongly Agree) and to answer five open questions. The ten statements were those of the System Usability Scale (SUS) [8]. The SUS is a well-known metric used for evaluating the usability of a system. It has the advantage of being technology-independent, and reliable even with a very small sample size [46]. It also provides a two-factor orthogonal structure, which can be used to score the scale on independent Usability and Learnability dimensions [46].

The interface of the Web-based tool designed and implemented for carrying on the user-study.
Table 2 reports the five open questions aimed at collecting feedback (pros and cons) from the participants about the quality of their experience with the tools. The user feedback from this questionnaire has been used to perform a qualitative analysis of Aemoo based on Grounded theory [48]: a method often used in Social Sciences to extract relevant concepts from unstructured corpora of natural language resources (texts, interviews, or questionnaires).
We developed an ad-hoc web application named AemooEval30
For Task 2 and Task 3, the bottom part of the interface only includes text fields as no ranking is requested. AemooEval takes care of managing task iterations, automatically selecting the tool to be used at a certain iteration by guaranteeing the balance of the alternating sequence of tool usage, storing user feedback and metadata (user id, iteration, time to perform the task, etc.), and enforcing the time constraint.
The three tasks were performed by 32 participants aged between 20 and 35 years, and equally distributed in terms of gender. All the participants were undergraduate students in computer science coming from the University of Bologna in Italy and the University of Paris 13 in France. The participants were divided into 5 groups and supervised by an evaluator, who was in charge to support them during the experiments. The evaluator provided participants with an introductory description of the experiment’s goal and tasks, a brief tutorial about how to use AemooEval, and a brief tutorial on the three tools i.e., Aemoo, RelFinder and Google.
Self-assessment questionnaire
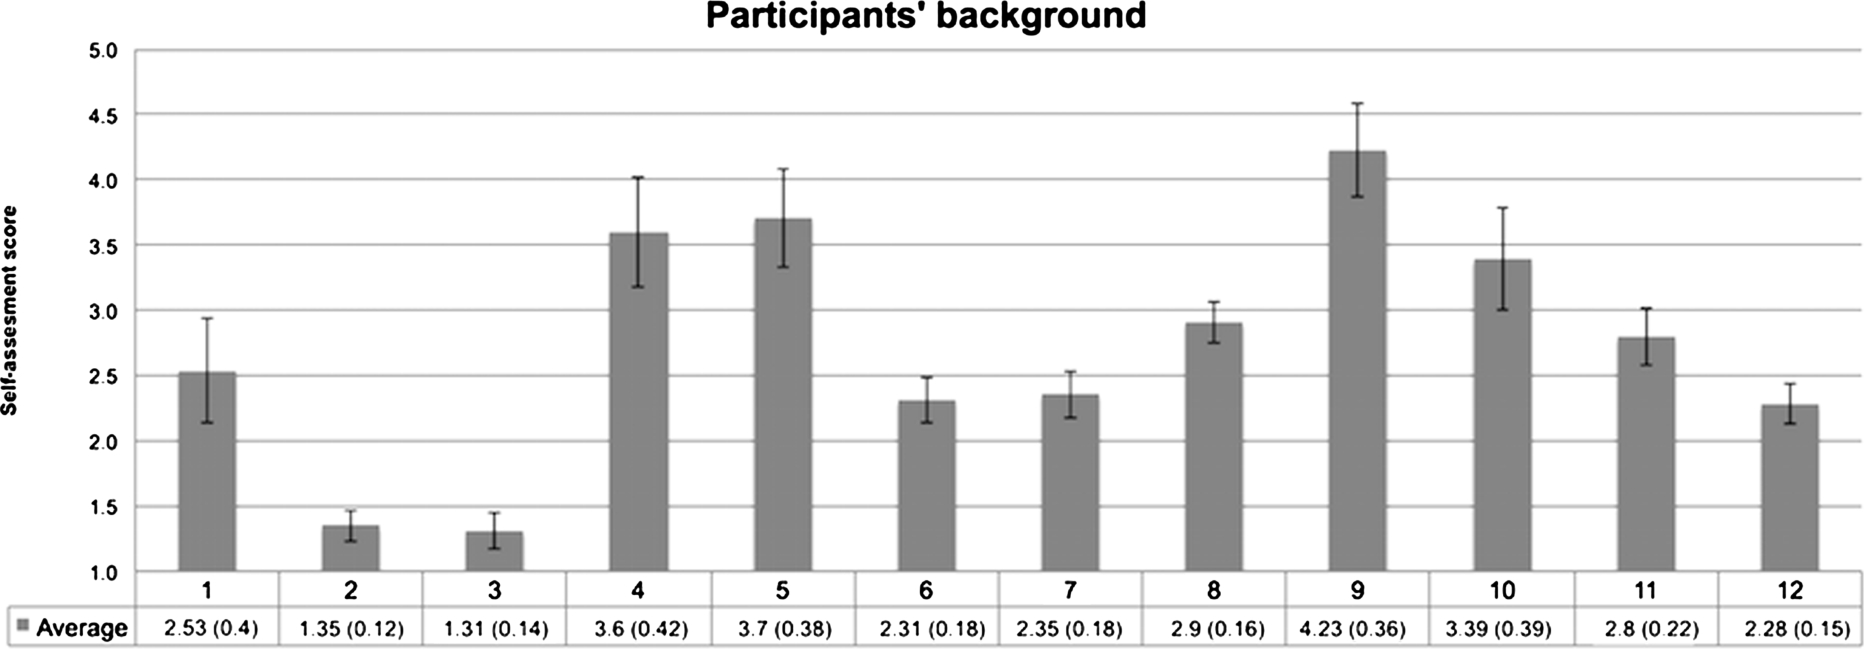
Answers provided by participants to the questions concerning their background related to the experiment. The answers are recorded on a 5-points Likert scale ranging from 1 to 5. Question labels correspond to the question numbers in Table 3. Standard deviation values are expressed between brackets and shown as black vertical lines in the chart.
In order to assess the background and skills of participants, before running the experiments they were asked to rank31
using a 5-point Likert scale from 1: Strongly Disagree to 5: Strongly Agree.
The next section shows and discusses the results of the experiments.
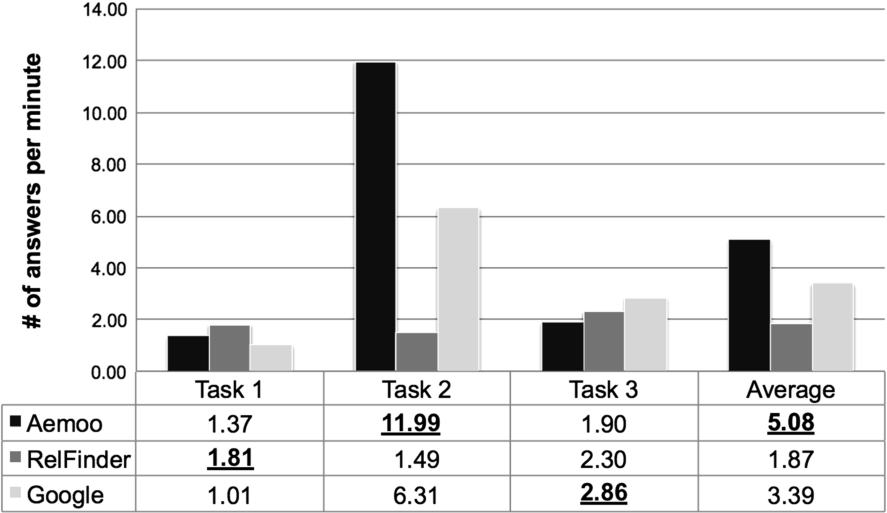
Number of answers per minute for each task and tool.

In order to compare the performance of participants in executing their tasks with the support of the three tools (i.e. Aemoo, RelFinder, and Google), we consider the time spent by participants for providing each answer (e.g. each triple in Task 1). Our intuition is that this measure can give us an insight on how well the tools support users in undertaking their tasks, especially when there is significant difference among the three tools. The observed performance is reported in Fig. 8. On average, Aemoo performs better than RelFinder and Google. The better result on average is due to Task 2, for which Aemoo significantly outperforms the other tools, while RelFinder has a slightly better performance in Task 1, and Google in Task 3.
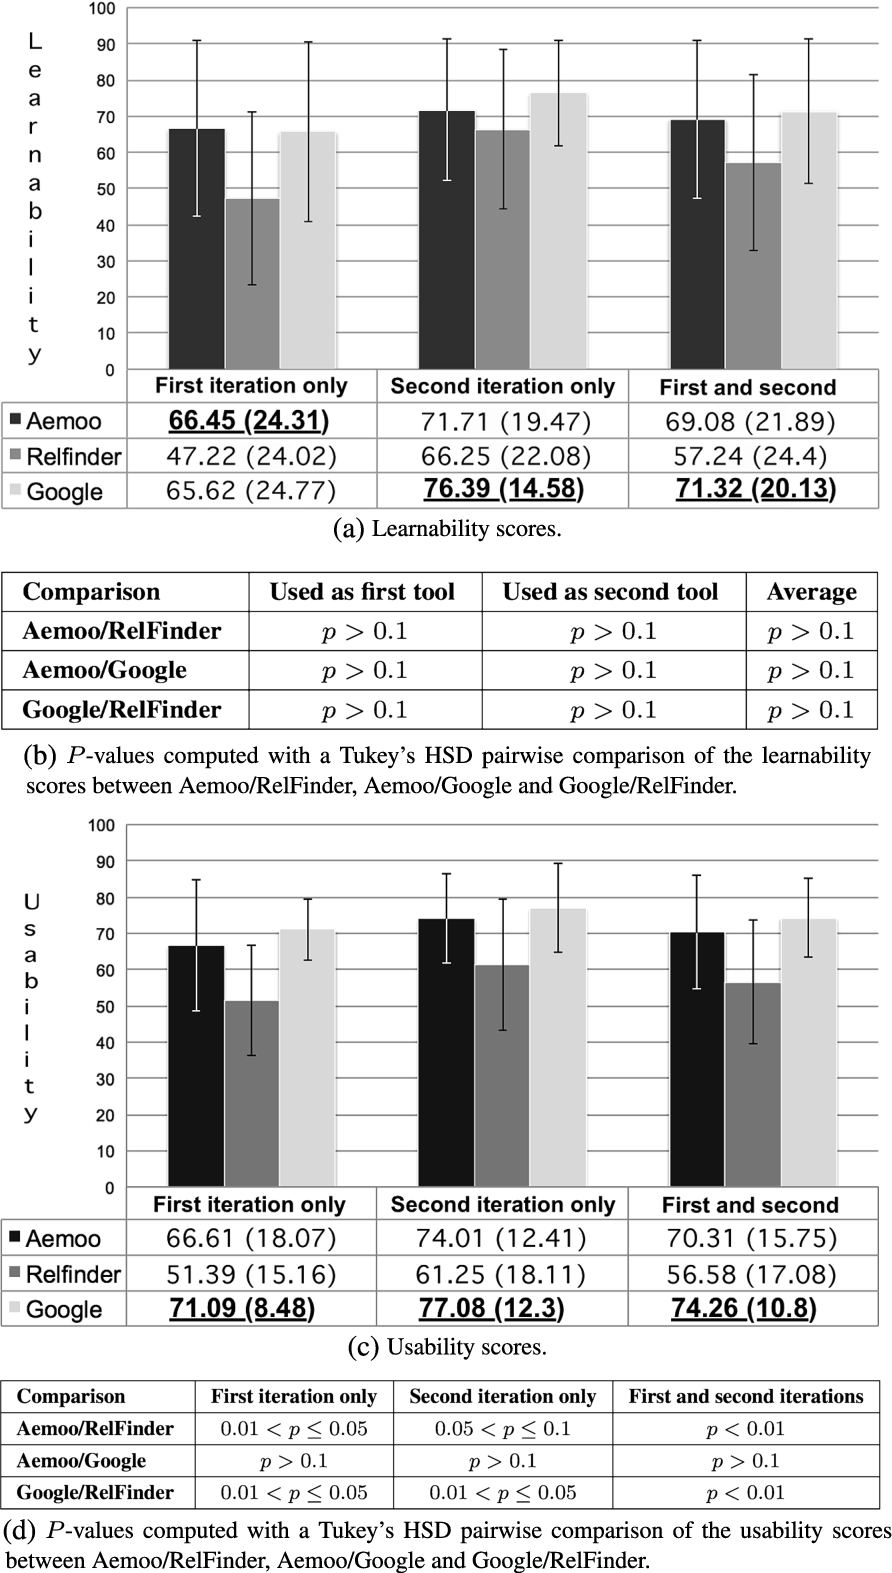
A main focus of our experiment is to asses how Aemoo is perceived by participants in terms of its usability. To this aim, we computed the SUS for the three tools, and show the results in Fig. 9(b). We distinguish the results of the first iterations (only considering the questionnaire filled after performing the tasks the first time) from the results of only the second iterations (only considering the questionnaire filled after the second iteration). We also report the aggregated results of the two iterations. Values between brackets provide standard deviations and they are also reported into the chart as vertical black bars. SUS values range between 0 (Unusable) and 100 (Usable). Based on empirical studies [46], a SUS score of 68 represents the average usability value for a system. The same work demonstrates that SUS allows to reliably assess the usability of a system also with a small number of participants. Aemoo usability is satisfactory (average
Figure 9 shows the p-values, computed by using the Tukey’s HSD (honest significant difference) method, indicating the statistical significance of the pairwise comparison among the three tools. Unfortunately, the evidence is insufficient for claiming the significance of the comparison between Google and Aemoo, however the data are reported for completeness and for possible use in future work. We have strong evidence (
In addition to the overall SUS score, we recorded its two sub-parameters, i.e., Learnability and Usability [29], for the three systems. According to [29], the Learnability score is obtained by analysing the answers provided by participants to the SUS statements 1, 2, 3, 5, 6, 7, 8, and 9. Instead, the Usability score is obtained by analysing the answers provided to the SUS statements 4 and 10. The final value obtained for these parameters is within the range [0 (Hard to learn/use), 1 (Easy to learn/use)]. The results of this analysis are reported in Fig. 10. Figure 10(a) shows the learnability scores for the three systems and their standard deviations. According to Fig. 10(b), the evidence is insufficient for claiming the significance of the comparison, however we report the results for completeness and for possible use in future investigation. As far as Usability is concerned, Fig. 10(c) shows the obtained scores (with their standard deviations). We have strong evidence for claiming that Aemoo is more usable than RelFinder (moderate evidence supports the same claim if we consider the two iterations, separately).
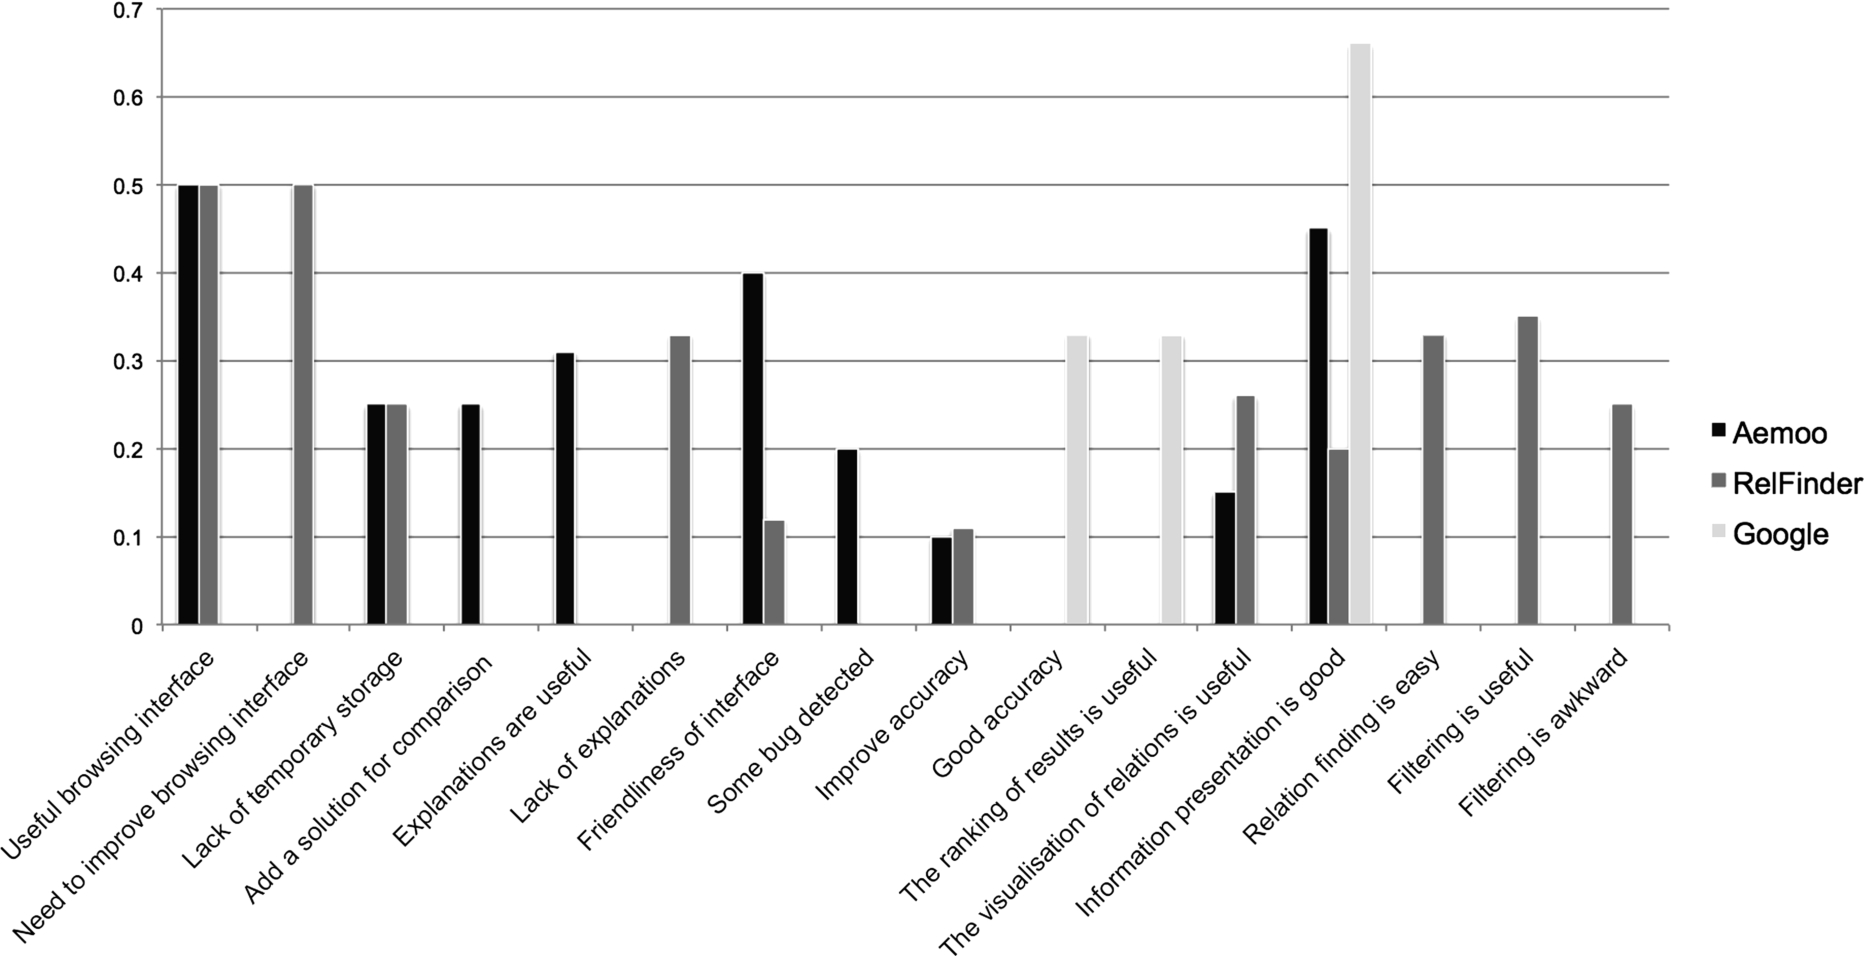
A chart of the most mentioned pros and cons in the open questionnaires.
The results of the open questionnaire (cf. Table 2) were analysed by using the Grounded Theory [48]. We proceeded first with the open coding and then with the axial coding. The open coding aims at extracting actual relevant sentences – called codes – from the answers. The axial coding rephrases the original codes so as to define conceptual clusters capturing semantic connections from codes. Each conceptual cluster was associated with a priority score (the greater the amount of codes feeding a conceptual cluster, the highest its priority) in order to identify the most important issues arising from participants’ feedback. Figure 11 shows the results of the open questionnaire, limited to the most frequently mentioned codes (ordinate values report the number of mentions normalised on a scale between 0 and 1).
Finally, Fig. 12 shows the ratings (based on a Likert scale) that participants provided for judging relevance and unexpectedness of the results provided by the three systems during Task 1 (cf. Section 4.2), considering both iterations. Aemoo (
“r” stands for relevance, “u” stands for unexpectedness. Subscripts indicate the iteration.
Relevance and unexpectedness ratings according to participants’ feedback, by taking into account the specific iteration.

Relevance and unexpectedness ratings (and their standard deviations between brackets) according to participants’ feedback.
For this reason our evaluation focused on (i) the analysis of the time required by participants for completing their tasks, (ii) the SUS, (iii) a grounded analysis of open user feedback, and (iv) user ratings about relevance and unexpectedness of the results provided by the tools.
The time needed by participants for completing the experiment tasks might be biased by a variety of factors that include, for example, users’ expertise about a certain topic or their familiarity with the system. However, in our experiment participants resulted (i) to be not Semantic Web experts, (ii) to be unfamiliar with the tools (with the exception of Google), and (iii) to be unfamiliar with the subjects of the tasks (cf. Fig. 7). Hence the observed performances give us a reasonably reliable insight about the effectiveness of the different tools in supporting exploratory search tasks.
As far as UI usability is concerned, the SUS-based analysis provided us with a good overview of the system performance. Aemoo can be considered averagely usable, which is a satisfactory result especially considering the comparison with RelFinder usability. Also, the results of the task-driven experiments enforce the findings related to EKP cognitive soundness, i.e. EKPs provide an effective filtering criteria for building automatic entity summarisations. However, the same results point out the need of further improving Aemoo including smart mechanisms for supporting exploratory browsing, especially for identifying relations between two or more entities.
We acknowledge significant space for improvements and, in this respect, the grounded analysis (based on open questionnaire) provides us with insights on what are the most critical issues to be addressed. In more detail, the main cons reported by users, which we will consider in future development of the system, include the lack of a mechanisms to perform comparison among different entities, and the lack of a mechanisms for supporting temporary storage (e.g., a basket).
In addition to these, we think that the automatic relation finding (provided by RelFinder), if appropriately integrated in the interface, can provide additional value to Aemoo results e.g. by indicating when a specific semantic relation is known between two entities. This hypothesis is supported by the fact that we received a considerable number of positive comments from the grounded analysis related to the relation finding mechanism of RelFinder (cf. the entry “Relation finding is easy” in Fig. 11). Some participants appreciated the facet-based filtering provided by RelFinder and a comparable number of them judged it as awkward. This is probably due to the potentially huge number of relations between entities that can be proposed as filtering options to the users. In our opinion, this issue is mainly due to scalability problems that, if addressed appropriately, can turn this functionality into an added value to data visualisation. Based on this observation, we plan to investigate the trade-off between the automatic (e.g., based on EKPs in Aemoo) and manual filtering, for future integration in Aemoo.
As far as information presentation is concerned, Google resulted to be the best system among the three. Although this may be a fair assessment, it is reasonable to think that this judgement is due to the extreme popularity of its interface. If we consider only Aemoo and RelFinder, systems with which the participants were unfamiliar with (cf. Fig. 7), Aemoo received a higher number of positive comments concerning information presentation, which further supports the positive outcomes of the EKP assessment analysis and of the SUS analysis. Participants particularly appreciated Aemoo’s browsing interface and the way relations among entities were visually presented (cf. Fig. 11). Also, users reported positive comments about the visualisation of explanations, which they found useful, indicating that Aemoo succeeds in providing this type of data-on-demand.
A final aspect worth remarking is the feedback about relevance and unexpectedness, which together provide an indication of the capability of the system to produce serendipitous results. Serendipity can be informally defined as beneficial discovery that happens in an unexpected way; it has been recently described as unexpected relevance [50]. The intuition is simple: the more a result is at same time relevant and unexpected, the more it is serendipitous. However, this is a tricky aspect to evaluate, due to its strong subjective character. Furthermore, considering the relatively small population involved in our experiments, we have insufficient evidence for claiming significance. Notwithstanding these limits, the results we obtained are worth reporting and allow us to formulate reasonable speculation on their interpretation. The results of the self-assessment questionnaire (cf. Fig. 7) show that all participants declared comparable level of knowledge about the experiment subjects (i.e. low standard deviation values). This in addition to the good ratings provided for relevance and unexpectedness suggests that Aemoo shows a promising behaviour as far as serendipity is concerned, i.e. it was able to provide users with relevant and unexpected results during the experiments.
Many existing solutions for exploring Linked Data are based on semantic mash-up or browsing applications. Examples are [26,27,54] that leverage the semantic relations asserted in the linked datasets without applying any criterion for defining a boundary, which could be used for tailoring or contextualising knowledge. For example, RelFinder [27] provides the visualisation of existing relations between two of more DBpedia entities. These relations can be simple or can include more complex paths. The visualisation of relations can be manually filtered by the user according to criteria of relations length, entity types and property names.
An increasing number of research has been done on more sophisticated relevance criteria for addressing the lack of knowledge boundary, or the heterogeneity problem, for summarising, recommending or browsing Linked Data. Many of them present novel approaches (see below for a quick overview), however to the best of our knowledge, none of them leverages ontology patterns (i.e., EKPs), which is the main contribution that distinguishes our approach from existing ones.
Other systems that rely on faceted browsing for filtering results include Yovisto [56], which is a platform that provides exploratory capabilities specialised in academic lecture recordings and conference talks, and Visor [43]. Visor facilitates the navigation process by introducing a multi-pivot paradigm, which allows users to identify key elements in the data space, called pivots. Different filtering solutions are proposed by the Discovery Hub [31], LED [33] that mainly differ from Aemoo because the user’s exploratory path is used for computing results at each exploratory step. Hence, the filtering mechanism does not depend on fixed schemas such as EKPs in Aemoo. In fact, the Discovery Hub uses a spreading activation algorithm for weighting an origin entity and consequently propagating the weights to its neighbours, while LED exploits users’ query in order to create tag clouds aimed at suggesting related knowledge to users during exploration search tasks.
The radial visualisation used by Aemoo is in general a well known visualisation metaphor in literature [2,17,24,25]. Aemoo uses the radial visualisation for rendering concept maps deriving from EKPs that provide a cognitive sound and an intuitive way for representing knowledge [36]. There are systems that allow to build graphical concept maps, such as Cmap33
EKPs can be compared to Fresnel lenses [42] that provide a solution for defining implementation-independent templates for data presentation and are used by some state of the art systems, e.g., DBpedia Mobile [5], Marble34
MORE [16] leverages DBpedia, Freebase and LinkedMDB in order to recommend movies. It computes similarities between movies thanks to an adaptation of the Vector Space Model (VSM). Seevl [39] is a recommendation system that provides personalised access and exploration of a knowledge based about music facts, which is created by exploiting DBpedia. The core of the system is an algorithm, called DBrec, which computes the relatedness among entities of the knowledge base by looking at shared relations, both incoming and outgoing. The authors in [28] present a recommendation system for retrieving music related to a point of interest (POI). The system exploits a spreading activation algorithm in order to weight the relatedness between musicians and POIs in DBpedia.
This paper presents a novel approach for Linked Data exploration which uses Encyclopedic Knowledge Patterns (EKPs) as relevance criteria for selecting, organising, and visualising knowledge. EKPs were discovered by mining the linking structure of Wikipedia. A system called Aemoo has been implemented for supporting EKP-driven exploration as well as integration of data coming from heterogeneous resources, namely static (i.e., DBpedia and Wikipedia) and dynamic knowledge (i.e., Twitter and Google News).
Our work grounds on two working hypotheses: (i) EKPs provide a unifying view as well as a relevance criterion for building entity-centric summaries and (ii) they can be exploited effectively for helping humans in exploratory search tasks.
Both hypotheses were validated by means of controlled, task-driven user experiments aimed at assessing the usability of Aemoo, and its ability to provide relevant and serendipitous information as compared to two existing tools: Google and RelFinder.
Currently, we are working on several extensions. Examples include:
improving the automatic interpretation of hypertext links by hybridising NLP with Semantic Web techniques. In this respect we have recently obtained very good results by designing a novel Open Knowledge Extraction (OKE) approach and its implementation, called Legalo35
providing visual analytics interfaces that compare different entities having the same type;
providing different views on the same entity by allowing users to change the applied lens, i.e., EKP;
adding a basket functionality which allows users to save the summary data of their exploration in RDF;
integrating the EKP-based approach with user profiles for boundary creation.